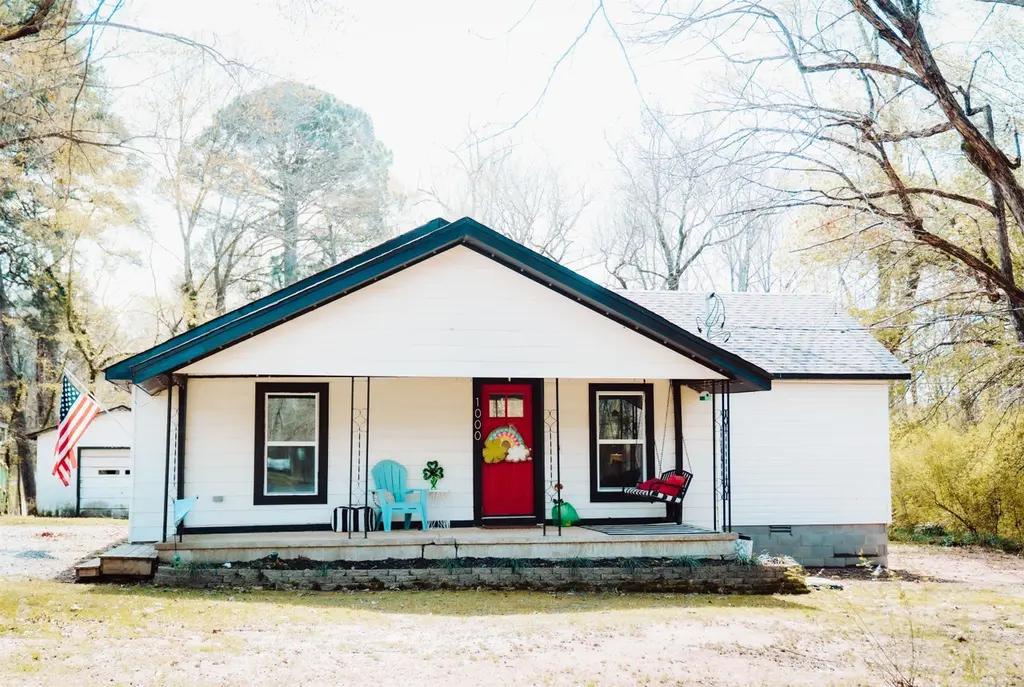
1000 Kenwood · Benton, AR
Flood risk 1/10 · Minimal
- FEMA flood zone
- X (unshaded)
- Chance of flooding over 30 yrs
- 0.0%
- Est. flood insurance / yr
- $507 – $1,088
Fire risk 3/10 · Minor
- Est. fire insurance / yr
- $1,499 – $2,785
Heat risk 6/10 · Moderate
- Hot days now (above 110°F)
- 7 days/yr
- Hot days in 30 yrs
- 20 days/yr
Wind risk 4/10 · Minor
- Chance of severe wind over 30 yrs
- 10.0%
Air-quality risk 2/10 · Minimal
- Unhealthy air days now
- 0 days/yr
- Unhealthy air days in 30 yrs
- 1 days/yr
Risk factors via First Street. Map © Google.
Why this score? — see what drove the D- grade
The composite is a weighted blend of 9 inputs, each scored 0–100. Each bar is that input's sub-score; the figure is the points it added to the 100-point composite (weight × sub-score).
- Cash flow +14.0/30.0
- ARV discount +5.3/15.0
- DSCR +4.2/10.0
- Schools +4.1/10.0
- Livability +3.3/5.0
- Rent growth +2.7/5.0
- 1% rule +2.6/10.0
- Condition / age +2.5/5.0
- Appreciation +0.0/10.0
$179,900
🖨 Deal sheet (PDF) 📄 Offer letter ✓ Due diligence
Listing remarks
Welcome to this beautifully updated home in Benton! Now offering 3 bedrooms and 2 full bathrooms, this property blends new updates with everyday comfort. Situated on a spacious lot, you'll enjoy plenty of room to spread out, along with a large shop featuring a convenient roll-up door- perfect for storage, hobbies, or a workshop. Located just minutes away from the interstate and local amenities, this home offers both privacy and convenience. Don't miss your chance to see it!
Key facts
- Spacious lot
- Updated home
- Roll-up door
Tags
Neighborhood map
What this means for you Summary
Snapshot
- This is a 3-bed/1.0-bath single-family listed at $180k.
Deal economics
- At list price, monthly cash flow is $22 ($258/yr) — positive.
- The deal already cash-flows at list — no discount required.
- To meet the 1% rule (rent ≥ 1% of price), the offer needs to be $136k (24.5% below list).
- Recommended offer: $136k (24.5% below list) — sets the bar for 1% rule.
- Cap rate 6.4% vs local median 4.4% in Benton — top-decile yield for the area; either an underpriced asset or a hidden risk that comps aren't pricing in. Stress-test before assuming the spread holds.
Location & tenants
- Location reads 66/100 on livability (#119 in AR) — a middle-class / working-renter tenant base. Strengths: cost of living A+, housing A+; Watch: crime D, amenities F, commute F.
- Benton School District (suburban): math 51% / reading 43% proficiency, ranked #25 of 238 in AR (top 10%) — families likely to look elsewhere, expect single-tenant / working-renter base with shorter leases.
- Zoned schools: Benton Middle School (math 54% / reading 40%, grade D+, #46 of 201 statewide, top 24%, 1,367 students, 44% FRL).
- Market conditions: Rents flat; 203 active listings in the ZIP; 7 comparable units currently listed for rent nearby; rentals at typical pace (median 25d on market — plan ~3-4 weeks tenant-placement turnaround); 43% of comp listings sitting > 30 days — soft ceiling on asking rent; 446 units permitted in Saline County in 2024 (0 in 5+ unit buildings).
Forward outlook
- Local home prices are declining (-3.0%/yr); year-one equity from $1k of loan paydown is wiped out by about $5k of value loss. Plan a longer hold.
- Saline County population projected at +39% by 2050 — long-run rental-demand tailwind backs the buy-and-hold thesis.
Negotiation context
- Only 13 days on market — expect competitive offers; lowballing is unlikely to land.
- 2 sale attempts since 2y ago with the ask held roughly flat each time — persistent listings suggest the price (not the market) is what's stuck; bring a comps-based counter.
- Current owner paid $32k; list at $180k implies a 454% gain — meaningful room to come down on a strong offer.
Risks & watch-outs
- Watch-outs: built in 1954 — expect roof / HVAC / electrical / plumbing capex.
- Climate carrying-cost: extreme-heat days projected 7→20/yr by 2055 (HVAC capex compounding) — expect insurance premiums to compound above CPI over the hold.
Questions for the listing agent
- Built in 1954 — when were the roof, HVAC, electrical panel, plumbing, and water heater last replaced?
- Is there a deadline driving the sale (1031 exchange, divorce, estate, relocation)? That informs how much negotiation room exists.
- Crime grade is D in this area — have there been break-ins, vandalism, or insurance claims at this property in the last 3 years? What carrier currently insures it and at what premium?
- The area grade is low — what's the realistic commute time and amenity access for the typical tenant pool here? Any planned neighborhood developments (good or bad) we should know about?
- What's the average days-on-market for RENTAL listings here right now (not sales)? A rising rental-DOM trend means longer vacancies and softer asking-rent achievability than the comps imply.
- What's the recent tenant-quality profile in this submarket — average credit score on applications, eviction rate, late-payment / NSF rate, and stable-employment percentage? A property-management company in the area should have these aggregated.
- How much new for-sale + rental construction is in the pipeline within 1–3 miles? Heavy new supply typically softens prices + rents 12–24 months out; constrained supply supports both.
Investment metrics
- 1% rule
- 0.76% ✗
- Cap rate
- 6.44%
- Cash-on-cash
- 0.51%
- DSCR
- 1.02
- GRM
- 11.0
CMA / ARV
- ARV (on-the-fly)
- $171,360
- Comps found
- 7
Show comp detail 7 sales within ~0.75 mi
| Address | Dist | Beds/Ba | Sqft | Sold | Price | $/sf | Match |
|---|---|---|---|---|---|---|---|
| 803 Heights Rd | 0.23mi | 2/1.0 (-1) | 1,063 (-5%) | 10mo | $126,000 | $119 | 68 |
| 909 Palmer Ave | 0.31mi | 3/1.0 | 1,116 (-0%) | 23mo | $110,000 | $99 | 66 |
| 809 Palmer | 0.33mi | 3/2.0 | 1,056 (-6%) | 10mo | $100,000 | $95 | 63 |
| 721 W Narroway | 0.48mi | 3/1.5 | 1,260 (+12%) | 2mo | $199,900 | $159 | 53 |
| 914 & 918 Heights Rd | 0.24mi | 3/1.0 | 962 (-14%) | 16mo | $225,000 | $234 | 52 |
| 927 W Sevier St | 0.69mi | 3/1.0 | 1,176 (+5%) | 14mo | $179,900 | $153 | 48 |
| 308 N Olive | 0.68mi | 3/2.0 | 1,040 (-7%) | 5mo | $172,000 | $165 | 48 |
Match score weights: distance 35% · size 25% · config 20% · recency 20%. Top-matched comps best support the ARV.
Projected returns pro-forma
-3.0% appreciation · 0.73% rent growth · sell at horizon
- IRR
- -17.7%
- Equity multiple
- 0.39×
- Total profit
- $-30,914
- Equity at exit
- $26,824
- IRR
- -14.2%
- Equity multiple
- 0.26×
- Total profit
- $-37,449
- Equity at exit
- $15,554
Cash invested: $50,372 (down + closing). Projections, not guarantees.
Landlord ↔ Tenant lean methodology
- Overall (STATE)
- 92 Strongly Landlord-Friendly
- State Arkansas
- 92 Strongly Landlord-Friendly · R+14
- County
- — inherits STATE
- City
- — inherits STATE
ZIP-level market 72015
- Home prices YoY
- -11.1%
- Rents YoY
- 0.7%
- Active inventory
- 203
- Price-to-rent
- 11.0×
Monthly cashflow live
- Estimated rent
- $1,359 high interval (Pro) →
- Mortgage (P&I)
- −$943
- Tax from tax record
- −$34 /mo · $402/yr
- Insurance
- −$75
- HOA
- −$0
- Vacancy / Maint / Mgmt
- −$285
- Net cashflow
- $22
Break-even live
Sensitivity live
| Price | -10% $123 | -5% $72 | +0% $22 | +5% $-29 | +10% $-80 |
|---|---|---|---|---|---|
| Rent | -10% $-86 | -5% $-32 | +0% $22 | +5% $75 | +10% $129 |
| Rate | -1.0pp $112 | -0.5pp $67 | base $22 | +0.5pp $-25 | +1.0pp $-73 |
UW: 25.0% down · 7.5% · 30yr · 1.5% tax · 5.0% vac · 8.0% maint · 8.0% mgmt
Financing live
Cash to close
- Down payment
- $44,975
- Closing costs
- $5,397
- Reserves months
- —
- Total cash needed
- —
Loan-product check · same deal, 3 products live
Conventional
25% down · 7.5% · 30yr
- Down + closing
- —
- Monthly P&I
- —
- Monthly cashflow
- —
- DSCR
- —
- Eligible?
- —
Personal DTI + credit; lowest rate.
DSCR
20% down · 8.5% · 30yr
- Down + closing
- —
- Monthly P&I
- —
- Monthly cashflow
- —
- DSCR
- —
- Eligible?
- —
No personal income docs; deal must DSCR.
Hard money
10% down · 12.0% · 12mo
- Down + closing
- —
- Monthly P&I
- —
- Monthly cashflow
- —
- DSCR
- —
- Eligible?
- —
Short-term bridge; refi at stabilization.
Rent comps 7 comps
| Address | Beds | Baths | Sqft | Rent | $/sqft | DOM | Units | Dist |
|---|---|---|---|---|---|---|---|---|
| 904 Sherris Ln Benton, AR | 3.0 | 1.0 | 885 | $1,225 | $1.38 | 16d | 1 | 0.14mi |
| 907 Denver Benton, AR | 3.0 | 1.0 | 980 | $1,200 | $1.22 | 25d | 1 | 0.29mi |
| 1908 Rio Grande Benton, AR | 3.0 | 2.0 | 1226 | $1,500 | $1.22 | 16d | 1 | 0.90mi |
| 204 Dobbs St Benton, AR | 3.0 | 1.5 | 1160 | $1,375 | $1.19 | 16d | 1 | 0.93mi |
| 624 Denton Benton, AR | 2.0 | 1.0 | 1092 | $1,200 | $1.10 | 45d | 1 | 1.01mi |
| 724 S Main Benton, AR | 2.0 | 1.0 | 868 | $1,195 | $1.38 | 45d | 1 | 1.47mi |
| 609 S 2nd St Benton, AR | 3.0 | 2.0 | 1248 | $1,295 | $1.04 | 45d | 1 | 1.49mi |
Listing history 6 events
-
2026-04-02status Under Contract
-
2026-03-20$179,900 New Listing
-
2024-03-29historical
-
2024-03-28historical Take Backups
-
2024-03-26$127,900 New Listing
-
2015-05-11soldstatus $32,500
ⓘ Source: listings_history table (triggers on properties + properties_extension) + one-shot
backfill from property_details.listing_events for pre-trigger history.
Tax reassessment forecast AR · Resets to sale price
- Current annual tax
- $402 · $34/mo
- Projected year-2 tax
- $1,151 · $96/mo
- Expected delta
- +$749/yr (+$62/mo · 186.2%)
ⓘ Screening estimate from a state-policy table — verify with the county assessor before closing.
Climate risk First Street
- Flood 1/10 Low FEMA zone X (unshaded) · 0% chance over 30 yrs
- Wildfire 3/10 Moderate
- Heat 6/10 Major 7 d/yr ≥110°F today · 20 d/yr by 30 yrs out
- Wind 4/10 Moderate 10% chance of damaging wind over 30 yrs
- Air quality 2/10 Low 0 unhealthy d/yr today · 1 by 30 yrs out
Nearby sold comps map
Loading sold comps map…
Walkable amenities ~0.75 mi
Loading nearby amenities…
Taxation est. · year 1
- Rental income
- $16,305
- − Mortgage interest
- −$10,077
- − Property taxes
- −$402
- − Insurance
- −$900
- − Repairs & maintenance
- −$1,304
- − Management
- −$1,304
- − Depreciation
- −$5,233
- Taxable loss
- −$2,916
- Est. tax savings @ 24.0%
- +$700
- After-tax cash flow
- $958/yr
For passive investors: Depreciation is non-cash, so a rental often shows a tax loss while cash-flowing — sheltering income. Rental losses are passive: they offset passive income freely, and up to $25,000/yr can offset ordinary (W-2) income if you actively participate and your MAGI is under $100k (phasing out to $0 by $150k); unused losses carry forward. On sale, claimed depreciation is recaptured at up to 25%, and gains may owe capital-gains tax (a 1031 exchange can defer both). Figures are a year-1 estimate at your 24.0% rate — not tax advice; consult a CPA.
Schools (NCES district)
- District
- Benton School District
- NCES district ID
- 0502960
- Math proficiency
- 51% ▼ -10.00%
- Reading proficiency
- 43% ▼ -10.00%
- Median HH income
- $51,870
- Composite
- 40.52/100
- National rank
- #3707
- State rank
- #25 of 238 in AR
Livability — Benton
- Score
- 66/100
- State rank
- #119
- US rank
- #11460
Category grades
Schools grade is shown separately in the Schools card above.
Census & demographics
- Census place
- Benton, AR
- County
- Saline County · 77,216 people
- City population
- 58,767
- Metro
- Little Rock-North Little Rock-Conway, AR
- Population (ZIP)
- 28,712
- Household income
- $66,107
- Rent vs Own
- Severe rent burden
- 439.0
Population outlook (Saline County) Hauer SSP2
- Today (2025)
- 140,141 people
- By 2030
- 151,233 · +7.9%
- By 2040
- 173,100 · +23.5%
- By 2050
- 194,368 · +38.7%
- By 2075
- 245,295 · +75.0%
- By 2100
- 279,117 · +99.2%
Race, ethnicity, and origin ACS 2023
- Neighborhood character
- Predominantly White (79%)
- Race & ethnicity
- White 79% Black 10% Two or more races 6% Hispanic / Latino 5%
- Common ancestry
- Slovak 3% Italian 2% Lithuanian 1%
- Foreign-born
- 2% · Canada, Vietnam
- Languages at home
- 97% English-only · Spanish 3% Vietnamese 0%
Political lean MEDSL · Saline
- 2024 margin
- Solid R (+40.1) · D 28.8% · R 69.0% · Other 2.2%
- 2008→2024 swing
- +0.8pp no change · 2008: -41.0pp · 2024: -40.1pp
- All cycles
- 2024: R+40.1 2020: R+41.2 2016: R+43.5 2012: R+42.7 2008: R+41.0
Not yet ingested
- Civics
- —
Market trends
- HPI YoY
- ▼ -29.11%
- Current HPI
- 234.4644
- Rent YoY
- ▲ 0.73%
- Metro
- Little Rock-North Little Rock-Conway, AR
- State GDP YoY
- ▲ 3.80%
- F500 in state
- 10
Industry mix (Fortune 500 HQ in AR)
| Industry | F500 HQs | Revenue |
|---|---|---|
| Retail | 1 | $681B |
|
||
| Food / Agriculture | 1 | $53B |
|
||
| Retail / Energy | 1 | $22B |
|
||
| Transportation / Logistics | 1 | $12B |
|
||
| Energy | 1 | $4B |
|
||
Price history
+453.5% since first listed6 events — show timeline
- 2026-04-02 Pending — CARMLS
- 2026-03-20 Listed $179,900 CARMLS
- 2024-03-29 Listing Removed — CARMLS
- 2024-03-28 Contingent — CARMLS
- 2024-03-26 Listed $127,900 CARMLS
- 2015-05-11 Sold (Public Records) $32,500 Public Records
Property tax history
+10.6%/yrLatest (2025): $402 · -19.9% YoY. Source: county tax records.
Cash-flow waterfall
monthlySold comps — $/sqft
last 12 mo · ≤1 miLoading sold comps…