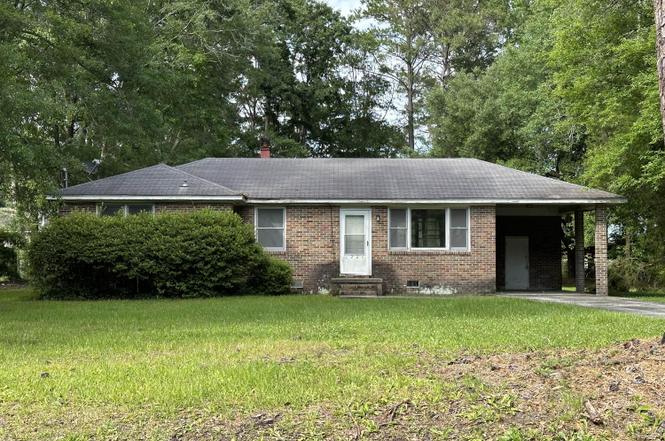
6224 Bevington Rd · Hollywood, SC
Flood risk 1/10 · Minimal
- FEMA flood zone
- X (unshaded)
- Chance of flooding over 30 yrs
- 0.0%
- Est. flood insurance / yr
- $507 – $1,088
Fire risk 5/10 · Moderate
- Est. fire insurance / yr
- $783 – $1,453
Heat risk 9/10 · Severe
- Hot days now (above 106°F)
- 7 days/yr
- Hot days in 30 yrs
- 18 days/yr
Wind risk 8/10 · Major
- Chance of severe wind over 30 yrs
- 98.0%
Air-quality risk 3/10 · Minor
- Unhealthy air days now
- 3 days/yr
- Unhealthy air days in 30 yrs
- 3 days/yr
Risk factors via First Street. Map © Google.
Why this score? — see what drove the C grade
The composite is a weighted blend of 9 inputs, each scored 0–100. Each bar is that input's sub-score; the figure is the points it added to the 100-point composite (weight × sub-score).
- Cash flow +19.0/30.0
- ARV discount +15.0/15.0
- DSCR +6.0/10.0
- 1% rule +5.1/10.0
- Schools +4.3/10.0
- Livability +3.0/5.0
- Rent growth +2.5/5.0
- Condition / age +2.5/5.0
- Appreciation +0.0/10.0
$205,000
🖨 Deal sheet 📄 Offer letter ✓ Due diligence
Listing remarks
Attention all Investor/Rehab/Renovation Buyers - This property is 1 of 30 being sold by the Seller and can be purchased individually or as a group. A fantastic opportunity for investors, owner-occupants, or anyone looking for a renovation project. PLEASE NOTE: Properties are being sold strictly as-is and Seller will make no modifications or repairs. If square footage is important, please measure. Seller has set a call for offers to ensure all interested parties have equal opportunity to preview the homes, so please send your highest and best offer when you submit. * * * DUE TO TROPICAL STORM DEBBY the NEW OFFER DEADLINE is SUNDAY, 8/18/2024 at 11:59PM. * * * Seller will not respond to
Key facts
- Investors
- Equal opportunity
- Owner-occupants
Tags
Neighborhood map
What this means for you Summary
Snapshot
- This is a 3-bed/1.5-bath single-family listed at $205k.
Deal economics
- At list price, monthly cash flow is $215 ($3k/yr) — positive.
- The deal already cash-flows at list — no discount required.
- Meets the 1% rule at list price ($2k rent vs $205k).
- Recommended offer: $199k (3.0% below list) — sets the bar for market timing.
- Cap rate 7.6% vs local median 1.0% in Hollywood — top-decile yield for the area; either an underpriced asset or a hidden risk that comps aren't pricing in. Stress-test before assuming the spread holds.
Location & tenants
- Location reads 60/100 on livability (#220 in SC) — a middle-class / working-renter tenant base. Strengths: crime A+, housing A+, cost of living B+; Watch: amenities F, commute F, health & safety F.
- Charleston 01 (urban): math 48% / reading 53% proficiency, ranked #7 of 80 in SC (top 9%) — acceptable for families but not a draw, mixed tenant base, ~2y average lease.
- Zoned schools: E.B. Ellington Elementary (math 12% / reading 8%, grade F, #587 of 597 statewide, top 99%, 353 students, 100% FRL); Baptist Hill High (math 11% / reading 26%, grade F, #196 of 196 statewide, top 100%, 552 students, 100% FRL) — zoned schools average 100% FRL vs 44% district-wide (56 pts higher); higher-poverty schools than district average — tighter screening recommended.
- Zoned-school proficiency averages 14% at this address vs 50% district-wide (-36 pts) — the specific schools serving this property underperform the Charleston 01 average; the district grade overstates school quality for this exact location.
- Market conditions: 157 active listings in the ZIP; 4,156 units permitted in Charleston County in 2024 (857 in 5+ unit buildings).
Forward outlook
- Local home prices are declining (-3.0%/yr); year-one equity from $1k of loan paydown is wiped out by about $6k of value loss. Plan a longer hold.
- Charleston County population projected at +44% by 2050 — long-run rental-demand tailwind backs the buy-and-hold thesis.
Negotiation context
- It's been on market 39 days — a 3% lower offer ($199k) is reasonable based on typical stale-listing flexibility.
- 2 sale attempts since 2y ago with the ask held roughly flat each time — persistent listings suggest the price (not the market) is what's stuck; bring a comps-based counter.
- Current owner paid $40k; list at $205k implies a 412% gain — meaningful room to come down on a strong offer.
Risks & watch-outs
- Climate carrying-cost: severe wind risk, 98% chance of damaging wind over 30y; moderate wildfire risk; extreme-heat days projected 7→18/yr by 2055 (HVAC capex compounding) — expect insurance premiums to compound above CPI over the hold.
Questions for the listing agent
- It's been on market 39 days. Have you received any prior offers? Is the seller open to a 3% concession, seller financing, or rate buy-down credit?
- Built in 1961 — when were the roof, HVAC, electrical panel, plumbing, and water heater last replaced?
- Is there a deadline driving the sale (1031 exchange, divorce, estate, relocation)? That informs how much negotiation room exists.
- Schools are F-rated, which usually means shorter tenancies and higher turnover. Who's the typical renter profile here, and what's been the actual vacancy rate?
- What's the average days-on-market for RENTAL listings here right now (not sales)? A rising rental-DOM trend means longer vacancies and softer asking-rent achievability than the comps imply.
- What's the recent tenant-quality profile in this submarket — average credit score on applications, eviction rate, late-payment / NSF rate, and stable-employment percentage? A property-management company in the area should have these aggregated.
- How much new for-sale + rental construction is in the pipeline within 1–3 miles? Heavy new supply typically softens prices + rents 12–24 months out; constrained supply supports both.
Investment metrics
- 1% rule
- 1.01% ✓
- Cap rate
- 7.55%
- Cash-on-cash
- 4.50%
- DSCR
- 1.20
- GRM
- 8.3
CMA / ARV
- ARV (on-the-fly)
- $318,864
- Comps found
- 12
Show comp detail 12 sales within ~0.75 mi
| Address | Dist | Beds/Ba | Sqft | Sold | Price | $/sf | Match |
|---|---|---|---|---|---|---|---|
| 6218 Bevington Rd | 0.02mi | 2/1.5 (-1) | 1,075 (-8%) | 3mo | $287,000 | $267 | 79 |
| 6214 Gritman Dr | 0.66mi | 3/2.0 | 1,181 (+1%) | 9mo | $301,400 | $255 | 58 |
| 6254 Gritman Dr | 0.63mi | 3/2.0 | 1,182 (+1%) | 11mo | $304,400 | $258 | 58 |
| 6225 Gritman Dr | 0.66mi | 3/2.0 | 1,182 (+1%) | 12mo | $297,900 | $252 | 55 |
| 8034 Rackham Rd | 0.57mi | 3/2.0 | 1,257 (+8%) | 8mo | $356,900 | $284 | 52 |
| 8030 Rackham Rd | 0.58mi | 3/2.0 | 1,281 (+10%) | 5mo | $349,900 | $273 | 51 |
| 8033 Rackham Rd | 0.59mi | 3/2.0 | 1,281 (+10%) | 5mo | $349,900 | $273 | 50 |
| 6234 Gritman Dr | 0.56mi | 3/2.0 | 1,257 (+8%) | 11mo | $347,900 | $277 | 50 |
| 8025 Rackham Rd | 0.60mi | 3/2.0 | 1,257 (+8%) | 9mo | $349,900 | $278 | 50 |
| 8022 Rackham Rd | 0.59mi | 3/2.0 | 1,281 (+10%) | 7mo | $349,900 | $273 | 49 |
| 8010 Rackham Rd | 0.61mi | 3/2.0 | 1,257 (+8%) | 11mo | $343,900 | $274 | 48 |
| 6218 Gritman Dr | 0.64mi | 3/2.0 | 1,257 (+8%) | 10mo | $352,400 | $280 | 47 |
Match score weights: distance 35% · size 25% · config 20% · recency 20%. Top-matched comps best support the ARV.
Projected returns pro-forma
-3.0% appreciation · 3.0% rent growth · sell at horizon
- IRR
- -9.3%
- Equity multiple
- 0.66×
- Total profit
- $-19,488
- Equity at exit
- $30,566
- IRR
- 0.2%
- Equity multiple
- 1.01×
- Total profit
- $797
- Equity at exit
- $17,725
Cash invested: $57,400 (down + closing). Projections, not guarantees.
Landlord ↔ Tenant lean methodology
- Overall (STATE)
- 90 Strongly Landlord-Friendly
- State South Carolina
- 90 Strongly Landlord-Friendly · R+6
- County
- — inherits STATE
- City
- — inherits STATE
ZIP-level market 29449
- Home prices YoY
- -20.6%
- Active inventory
- 157
- Price-to-rent
- 8.3×
Monthly cashflow live
- Estimated rent
- $2,066 medium interval (Pro) →
- Mortgage (P&I)
- −$1,075
- Tax est. 1.5%
- −$256 /mo · $3,075/yr
- Insurance
- −$85
- HOA
- −$0
- Vacancy / Maint / Mgmt
- −$434
- Net cashflow
- $215
Break-even live
UW: 25.0% down · 7.5% · 30yr · 1.5% tax · 5.0% vac · 8.0% maint · 8.0% mgmt
Financing live
Cash to close
- Down payment
- $51,250
- Closing costs
- $6,150
- Reserves months
- —
- Total cash needed
- —
Loan-product check · same deal, 3 products live
Conventional
25% down · 7.5% · 30yr
- Down + closing
- —
- Monthly P&I
- —
- Monthly cashflow
- —
- DSCR
- —
- Eligible?
- —
Personal DTI + credit; lowest rate.
DSCR
20% down · 8.5% · 30yr
- Down + closing
- —
- Monthly P&I
- —
- Monthly cashflow
- —
- DSCR
- —
- Eligible?
- —
No personal income docs; deal must DSCR.
Hard money
10% down · 12.0% · 12mo
- Down + closing
- —
- Monthly P&I
- —
- Monthly cashflow
- —
- DSCR
- —
- Eligible?
- —
Short-term bridge; refi at stabilization.
Listing history 6 events
-
2024-09-10status Pending
-
2024-09-10status Active
-
2024-08-24historical Active Under Contract
-
2024-08-01$205,000 Active
-
1991-01-11soldstatus $40,000
-
1983-01-21soldstatus $39,844
ⓘ Source: listings_history table (triggers on properties + properties_extension) + one-shot
backfill from property_details.listing_events for pre-trigger history.
Climate risk First Street
- Flood 1/10 Low FEMA zone X (unshaded) · 0% chance over 30 yrs
- Wildfire 5/10 Major
- Heat 9/10 Extreme 7 d/yr ≥106°F today · 18 d/yr by 30 yrs out
- Wind 8/10 Severe 98% chance of damaging wind over 30 yrs
- Air quality 3/10 Moderate 3 unhealthy d/yr today · 3 by 30 yrs out
Nearby sold comps map
Loading sold comps map…
Walkable amenities ~0.75 mi
Loading nearby amenities…
Taxation est. · year 1
- Rental income
- $24,787
- − Mortgage interest
- −$11,483
- − Property taxes
- −$3,075
- − Insurance
- −$1,025
- − Repairs & maintenance
- −$1,983
- − Management
- −$1,983
- − Depreciation
- −$5,964
- Taxable loss
- −$726
- Est. tax savings @ 24.0%
- +$174
- After-tax cash flow
- $2,755/yr
For passive investors: Depreciation is non-cash, so a rental often shows a tax loss while cash-flowing — sheltering income. Rental losses are passive: they offset passive income freely, and up to $25,000/yr can offset ordinary (W-2) income if you actively participate and your MAGI is under $100k (phasing out to $0 by $150k); unused losses carry forward. On sale, claimed depreciation is recaptured at up to 25%, and gains may owe capital-gains tax (a 1031 exchange can defer both). Figures are a year-1 estimate at your 24.0% rate — not tax advice; consult a CPA.
Schools (NCES district)
- District
- Charleston 01
- NCES district ID
- 4501440
- Math proficiency
- 48% ▼ -2.00%
- Reading proficiency
- 53% ▬ 0.00%
- Median HH income
- $52,376
- Composite
- 43.41/100
- National rank
- #3018
- State rank
- #7 of 80 in SC
Livability — Hollywood
- Score
- 60/100
- State rank
- #220
- US rank
- #18513
Category grades
Schools grade is shown separately in the Schools card above.
Census & demographics
- Census place
- Hollywood, SC
- Population (ZIP)
- 7,761
Population outlook (Charleston County) Hauer SSP2
- Today (2025)
- 480,562 people
- By 2030
- 525,921 · +9.4%
- By 2040
- 612,189 · +27.4%
- By 2050
- 691,627 · +43.9%
- By 2075
- 847,979 · +76.5%
- By 2100
- 926,482 · +92.8%
Race, ethnicity, and origin ACS 2023
- Neighborhood character
- Majority White (53%)
- Race & ethnicity
- White 53% Black 42% Hispanic / Latino 4% Two or more races 1%
- Common ancestry
- Italian 2% Slovak 1% Romanian 1%
- Foreign-born
- 3% · Canada, China
- Languages at home
- 97% English-only · Spanish 1%
Political lean MEDSL · Charleston
- 2024 margin
- Lean D (+5.7) · D 51.9% · R 46.3% · Other 1.8%
- 2008→2024 swing
- -2.7pp toward R · 2008: 8.3pp · 2024: 5.7pp
- All cycles
- 2024: D+5.7 2020: D+12.9 2016: D+7.9 2012: D+2.4 2008: D+8.3
Not yet ingested
- Civics
- —
Market trends
- HPI YoY
- ▼ -83.94%
- Current HPI
- 324.5737
- Rent YoY
- —
- Metro
- —
- State GDP YoY
- ▲ 4.51%
- F500 in state
- 2
Industry mix (Fortune 500 HQ in SC)
| Industry | F500 HQs | Revenue |
|---|---|---|
| Packaging | 1 | $7B |
|
||
Price history
+414.5% since first listed6 events — show timeline
- 2024-09-10 Pending — Charleston Trident MLS
- 2024-09-10 Relisted — Charleston Trident MLS
- 2024-08-24 Contingent — Charleston Trident MLS
- 2024-08-01 Listed $205,000 Charleston Trident MLS
- 1991-01-11 Sold (Public Records) $40,000 Public Records
- 1983-01-21 Sold (Public Records) $39,844 Public Records
Property tax history
-1.5%/yrLatest (2022): $99 · +0.0% YoY. Source: county tax records.
Cash-flow waterfall
monthlySold comps — $/sqft
last 12 mo · ≤1 miLoading sold comps…