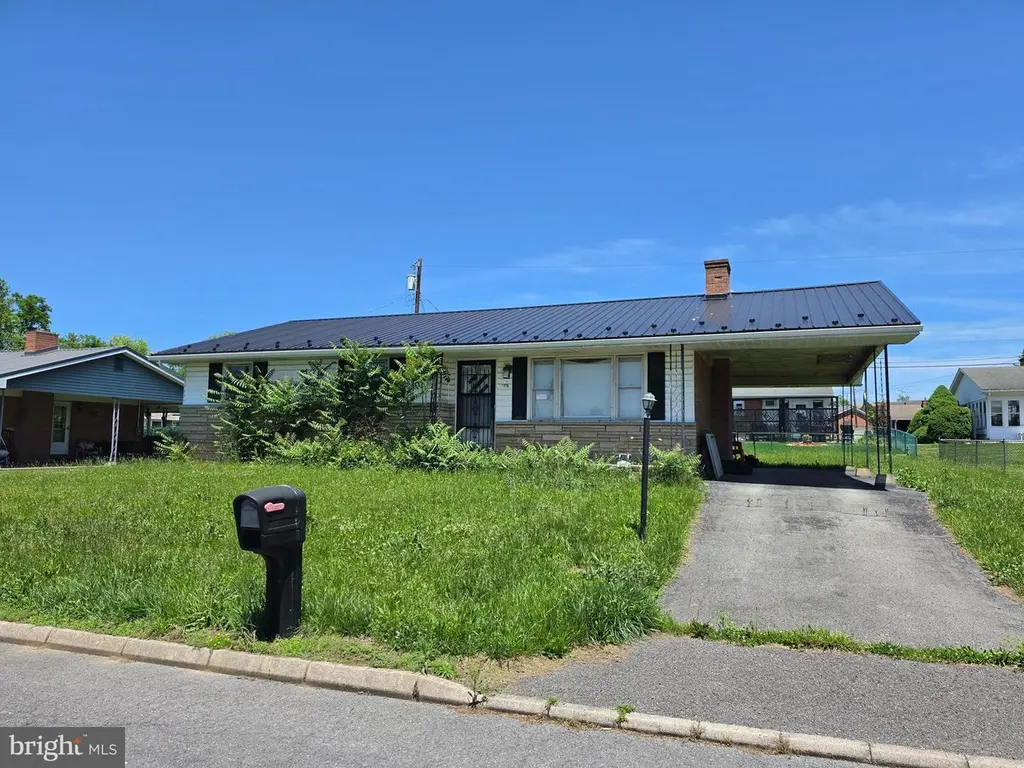
1426 Laurel Ct · Cumberland, MD
Flood risk 1/10 · Minimal
- FEMA flood zone
- X (unshaded)
- Chance of flooding over 30 yrs
- 0.0%
- Est. flood insurance / yr
- $473 – $860
Fire risk 4/10 · Minor
- Est. fire insurance / yr
- $755 – $1,403
Heat risk 5/10 · Moderate
- Hot days now (above 101°F)
- 7 days/yr
- Hot days in 30 yrs
- 18 days/yr
Wind risk 2/10 · Minimal
- Chance of severe wind over 30 yrs
- —
Air-quality risk 2/10 · Minimal
- Unhealthy air days now
- 0 days/yr
- Unhealthy air days in 30 yrs
- 1 days/yr
Risk factors via First Street. Map © Google.
Why this score? — see what drove the B grade
The composite is a weighted blend of 9 inputs, each scored 0–100. Each bar is that input's sub-score; the figure is the points it added to the 100-point composite (weight × sub-score).
- Cash flow +30.0/30.0
- 1% rule +10.0/10.0
- DSCR +10.0/10.0
- ARV discount +7.5/15.0
- Rent growth +5.0/5.0
- Livability +3.9/5.0
- Condition / age +2.5/5.0
- Schools +1.9/10.0
- Appreciation +0.0/10.0
$80,000
🖨 Deal sheet 📄 Offer letter ✓ Due diligence
Listing remarks
All brick home in Mounstain Side Maryland with great potenial. This one level 3 bedroom, 2 bath home is ready for rehab to return to it's original charm and located on a level lot close to shopping, services and medical center. Sold strickly as is with no warranties.
Key facts
- Level lot
- Brick home
- Close to shopping
Tags
Property features AI
Exterior
- Parking: Driveway parking
- Utilities: Public water; Public sewer; Electric service
- Home design: Detached structure; Metal roof; Fee simple ownership
- Construction: Brick construction; Block foundation; Above-grade and below-grade structures; Year built (assessor source)
- Exterior features: Property located in city limits (Cumberland)
Interior
- Bedrooms: 3 bedrooms on the main level
- Flooring: Hardwood flooring; Vinyl flooring
- Bathrooms: 2 full bathrooms total (1 on main level, 1 on lower level)
- Heating & cooling: Forced air heating; Natural gas heating
- Interior features: Full basement; Major rehab needed
- Laundry & utility: Laundry on the main floor; Electric hot water
Neighborhood map
What this means for you Summary
Snapshot
- This is a 3-bed/2.0-bath single-family listed at $80k.
Deal economics
- At list price, monthly cash flow is $391 ($5k/yr) — positive.
- The deal already cash-flows at list — no discount required.
- Meets the 1% rule at list price ($1k rent vs $80k).
- Cap rate 12.2% vs local median 6.7% in Cumberland — top-decile yield for the area; either an underpriced asset or a hidden risk that comps aren't pricing in. Stress-test before assuming the spread holds.
Location & tenants
- Location reads 78/100 on livability (#64 in MD, #2,385 nationally) — a middle-class / working-renter tenant base. Strengths: amenities A+, commute A+, cost of living A+; Watch: schools D+, crime F, employment F.
- Allegany County Public Schools (other): math 15% / reading 30% proficiency, ranked #18 of 24 in MD (top 75%) — low school quality limits family demand, transient renter base, plan for 1-2y turnover.
- Market conditions: Rents rising fast (+10.9%/yr); 235 active listings in the ZIP; 2 comparable units currently listed for rent nearby; 24 units permitted in Allegany County in 2024 (0 in 5+ unit buildings).
Forward outlook
- Local home prices are declining (-3.0%/yr); year-one equity from $553 of loan paydown is wiped out by about $2k of value loss. Plan a longer hold.
- Allegany County population projected at -14% by 2050 — secular population decline; favor cash flow + early exit over multi-decade hold.
- At projected returns (-3.0% appreciation + 8.0% rent growth), your $22k cash investment doubles in ~5 years — after that, you're playing with house money.
Negotiation context
- Only 1 days on market — expect competitive offers; lowballing is unlikely to land.
- 11 sale attempts since 29y ago with the ask held roughly flat each time — persistent listings suggest the price (not the market) is what's stuck; bring a comps-based counter.
Risks & watch-outs
- Climate carrying-cost: extreme-heat days projected 7→18/yr by 2055 (HVAC capex compounding) — expect insurance premiums to compound above CPI over the hold.
Questions for the listing agent
- Built in 1961 — when were the roof, HVAC, electrical panel, plumbing, and water heater last replaced?
- Is there a deadline driving the sale (1031 exchange, divorce, estate, relocation)? That informs how much negotiation room exists.
- Schools are D-rated, which usually means shorter tenancies and higher turnover. Who's the typical renter profile here, and what's been the actual vacancy rate?
- Crime grade is F in this area — have there been break-ins, vandalism, or insurance claims at this property in the last 3 years? What carrier currently insures it and at what premium?
- What's the average days-on-market for RENTAL listings here right now (not sales)? A rising rental-DOM trend means longer vacancies and softer asking-rent achievability than the comps imply.
- What's the recent tenant-quality profile in this submarket — average credit score on applications, eviction rate, late-payment / NSF rate, and stable-employment percentage? A property-management company in the area should have these aggregated.
- How much new for-sale + rental construction is in the pipeline within 1–3 miles? Heavy new supply typically softens prices + rents 12–24 months out; constrained supply supports both.
Investment metrics
- 1% rule
- 1.53% ✓
- Cap rate
- 12.16%
- Cash-on-cash
- 20.95%
- DSCR
- 1.93
- GRM
- 5.5
CMA / ARV
- ARV (on-the-fly)
- $188,232
- Comps found
- 9
Show comp detail 9 sales within ~0.75 mi
| Address | Dist | Beds/Ba | Sqft | Sold | Price | $/sf | Match |
|---|---|---|---|---|---|---|---|
| 1426 Laurel Ct | 0.00mi | 3/2.0 | 2,024 (0%) | 0mo | $80,000 | $40 | 100 |
| 1427 Church St | 0.15mi | 4/2.0 (+1) | 2,097 (+4%) | 2mo | $225,000 | $107 | 80 |
| 135 New Hampshire Ave | 0.31mi | 3/2.0 | 2,056 (+2%) | 21mo | $185,000 | $90 | 66 |
| 51 Maple St | 0.36mi | 4/2.5 (+1) | 2,060 (+2%) | 11mo | $190,000 | $92 | 64 |
| 33 Beechwood Dr | 0.13mi | 3/1.5 | 1,861 (-8%) | 20mo | $173,000 | $93 | 62 |
| 40 Memorial Ave | 0.55mi | 3/2.0 | 1,786 (-12%) | 14mo | $219,000 | $123 | 43 |
| 607 White Ave | 0.69mi | 4/2.0 (+1) | 2,054 (+2%) | 23mo | $282,000 | $137 | 41 |
| 814 Hicks Ave | 0.71mi | 4/2.0 (+1) | 1,891 (-7%) | 12mo | $259,900 | $137 | 41 |
| 436 Homer St | 0.67mi | 4/2.0 (+1) | 1,722 (-15%) | 19mo | $95,000 | $55 | 23 |
Match score weights: distance 35% · size 25% · config 20% · recency 20%. Top-matched comps best support the ARV.
Projected returns pro-forma
-3.0% appreciation · 8.0% rent growth · sell at horizon
- IRR
- 19.1%
- Equity multiple
- 1.82×
- Total profit
- $18,444
- Equity at exit
- $11,928
- IRR
- 30.7%
- Equity multiple
- 4.47×
- Total profit
- $77,684
- Equity at exit
- $6,917
Cash invested: $22,400 (down + closing). Projections, not guarantees.
Landlord ↔ Tenant lean methodology
- Overall (STATE)
- 27 Tenant-Leaning
- State Maryland
- 27 Tenant-Leaning · D+14
- County
- — inherits STATE
- City
- — inherits STATE
ZIP-level market 21502
- Home prices YoY
- -17.4%
- Rents YoY
- 10.9%
- Active inventory
- 235
- Price-to-rent
- 5.5×
Monthly cashflow live
- Estimated rent
- $1,223 medium interval (Pro) →
- Mortgage (P&I)
- −$420
- Tax from tax record
- −$122 /mo · $1,464/yr
- Insurance
- −$33
- HOA
- −$0
- Vacancy / Maint / Mgmt
- −$257
- Net cashflow
- $391
Break-even live
UW: 25.0% down · 7.5% · 30yr · 1.5% tax · 5.0% vac · 8.0% maint · 8.0% mgmt
Financing live
Cash to close
- Down payment
- $20,000
- Closing costs
- $2,400
- Reserves months
- —
- Total cash needed
- —
Loan-product check · same deal, 3 products live
Conventional
25% down · 7.5% · 30yr
- Down + closing
- —
- Monthly P&I
- —
- Monthly cashflow
- —
- DSCR
- —
- Eligible?
- —
Personal DTI + credit; lowest rate.
DSCR
20% down · 8.5% · 30yr
- Down + closing
- —
- Monthly P&I
- —
- Monthly cashflow
- —
- DSCR
- —
- Eligible?
- —
No personal income docs; deal must DSCR.
Hard money
10% down · 12.0% · 12mo
- Down + closing
- —
- Monthly P&I
- —
- Monthly cashflow
- —
- DSCR
- —
- Eligible?
- —
Short-term bridge; refi at stabilization.
Rent comps 2 comps
| Address | Beds | Baths | Sqft | Rent | $/sqft | DOM | Units | Dist |
|---|---|---|---|---|---|---|---|---|
| 131 Grand Ave Cumberland, MD | 3.0 | 2.0 | 1444 | $1,300 | $0.90 | 43d | 1 | 0.89mi |
| 109 Grand Ave Unit B Cumberland, MD | 2.0 | 1.0 | 3000 | $800 | $0.27 | 43d | 1 | 0.89mi |
Listing history 27 events
-
2026-05-30status $80,000 Pending 1 DOM
-
2026-05-29$80,000 Active
-
2014-07-31historical
-
2014-01-29status Active
-
2014-01-29historical
-
2014-01-28historical
-
2013-07-25Active
-
2013-07-24$129,900
-
2012-10-22historical
-
2012-10-21historical
-
2012-07-01price
-
2011-07-18Active
-
2011-07-18$129,000
-
2011-07-11historical Expired
-
2011-07-11historical
-
2011-06-08price
-
2011-01-28status Active
-
2011-01-20historical Temporarily Off-Market
-
2011-01-11status Active
-
2011-01-11historical Expired
-
2011-01-10Active
-
2011-01-10$149,900
-
1998-01-22soldstatus $88,000
-
1998-01-20soldstatus $88,000
-
1997-11-22historical
-
1997-11-13$88,500
-
1995-10-26soldstatus $81,000
ⓘ Source: listings_history table (triggers on properties + properties_extension) + one-shot
backfill from property_details.listing_events for pre-trigger history.
Tax reassessment forecast MD · Partial reset (capped growth)
- Current annual tax
- $1,464 · $122/mo
- Projected year-2 tax
- $1,464 · $122/mo
- Expected delta
- $0/yr ($0/mo · 0.0%)
ⓘ Screening estimate from a state-policy table — verify with the county assessor before closing.
Climate risk First Street
- Flood 1/10 Low FEMA zone X (unshaded) · 0% chance over 30 yrs
- Wildfire 4/10 Moderate
- Heat 5/10 Major 7 d/yr ≥101°F today · 18 d/yr by 30 yrs out
- Wind 2/10 Low
- Air quality 2/10 Low 0 unhealthy d/yr today · 1 by 30 yrs out
Nearby sold comps map
Loading sold comps map…
Walkable amenities ~0.75 mi
Loading nearby amenities…
Taxation est. · year 1
- Rental income
- $14,674
- − Mortgage interest
- −$4,481
- − Property taxes
- −$1,464
- − Insurance
- −$400
- − Repairs & maintenance
- −$1,174
- − Management
- −$1,174
- − Depreciation
- −$2,327
- Taxable income
- $3,653
- Est. tax owed @ 24.0%
- −$877
- After-tax cash flow
- $3,817/yr
For passive investors: Depreciation is non-cash, so a rental often shows a tax loss while cash-flowing — sheltering income. Rental losses are passive: they offset passive income freely, and up to $25,000/yr can offset ordinary (W-2) income if you actively participate and your MAGI is under $100k (phasing out to $0 by $150k); unused losses carry forward. On sale, claimed depreciation is recaptured at up to 25%, and gains may owe capital-gains tax (a 1031 exchange can defer both). Figures are a year-1 estimate at your 24.0% rate — not tax advice; consult a CPA.
Schools (NCES district)
- District
- Allegany County Public Schools
- NCES district ID
- 2400030
- Math proficiency
- 15% ▼ -26.00%
- Reading proficiency
- 30% ▼ -20.00%
- Median HH income
- $39,760
- Composite
- 18.95/100
- National rank
- #8854
- State rank
- #18 of 24 in MD
Livability — Cumberland
- Score
- 78/100
- State rank
- #64
- US rank
- #2385
Category grades
Schools grade is shown separately in the Schools card above.
Census & demographics
- Census place
- Cumberland, MD
- County
- Allegany County · 41,015 people
- City population
- 41,015
- Metro
- Cumberland, MD-WV
- Population (ZIP)
- 41,015
- Household income
- $60,725
- Rent vs Own
- Severe rent burden
- 824.0
Population outlook (Allegany County) Hauer SSP2
- Today (2025)
- 68,778 people
- By 2030
- 66,766 · -2.9%
- By 2040
- 62,784 · -8.7%
- By 2050
- 59,179 · -14.0%
- By 2075
- 50,732 · -26.2%
- By 2100
- 40,837 · -40.6%
Race, ethnicity, and origin ACS 2023
- Neighborhood character
- Predominantly White (83%)
- Race & ethnicity
- White 83% Black 9% Two or more races 5% Hispanic / Latino 2%
- Common ancestry
- Slovak 3% Romanian 2% Italian 1%
- Foreign-born
- 2% · Canada
- Languages at home
- 96% English-only · Spanish 2%
Political lean MEDSL · Allegany
- 2024 margin
- Solid R (+40.3) · D 28.9% · R 69.2% · Other 2.0%
- 2008→2024 swing
- -14.4pp toward R · 2008: -25.9pp · 2024: -40.3pp
- All cycles
- 2024: R+40.3 2020: R+38.3 2016: R+48.0 2012: R+32.9 2008: R+25.9
Not yet ingested
- Civics
- —
Market trends
- HPI YoY
- ▼ -54.33%
- Current HPI
- 258.6676
- Rent YoY
- ▲ 10.88%
- Metro
- Cumberland, MD-WV
- State GDP YoY
- ▲ 2.97%
- F500 in state
- 12
Industry mix (Fortune 500 HQ in MD)
| Industry | F500 HQs | Revenue |
|---|---|---|
| Aerospace / Defense | 1 | $71B |
|
||
| Utilities | 1 | $25B |
|
||
| Hotels | 1 | $24B |
|
||
| Consumer Goods | 1 | $7B |
|
||
| Real Estate | 1 | $6B |
|
||
| Chemicals | 1 | $2B |
|
||
Price history
-1.2% since first listed26 events — show timeline
- 2026-05-29 Listed $80,000 BRIGHT MLS
- 2014-07-31 Delisted — MRIS
- 2014-01-29 Relisted — MRIS
- 2014-01-29 Listing Removed — BRIGHT MLS
- 2014-01-28 Delisted — MRIS
- 2013-07-25 Listed — MRIS
- 2013-07-24 Listed $129,900 BRIGHT MLS
- 2012-10-22 Delisted — MRIS
- 2012-10-21 Listing Removed — BRIGHT MLS
- 2012-07-01 Price Changed — MRIS
- 2011-07-18 Listed — MRIS
- 2011-07-18 Listed $129,000 BRIGHT MLS
- 2011-07-11 Delisted — MRIS
- 2011-07-11 Listing Removed — BRIGHT MLS
- 2011-06-08 Price Changed — MRIS
- 2011-01-28 Relisted — MRIS
- 2011-01-20 Delisted — MRIS
- 2011-01-11 Relisted — MRIS
- 2011-01-11 Delisted — MRIS
- 2011-01-10 Listed — MRIS
- 2011-01-10 Listed $149,900 BRIGHT MLS
- 1998-01-22 Sold (Public Records) $88,000 Public Records
- 1998-01-20 Sold (MLS) $88,000 MRIS
- 1997-11-22 Delisted — MRIS
- 1997-11-13 Listed $88,500 MRIS
- 1995-10-26 Sold (Public Records) $81,000 Public Records
Property tax history
+1.0%/yrLatest (2025): $1,464 · +4.7% YoY. Source: county tax records.
Cash-flow waterfall
monthlySold comps — $/sqft
last 12 mo · ≤1 miLoading sold comps…