 🏷️ Likely Rental
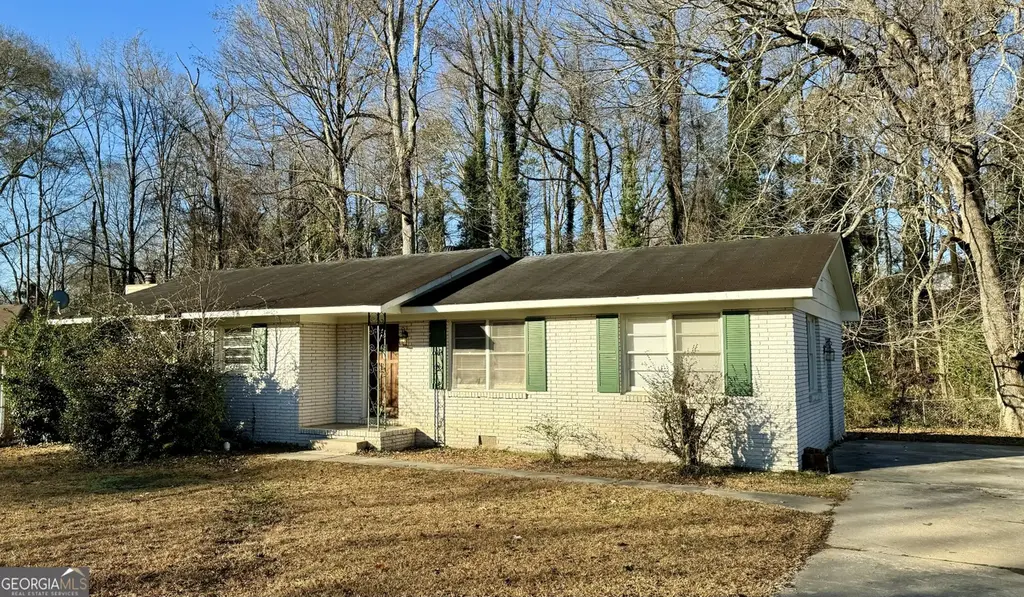
10747 Thrasher Rd · Bonanza, GA
Flood risk 4/10 · Minor
- FEMA flood zone
- X (unshaded)
- Chance of flooding over 30 yrs
- 0.22%
- Est. flood insurance / yr
- $507 – $1,088
Fire risk 2/10 · Minimal
- Est. fire insurance / yr
- $963 – $1,789
Heat risk 6/10 · Moderate
- Hot days now (above 105°F)
- 7 days/yr
- Hot days in 30 yrs
- 18 days/yr
Wind risk 6/10 · Moderate
- Chance of severe wind over 30 yrs
- 27.0%
Air-quality risk 4/10 · Minor
- Unhealthy air days now
- 5 days/yr
- Unhealthy air days in 30 yrs
- 6 days/yr
Risk factors via First Street. Map © Google.
Why this score? — see what drove the C- grade
The composite is a weighted blend of 9 inputs, each scored 0–100. Each bar is that input's sub-score; the figure is the points it added to the 100-point composite (weight × sub-score).
- Cash flow +19.0/30.0
- ARV discount +15.0/15.0
- DSCR +6.0/10.0
- 1% rule +4.6/10.0
- Livability +3.1/5.0
- Rent growth +3.0/5.0
- Condition / age +2.5/5.0
- Schools +1.3/10.0
- Appreciation +0.0/10.0
$195,000
🖨 Deal sheet 📄 Offer letter ✓ Due diligence
Listing remarks MLS
Get great cash flow with this all brick tenant occupied home! DO NOT DISTURB THE TENANT! The living room opens up into the dining room with a large bonus room just off the kitchen that could be a 4th bedroom. Master bedroom has a private full bath with the secondary bedrooms sharing a full bath in the hall.
Key facts
- 0.61 acre lot
- 2 parking spots
- Built 1965
Neighborhood map
What this means for you Summary
Snapshot
- This is a 3-bed/2.0-bath single-family listed at $195k.
Deal economics
- At list price, monthly cash flow is $205 ($2k/yr) — positive.
- The deal already cash-flows at list — no discount required.
- To meet the 1% rule (rent ≥ 1% of price), the offer needs to be $187k (3.9% below list).
- Recommended offer: $172k (12.0% below list) — sets the bar for market timing.
- Cap rate 7.6% vs local median 5.2% in Bonanza — top-decile yield for the area; either an underpriced asset or a hidden risk that comps aren't pricing in. Stress-test before assuming the spread holds.
Location & tenants
- Location reads 62/100 on livability (#314 in GA) — a middle-class / working-renter tenant base. Strengths: cost of living A+, housing A+, crime A; Watch: employment C-, schools F, amenities F.
- Clayton County (suburban): math 11% / reading 20% proficiency, ranked #155 of 174 in GA (top 89%) — low school quality limits family demand, transient renter base, plan for 1-2y turnover; 78% free/reduced lunch — lower-income household profile, screen leases tightly.
- Market conditions: Rents rising (+2.1%/yr); 251 active listings in the ZIP; 40 comparable units currently listed for rent nearby; rentals lingering (median 44d on market — plan ~5-8 weeks vacancy on turnover, expect pricing pressure); 55% of comp listings sitting > 30 days — soft ceiling on asking rent; 865 units permitted in Clayton County in 2024 (448 in 5+ unit buildings).
- This rent runs 36% of the median local income ($62k/yr) — at the standard rent-burdened threshold; future hikes will face affordability resistance.
Forward outlook
- Local home prices are declining (-3.0%/yr); year-one equity from $1k of loan paydown is wiped out by about $6k of value loss. Plan a longer hold.
- Clayton County population projected at +29% by 2050 — long-run rental-demand tailwind backs the buy-and-hold thesis.
Negotiation context
- It's been on market 135 days — a 12% lower offer ($172k) is reasonable based on typical stale-listing flexibility.
- 3 sale attempts with the ask held roughly flat each time — persistent listings suggest the price (not the market) is what's stuck; bring a comps-based counter.
- Current owner paid $120k; list at $195k implies a 62% gain — meaningful room to come down on a strong offer.
Risks & watch-outs
- Climate carrying-cost: major wind risk, 27% chance of damaging wind over 30y; extreme-heat days projected 7→18/yr by 2055 (HVAC capex compounding) — expect insurance premiums to compound above CPI over the hold.
Questions for the listing agent
- It's been on market 135 days. Have you received any prior offers? Is the seller open to a 12% concession, seller financing, or rate buy-down credit?
- Built in 1965 — when were the roof, HVAC, electrical panel, plumbing, and water heater last replaced?
- Why hasn't it sold? Are there any deal-killer items the seller is aware of (foundation, flood, title, zoning, code violations)?
- Is there a deadline driving the sale (1031 exchange, divorce, estate, relocation)? That informs how much negotiation room exists.
- Schools are F-rated, which usually means shorter tenancies and higher turnover. Who's the typical renter profile here, and what's been the actual vacancy rate?
- What's the average days-on-market for RENTAL listings here right now (not sales)? A rising rental-DOM trend means longer vacancies and softer asking-rent achievability than the comps imply.
- What's the recent tenant-quality profile in this submarket — average credit score on applications, eviction rate, late-payment / NSF rate, and stable-employment percentage? A property-management company in the area should have these aggregated.
- How much new for-sale + rental construction is in the pipeline within 1–3 miles? Heavy new supply typically softens prices + rents 12–24 months out; constrained supply supports both.
Investment metrics
- 1% rule
- 0.96% ✗
- Cap rate
- 7.55%
- Cash-on-cash
- 4.50%
- DSCR
- 1.20
- GRM
- 8.7
CMA / ARV
- ARV (median comp)
- $253,943
- List price
- $195,000
- Delta
- -23.21%
- Verdict
- UNDERPRICED
- Comps
- 20 within 1.0 mi
Show comp detail 12 sales within ~0.75 mi
| Address | Dist | Beds/Ba | Sqft | Sold | Price | $/sf | Match |
|---|---|---|---|---|---|---|---|
| 1580 Pintail Rd | 0.23mi | 3/2.0 | 1,340 (-4%) | 2mo | $120,000 | $90 | 82 |
| 10959 Thrasher Rd | 0.33mi | 3/2.0 | 1,395 (+0%) | 3mo | $205,000 | $147 | 82 |
| 1741 Portwest Way | 0.27mi | 3/2.0 | 1,374 (-1%) | 6mo | $250,000 | $182 | 80 |
| 1578 Pintail Rd | 0.23mi | 3/2.0 | 1,302 (-6%) | 3mo | $146,500 | $113 | 76 |
| 1652 Thorn Ridge Trl | 0.38mi | 3/2.0 | 1,360 (-2%) | 7mo | $201,000 | $148 | 73 |
| 1596 Bonanza Church Rd | 0.57mi | 3/2.0 | 1,380 (-1%) | 1mo | $155,000 | $112 | 71 |
| 11045 Knotty Pine Pl | 0.56mi | 3/2.0 | 1,410 (+1%) | 6mo | $183,000 | $130 | 67 |
| 10448 Tara Pointe Dr | 0.59mi | 3/2.0 | 1,341 (-4%) | 4mo | $225,000 | $168 | 63 |
| 1329 Birdsong Ln | 0.73mi | 3/2.0 | 1,407 (+1%) | 2mo | $275,000 | $195 | 63 |
| 1623 Elizabeth Ln | 0.75mi | 3/2.0 | 1,392 (0%) | 3mo | $213,000 | $153 | 62 |
| 11120 Tara Glynn Dr | 0.69mi | 3/2.0 | 1,459 (+5%) | 3mo | $249,000 | $171 | 57 |
| 10859 Panhandle Rd | 0.50mi | 2/1.0 (-1) | 1,232 (-12%) | 6mo | $190,000 | $154 | 43 |
Match score weights: distance 35% · size 25% · config 20% · recency 20%. Top-matched comps best support the ARV.
Projected returns pro-forma
-3.0% appreciation · 2.06% rent growth · sell at horizon
- IRR
- -10.3%
- Equity multiple
- 0.63×
- Total profit
- $-20,322
- Equity at exit
- $29,075
- IRR
- -2.3%
- Equity multiple
- 0.85×
- Total profit
- $-8,028
- Equity at exit
- $16,860
Cash invested: $54,600 (down + closing). Projections, not guarantees.
Landlord ↔ Tenant lean methodology
- Overall (STATE)
- 90 Strongly Landlord-Friendly
- State Georgia
- 90 Strongly Landlord-Friendly · R+3
- County
- — inherits STATE
- City
- — inherits STATE
ZIP-level market 30238
- Home prices YoY
- -33.3%
- Rents YoY
- 2.1%
- Active inventory
- 251
- Price-to-rent
- 8.7×
Monthly cashflow live
- Estimated rent
- $1,873 high interval (Pro) →
- Mortgage (P&I)
- −$1,023
- Tax from tax record
- −$171 /mo · $2,053/yr
- Insurance
- −$81
- HOA
- −$0
- Vacancy / Maint / Mgmt
- −$393
- Net cashflow
- $205
Break-even live
UW: 25.0% down · 7.5% · 30yr · 1.5% tax · 5.0% vac · 8.0% maint · 8.0% mgmt
Financing live
Cash to close
- Down payment
- $48,750
- Closing costs
- $5,850
- Reserves months
- —
- Total cash needed
- —
Loan-product check · same deal, 3 products live
Conventional
25% down · 7.5% · 30yr
- Down + closing
- —
- Monthly P&I
- —
- Monthly cashflow
- —
- DSCR
- —
- Eligible?
- —
Personal DTI + credit; lowest rate.
DSCR
20% down · 8.5% · 30yr
- Down + closing
- —
- Monthly P&I
- —
- Monthly cashflow
- —
- DSCR
- —
- Eligible?
- —
No personal income docs; deal must DSCR.
Hard money
10% down · 12.0% · 12mo
- Down + closing
- —
- Monthly P&I
- —
- Monthly cashflow
- —
- DSCR
- —
- Eligible?
- —
Short-term bridge; refi at stabilization.
Rent comps 40 comps
| Address | Beds | Baths | Sqft | Rent | $/sqft | DOM | Units | Dist |
|---|---|---|---|---|---|---|---|---|
| 10903 Thrasher Rd Hampton, GA | 3.0 | 2.0 | 1412 | $1,725 | $1.22 | 22d | 1 | 0.21mi |
| 10624 Woodcock St Jonesboro, GA | 4.0 | 2.0 | 1171 | $1,670 | $1.43 | 22d | 1 | 0.26mi |
| 1546 Plover Rd Jonesboro, GA | 4.0 | 3.0 | 1040 | $1,730 | $1.66 | 44d | 1 | 0.35mi |
| 1652 Thorn Ridge Trl Hampton, GA | 3.0 | 2.0 | 1360 | $1,960 | $1.44 | 44d | 1 | 0.38mi |
| 10887 Tara Blvd Hampton, GA | 3.0 | 2.5 | 1756 | $2,032 | $1.16 | 4d | 10 | 0.39mi |
| 1496 Paladin Ct Hampton, GA | 4.0 | 2.5 | 1116 | $2,045 | $1.83 | 20d | 1 | 0.41mi |
| 10784 Knotty Pine Pl Hampton, GA | 3.0 | 2.0 | 1329 | $1,795 | $1.35 | 44d | 1 | 0.44mi |
| 1556 Wren Rd Jonesboro, GA | 3.0 | 2.0 | 1388 | $1,715 | $1.24 | 44d | 1 | 0.46mi |
| 10911 Tara Blvd Lovejoy, GA | 1.0–3.0 | 1.0–2.0 | 1150 | $1,795 | $1.56 | 44d | 1 | 0.55mi |
| 1374 Misty Ridge Ct Hampton, GA | 3.0 | 2.0 | 1250 | $1,775 | $1.42 | 44d | 1 | 0.57mi |
| 11035 Shannon Cir Hampton, GA | 3.0 | 2.0 | 1320 | $1,606 | $1.22 | 13d | 1 | 0.58mi |
| 1442 Starling Ct Hampton, GA | 3.0 | 2.0 | 1668 | $1,885 | $1.13 | 44d | 1 | 0.61mi |
| 10507 Starling Trl Hampton, GA | 4.0 | 2.5 | 1800 | $2,131 | $1.18 | 44d | 1 | 0.66mi |
| 11015 Tara Blvd Lovejoy, GA | 1.0–3.0 | 1.0–2.0 | 1113 | $1,815 | $1.63 | 44d | 1 | 0.68mi |
| 10473 Starling Trl Hampton, GA | 4.0 | 3.0 | 1835 | $2,367 | $1.29 | 24d | 1 | 0.68mi |
| 1478 Carriage Ln Jonesboro, GA | 3.0 | 2.0 | 1436 | $1,675 | $1.17 | 22d | 1 | 0.71mi |
| 1340 Birdsong Ln Hampton, GA | 3.0 | 2.5 | 1640 | $1,961 | $1.20 | 5d | 1 | 0.71mi |
| 10960 Morning Dove Dr Hampton, GA | 3.0 | 2.0 | 1600 | $4,600 | $2.88 | 44d | 1 | 0.76mi |
| 1591 Elizabeth Ln Hampton, GA | 3.0 | 2.0 | 1352 | $1,591 | $1.18 | 44d | 1 | 0.77mi |
| 1578 Onalee Dr Hampton, GA | 3.0 | 2.5 | 1709 | $1,800 | $1.05 | 24d | 1 | 0.78mi |
| 1786 Old Dogwood Jonesboro, GA | 3.0 | 2.5 | 1454 | $1,730 | $1.19 | 44d | 1 | 0.86mi |
| 1798 Old Dogwood Jonesboro, GA | 3.0 | 3.0 | 1454 | $1,730 | $1.19 | 24d | 1 | 0.86mi |
| 1814 Old Dogwood Jonesboro, GA | 3.0 | 2.5 | 1454 | $1,730 | $1.19 | 44d | 1 | 0.86mi |
| 1830 Old Dogwood Jonesboro, GA | 3.0 | 2.5 | 1454 | $1,730 | $1.19 | 44d | 1 | 0.87mi |
| 1834 Old Dogwood Jonesboro, GA | 3.0 | 2.5 | 1454 | $1,730 | $1.19 | 44d | 1 | 0.87mi |
| 10346 Wisteria Ln Jonesboro, GA | 3.0 | 2.0 | 1042 | $1,595 | $1.53 | 13d | 1 | 0.88mi |
| 1779 Old Dogwood Jonesboro, GA | 3.0 | 2.5 | 1454 | $1,730 | $1.19 | 44d | 1 | 0.88mi |
| 1795 Old Dogwood Jonesboro, GA | 3.0 | 3.0 | 1454 | $1,730 | $1.19 | 44d | 1 | 0.89mi |
| 10357 Briarbay Dr Jonesboro, GA | 3.0 | 2.0 | 1180 | $1,610 | $1.36 | 2d | 1 | 0.90mi |
| 1545 Iris Walk Jonesboro, GA | 3.0 | 3.0 | 1453 | $1,800 | $1.24 | 24d | 1 | 0.96mi |
| 10299 Wisteria Ln Jonesboro, GA | 3.0 | 2.0 | 1257 | $1,770 | $1.41 | 44d | 1 | 0.97mi |
| 11236 James Madison Dr Hampton, GA | 3.0 | 2.5 | 1518 | $1,870 | $1.23 | 44d | 1 | 0.97mi |
| 1576 Iris Walk Jonesboro, GA | 3.0 | 2.5 | 1683 | $1,695 | $1.01 | 44d | 1 | 0.97mi |
| 10375 Larrack Trce Jonesboro, GA | 3.0 | 2.0 | 1340 | $1,800 | $1.34 | 17d | 1 | 0.97mi |
| 10564 Village Lndg Jonesboro, GA | 3.0 | 2.5 | 1617 | $1,800 | $1.11 | 24d | 1 | 0.99mi |
| 10485 Ace Ct Jonesboro, GA | 3.0 | 2.0 | 1288 | $1,611 | $1.25 | 44d | 1 | 1.03mi |
| 1277 Iron Gate Blvd Jonesboro, GA | 3.0 | 2.0 | 1120 | $1,499 | $1.34 | 2d | 1 | 1.08mi |
| 1117 Village Crk Jonesboro, GA | 3.0 | 2.5 | 1330 | $1,815 | $1.36 | 44d | 1 | 1.11mi |
| 10972 Clearwater Dr Hampton, GA | 3.0 | 2.5 | 1628 | $1,890 | $1.16 | 24d | 1 | 1.12mi |
| 1260 Iron Gate Blvd Jonesboro, GA | 3.0 | 2.0 | 1460 | $1,745 | $1.20 | 20d | 1 | 1.13mi |
Listing history 21 events
-
2026-06-17days on market $195,000 Active 135 DOM
-
2026-06-16days on market $195,000 Active 134 DOM
-
2026-06-15days on market $195,000 Active 133 DOM
-
2026-06-13days on market $195,000 Active 131 DOM
-
2026-06-09days on market $195,000 Active 127 DOM
-
2026-06-08days on market $195,000 Active 126 DOM
-
2026-06-07days on market $195,000 Active 125 DOM
-
2026-06-04days on market $195,000 Active 122 DOM
-
2026-06-03days on market $195,000 Active 121 DOM
-
2026-06-02days on market $195,000 Active 120 DOM
-
2026-06-01days on market $195,000 Active 119 DOM
-
2026-05-31days on market $195,000 Active 118 DOM
-
2026-01-30$195,000 New 309-char remark
Show marketing remark (309 chars)
Get great cash flow with this all brick tenant occupied home! DO NOT DISTURB THE TENANT! The living room opens up into the dining room with a large bonus room just off the kitchen that could be a 4th bedroom. Master bedroom has a private full bath with the secondary bedrooms sharing a full bath in the hall.
-
2025-02-25historical $1,395
-
2025-02-07$1,395
-
2025-02-07historical $1,395
-
2025-02-05$1,395
-
2017-08-07soldstatus $120,000
-
1985-06-22soldstatus $59,000
-
1982-10-02soldstatus $79,600
-
1981-01-01soldstatus $39,400
ⓘ Source: listings_history table (triggers on properties + properties_extension) + one-shot
backfill from property_details.listing_events for pre-trigger history.
Tax reassessment forecast GA · Resets to sale price
- Current annual tax
- $2,053 · $171/mo
- Projected year-2 tax
- $2,053 · $171/mo
- Expected delta
- $0/yr ($0/mo · 0.0%)
ⓘ Screening estimate from a state-policy table — verify with the county assessor before closing.
Climate risk First Street
- Flood 4/10 Moderate FEMA zone X (unshaded) · 22% chance over 30 yrs
- Wildfire 2/10 Low
- Heat 6/10 Major 7 d/yr ≥105°F today · 18 d/yr by 30 yrs out
- Wind 6/10 Major 27% chance of damaging wind over 30 yrs
- Air quality 4/10 Moderate 5 unhealthy d/yr today · 6 by 30 yrs out
Nearby sold comps map
Loading sold comps map…
Walkable amenities ~0.75 mi
Loading nearby amenities…
Taxation est. · year 1
- Rental income
- $22,478
- − Mortgage interest
- −$10,923
- − Property taxes
- −$2,053
- − Insurance
- −$975
- − Repairs & maintenance
- −$1,798
- − Management
- −$1,798
- − Depreciation
- −$5,673
- Taxable loss
- −$742
- Est. tax savings @ 24.0%
- +$178
- After-tax cash flow
- $2,637/yr
For passive investors: Depreciation is non-cash, so a rental often shows a tax loss while cash-flowing — sheltering income. Rental losses are passive: they offset passive income freely, and up to $25,000/yr can offset ordinary (W-2) income if you actively participate and your MAGI is under $100k (phasing out to $0 by $150k); unused losses carry forward. On sale, claimed depreciation is recaptured at up to 25%, and gains may owe capital-gains tax (a 1031 exchange can defer both). Figures are a year-1 estimate at your 24.0% rate — not tax advice; consult a CPA.
Schools (NCES district)
- District
- Clayton County
- NCES district ID
- 1301230
- Math proficiency
- 11% ▼ -13.00%
- Reading proficiency
- 20% ▼ -9.00%
- Median HH income
- $42,266
- Composite
- 13.41/100
- National rank
- #9527
- State rank
- #155 of 174 in GA
Livability — Bonanza
- Score
- 62/100
- State rank
- #314
- US rank
- #16994
Category grades
Schools grade is shown separately in the Schools card above.
Census & demographics
- Census place
- Bonanza, GA
- County
- Clayton County · 230,153 people
- Metro
- Atlanta-Sandy Springs-Alpharetta, GA
- Population (ZIP)
- 43,191
- Household income
- $62,185
- Rent vs Own
- Severe rent burden
- 1992.0
Population outlook (Clayton County) Hauer SSP2
- Today (2025)
- 310,777 people
- By 2030
- 329,762 · +6.1%
- By 2040
- 368,052 · +18.4%
- By 2050
- 401,196 · +29.1%
- By 2075
- 472,488 · +52.0%
- By 2100
- 500,446 · +61.0%
Race, ethnicity, and origin ACS 2023
- Neighborhood character
- Predominantly Black (71%)
- Race & ethnicity
- Black 71% Hispanic / Latino 17% White 7% Two or more races 7%
- Hispanic origin (detail)
- Mexican 13% Puerto Rican 2%
- Foreign-born
- 11% · Canada, United Kingdom
- Languages at home
- 83% English-only · Spanish 14% French/Haitian/Cajun 1%
Political lean MEDSL · Clayton
- 2024 margin
- Solid D (+69.2) · D 84.3% · R 15.1%
- 2008→2024 swing
- +2.8pp toward D · 2008: 66.4pp · 2024: 69.2pp
- All cycles
- 2024: D+69.2 2020: D+70.9 2016: D+71.9 2012: D+70.1 2008: D+66.4
Not yet ingested
- Civics
- —
Market trends
- HPI YoY
- ▼ -105.48%
- Current HPI
- 211.6309
- Rent YoY
- ▲ 2.06%
- Metro
- Atlanta-Sandy Springs-Alpharetta, GA
- State GDP YoY
- ▲ 2.66%
- F500 in state
- 28
Industry mix (Fortune 500 HQ in GA)
| Industry | F500 HQs | Revenue |
|---|---|---|
| Paper / Packaging | 2 | $29B |
|
||
| Retail | 1 | $160B |
|
||
| Transportation / Logistics | 1 | $91B |
|
||
| Airlines | 1 | $62B |
|
||
| Consumer Goods | 1 | $47B |
|
||
| Utilities | 1 | $25B |
|
||
Price history
+394.9% since first listed9 events — show timeline
- 2026-01-30 Listed $195,000 GAMLS
- 2025-02-25 Rental Removed $1,395 GAMLS
- 2025-02-07 Listed for Rent $1,395 GAMLS
- 2025-02-07 Rental Removed $1,395 APPFOLIO
- 2025-02-05 Listed for Rent $1,395 APPFOLIO
- 2017-08-07 Sold (Public Records) $120,000 Public Records
- 1985-06-22 Sold (Public Records) $59,000 Public Records
- 1982-10-02 Sold (Public Records) $79,600 Public Records
- 1981-01-01 Sold (Public Records) $39,400 Public Records
Property tax history
+3.1%/yrLatest (2025): $2,053 · -1.8% YoY. Source: county tax records.
Cash-flow waterfall
monthlySold comps — $/sqft
last 12 mo · ≤1 miLoading sold comps…