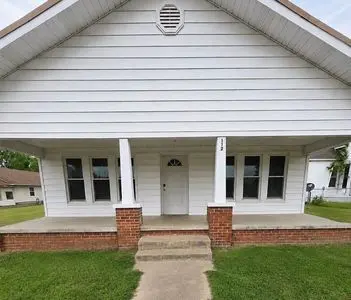
112 E 7th St · Weleetka, OK
Flood risk 1/10 · Minimal
- FEMA flood zone
- X
- Chance of flooding over 30 yrs
- 0.0%
- Est. flood insurance / yr
- $507 – $1,088
Fire risk 8/10 · Major
- Est. fire insurance / yr
- $2,463 – $4,575
Heat risk 6/10 · Moderate
- Hot days now (above 111°F)
- 7 days/yr
- Hot days in 30 yrs
- 20 days/yr
Wind risk 3/10 · Minor
- Chance of severe wind over 30 yrs
- 8.0%
Air-quality risk 2/10 · Minimal
- Unhealthy air days now
- 0 days/yr
- Unhealthy air days in 30 yrs
- 2 days/yr
Risk factors via First Street. Map © Google.
Why this score? — see what drove the B+ grade
The composite is a weighted blend of 9 inputs, each scored 0–100. Each bar is that input's sub-score; the figure is the points it added to the 100-point composite (weight × sub-score).
- Cash flow +30.0/30.0
- DSCR +10.0/10.0
- Appreciation +10.0/10.0
- 1% rule +8.0/10.0
- ARV discount +7.5/15.0
- Livability +3.0/5.0
- Rent growth +2.5/5.0
- Condition / age +2.5/5.0
- Schools +2.4/10.0
$80,000
🖨 Deal sheet (PDF) 📄 Offer letter ✓ Due diligence
Listing remarks
We & acirc; & euro; & trade; re selling our home in Weleetka. It & acirc; & euro; & trade; s currently a 2-bedroom, 1-bath home, but it has two large living/family rooms, and one could easily be converted into a third bedroom, office, playroom, or hobby space depending on your needs. We & acirc; & euro; & trade; ve completed significant structural improvements during our ownership, and the home is fully livable while still leaving room for someone to continue making it their own. It has a spacious layout and plenty of potential for a family, first-time homebuyer, or investor. One of the best features is the additional lot directly behind the house. The lo
Key facts
- Rv electric hookups
- Additional lot
- Built 1940
Tags
Neighborhood map
What this means for you Summary
Snapshot
- This is a 3-bed/1.0-bath single-family listed at $80k.
Deal economics
- At list price, monthly cash flow is $339 ($4k/yr) — positive.
- The deal already cash-flows at list — no discount required.
- Meets the 1% rule at list price ($1k rent vs $80k).
Location & tenants
- Location reads 59/100 on livability (#376 in OK) — a working-class tenant base; expect higher turnover. Strengths: cost of living A+, crime A; Watch: schools F, amenities F, commute F.
- Weleetka (rural): math 19% / reading 32% proficiency, ranked #345 of 513 in OK (top 67%) — low school quality limits family demand, transient renter base, plan for 1-2y turnover; 81% free/reduced lunch — lower-income household profile, screen leases tightly.
- Market conditions: 20 active listings in the ZIP; 2 units permitted in Okfuskee County in 2024 (0 in 5+ unit buildings).
Forward outlook
- In year one you build about $9k of equity ($553 loan paydown + $8k appreciation (10.0% local appreciation)).
- At projected returns (10.0% appreciation + 3.0% rent growth), your $22k cash investment doubles in ~2 years — after that, you're playing with house money.
- By year 4, paydown + projected appreciation supports a ~$30k cash-out refi (75% LTV) — recoverable capital for the next deal without selling this one.
Negotiation context
- Only 13 days on market — expect competitive offers; lowballing is unlikely to land.
- Current owner paid $45k; list at $80k implies a 78% gain — meaningful room to come down on a strong offer.
Risks & watch-outs
- Watch-outs: built in 1940 — expect roof / HVAC / electrical / plumbing capex.
- Climate carrying-cost: severe wildfire risk; extreme-heat days projected 7→20/yr by 2055 (HVAC capex compounding) — expect insurance premiums to compound above CPI over the hold.
Questions for the listing agent
- Built in 1940 — when were the roof, HVAC, electrical panel, plumbing, and water heater last replaced?
- Is there a deadline driving the sale (1031 exchange, divorce, estate, relocation)? That informs how much negotiation room exists.
- Schools are F-rated, which usually means shorter tenancies and higher turnover. Who's the typical renter profile here, and what's been the actual vacancy rate?
- What's the average days-on-market for RENTAL listings here right now (not sales)? A rising rental-DOM trend means longer vacancies and softer asking-rent achievability than the comps imply.
- What's the recent tenant-quality profile in this submarket — average credit score on applications, eviction rate, late-payment / NSF rate, and stable-employment percentage? A property-management company in the area should have these aggregated.
- How much new for-sale + rental construction is in the pipeline within 1–3 miles? Heavy new supply typically softens prices + rents 12–24 months out; constrained supply supports both.
Investment metrics
- 1% rule
- 1.30% ✓
- Cap rate
- 11.38%
- Cash-on-cash
- 18.18%
- DSCR
- 1.81
- GRM
- 6.4
CMA / ARV
- ARV (on-the-fly)
- $51,168
- Comps found
- 1
Show comp detail 1 sale within ~0.75 mi
| Address | Dist | Beds/Ba | Sqft | Sold | Price | $/sf | Match |
|---|---|---|---|---|---|---|---|
| 611 E 4th St | 0.48mi | 3/1.0 | 1,392 (+12%) | 17mo | $57,500 | $41 | 44 |
Match score weights: distance 35% · size 25% · config 20% · recency 20%. Top-matched comps best support the ARV.
Projected returns pro-forma
10.0% appreciation · 3.0% rent growth · sell at horizon
- IRR
- 37.8%
- Equity multiple
- 3.91×
- Total profit
- $65,156
- Equity at exit
- $72,070
- IRR
- 32.5%
- Equity multiple
- 8.80×
- Total profit
- $174,818
- Equity at exit
- $155,422
Cash invested: $22,400 (down + closing). Projections, not guarantees.
Landlord ↔ Tenant lean methodology
- Overall (STATE)
- 83 Strongly Landlord-Friendly
- State Oklahoma
- 83 Strongly Landlord-Friendly · R+20
- County
- — inherits STATE
- City
- — inherits STATE
ZIP-level market 74880
- Home prices YoY
- 6.8%
- Active inventory
- 20
- Price-to-rent
- 6.4×
Monthly cashflow live
- Estimated rent
- $1,038 medium interval (Pro) →
- Mortgage (P&I)
- −$420
- Tax from tax record
- −$27 /mo · $329/yr
- Insurance
- −$33
- HOA
- −$0
- Vacancy / Maint / Mgmt
- −$218
- Net cashflow
- $339
Break-even live
Sensitivity live
| Price | -10% $385 | -5% $362 | +0% $339 | +5% $317 | +10% $294 |
|---|---|---|---|---|---|
| Rent | -10% $257 | -5% $298 | +0% $339 | +5% $380 | +10% $421 |
| Rate | -1.0pp $380 | -0.5pp $360 | base $339 | +0.5pp $319 | +1.0pp $298 |
UW: 25.0% down · 7.5% · 30yr · 1.5% tax · 5.0% vac · 8.0% maint · 8.0% mgmt
Financing live
Cash to close
- Down payment
- $20,000
- Closing costs
- $2,400
- Reserves months
- —
- Total cash needed
- —
Loan-product check · same deal, 3 products live
Conventional
25% down · 7.5% · 30yr
- Down + closing
- —
- Monthly P&I
- —
- Monthly cashflow
- —
- DSCR
- —
- Eligible?
- —
Personal DTI + credit; lowest rate.
DSCR
20% down · 8.5% · 30yr
- Down + closing
- —
- Monthly P&I
- —
- Monthly cashflow
- —
- DSCR
- —
- Eligible?
- —
No personal income docs; deal must DSCR.
Hard money
10% down · 12.0% · 12mo
- Down + closing
- —
- Monthly P&I
- —
- Monthly cashflow
- —
- DSCR
- —
- Eligible?
- —
Short-term bridge; refi at stabilization.
Listing history 10 events
-
2026-06-18days on market $80,000 Active 13 DOM
-
2026-06-17days on market $80,000 Active 12 DOM
-
2026-06-16days on market $80,000 Active 11 DOM
-
2026-06-15days on market $80,000 Active 10 DOM
-
2026-06-13days on market $80,000 Active 8 DOM
-
2026-06-12days on market $80,000 Active 7 DOM
-
2026-06-09days on market $80,000 Active 4 DOM
-
2026-06-08days on market $80,000 Active 3 DOM
-
2026-06-08remarks 663-char remark
-
2026-06-08$80,000 Active 2 DOM
ⓘ Source: listings_history table (triggers on properties + properties_extension) + one-shot
backfill from property_details.listing_events for pre-trigger history.
Tax reassessment forecast OK · Resets to sale price
- Current annual tax
- $329 · $27/mo
- Projected year-2 tax
- $720 · $60/mo
- Expected delta
- +$391/yr (+$33/mo · 118.8%)
ⓘ Screening estimate from a state-policy table — verify with the county assessor before closing.
Climate risk First Street
- Flood 1/10 Low FEMA zone X · 0% chance over 30 yrs
- Wildfire 8/10 Severe
- Heat 6/10 Major 7 d/yr ≥111°F today · 20 d/yr by 30 yrs out
- Wind 3/10 Moderate 8% chance of damaging wind over 30 yrs
- Air quality 2/10 Low 0 unhealthy d/yr today · 2 by 30 yrs out
Nearby sold comps map
Loading sold comps map…
Walkable amenities ~0.75 mi
Loading nearby amenities…
Taxation est. · year 1
- Rental income
- $12,450
- − Mortgage interest
- −$4,481
- − Property taxes
- −$329
- − Insurance
- −$400
- − Repairs & maintenance
- −$996
- − Management
- −$996
- − Depreciation
- −$2,327
- Taxable income
- $2,921
- Est. tax owed @ 24.0%
- −$701
- After-tax cash flow
- $3,371/yr
For passive investors: Depreciation is non-cash, so a rental often shows a tax loss while cash-flowing — sheltering income. Rental losses are passive: they offset passive income freely, and up to $25,000/yr can offset ordinary (W-2) income if you actively participate and your MAGI is under $100k (phasing out to $0 by $150k); unused losses carry forward. On sale, claimed depreciation is recaptured at up to 25%, and gains may owe capital-gains tax (a 1031 exchange can defer both). Figures are a year-1 estimate at your 24.0% rate — not tax advice; consult a CPA.
Schools (NCES district)
- District
- Weleetka
- NCES district ID
- 4032220
- Math proficiency
- 19% ▼ -6.00%
- Reading proficiency
- 32% ▲ 1.00%
- Median HH income
- $34,490
- Composite
- 23.99/100
- National rank
- #13183
- State rank
- #345 of 513 in OK
Livability — Weleetka
- Score
- 59/100
- State rank
- #376
- US rank
- #19862
Category grades
Schools grade is shown separately in the Schools card above.
Census & demographics
- Census place
- Weleetka, OK
- Population (ZIP)
- 1,920
Population outlook (Okfuskee County) Hauer SSP2
- Today (2025)
- 12,039 people
- By 2030
- 11,980 · -0.5%
- By 2040
- 11,974 · -0.5%
- By 2050
- 11,995 · -0.4%
- By 2075
- 12,581 · +4.5%
- By 2100
- 11,940 · -0.8%
Race, ethnicity, and origin ACS 2023
- Neighborhood character
- Diverse neighborhood (Simpson 0.63)
- Race & ethnicity
- White 60% Native American 16% Two or more races 14% Black 6% Hispanic / Latino 4% Asian 3%
- Common ancestry
- Slovak 1% European 1% Iranian 1%
- Foreign-born
- 2% · Vietnam, Philippines
- Languages at home
- 94% English-only · Spanish 3% Other Asian/Pacific 2%
Political lean MEDSL · Okfuskee
- 2024 margin
- Solid R (+55.8) · D 21.4% · R 77.2% · Other 1.4%
- 2008→2024 swing
- -27.6pp toward R · 2008: -28.2pp · 2024: -55.8pp
- All cycles
- 2024: R+55.8 2020: R+53.5 2016: R+47.0 2012: R+30.1 2008: R+28.2
Not yet ingested
- Civics
- —
Market trends
- HPI YoY
- ▲ 16.09%
- Current HPI
- 251.1292
- Rent YoY
- —
- Metro
- —
- State GDP YoY
- ▲ 1.55%
- F500 in state
- 6
Industry mix (Fortune 500 HQ in OK)
| Industry | F500 HQs | Revenue |
|---|---|---|
| Energy | 3 | $48B |
|
||
Price history
+900.0% since first listed4 events — show timeline
- 2026-06-06 Listed $80,000 FSBO.com
- 2025-09-03 Sold (Public Records) $45,000 Public Records
- 2021-03-18 Sold (Public Records) $25,000 Public Records
- 1995-12-06 Sold (Public Records) $8,000 Public Records
Property tax history
+2.8%/yrLatest (2025): $329 · +6.8% YoY. Source: county tax records.
Cash-flow waterfall
monthlySold comps — $/sqft
last 12 mo · ≤1 miLoading sold comps…