22199 Old US 52 · Laurel, IN
Flood risk 9/10 · Severe
- FEMA flood zone
- A
- Chance of flooding over 30 yrs
- 0.99%
- Est. flood insurance / yr
- $1,009 – $1,996
Fire risk 1/10 · Minimal
- Est. fire insurance / yr
- $717 – $1,331
Heat risk 3/10 · Minor
- Hot days now (above 102°F)
- 7 days/yr
- Hot days in 30 yrs
- 19 days/yr
Wind risk 2/10 · Minimal
- Chance of severe wind over 30 yrs
- 1.0%
Air-quality risk 2/10 · Minimal
- Unhealthy air days now
- 1 days/yr
- Unhealthy air days in 30 yrs
- 2 days/yr
Risk factors via First Street. Map © Google.
Why this score? — see what drove the D grade
The composite is a weighted blend of 9 inputs, each scored 0–100. Each bar is that input's sub-score; the figure is the points it added to the 100-point composite (weight × sub-score).
- Cash flow +12.4/30.0
- Appreciation +9.0/10.0
- Schools +5.0/10.0
- DSCR +3.7/10.0
- 1% rule +3.5/10.0
- Livability +3.1/5.0
- Rent growth +2.5/5.0
- Condition / age +2.2/5.0
- ARV discount +1.3/15.0
$159,900
🖨 Deal sheet (PDF) 📄 Offer letter ✓ Due diligence
Listing remarks
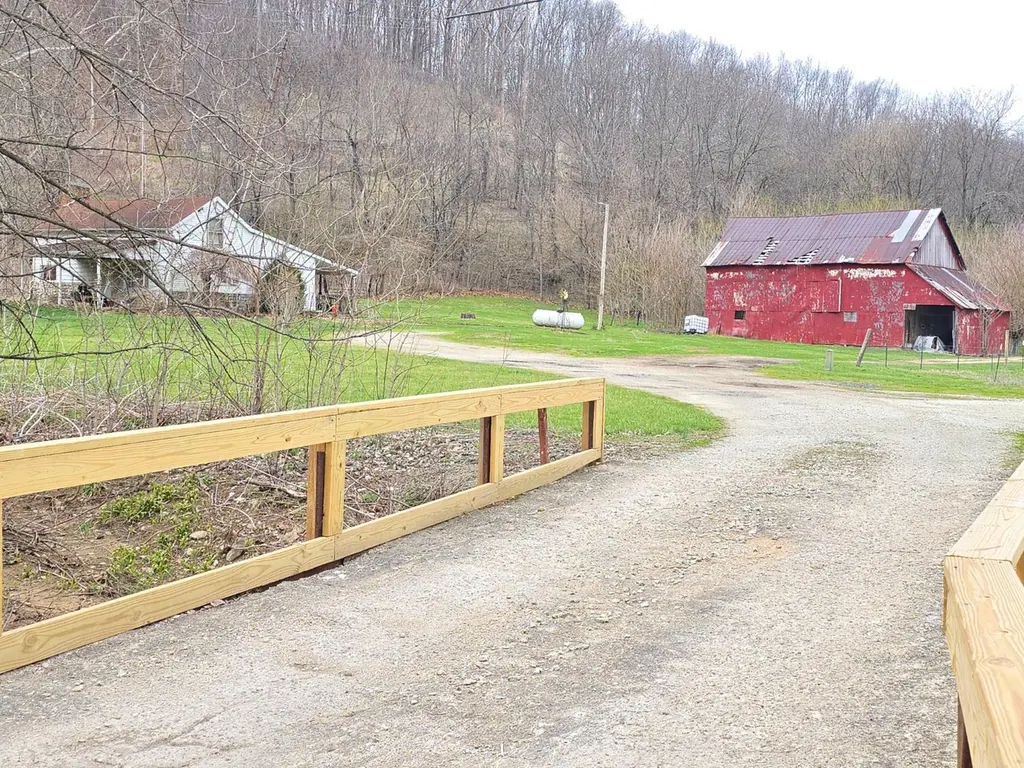
Set on over 6 scenic acres in a peaceful rural setting, this longtime family home offers a unique opportunity to create your own private retreat. Lovingly cared for and lived in by the same owners for more than 50 years, the property is now ready for its next chapter. Ideally situated with convenient access to Metamora, Connersville, and Brookville. This location offers a balance of quiet living with nearby amenities. The home offers approximately 1,464 square feet of living space with a functional and flexible layout. The main level features a nicely sized kitchen, a comfortable living room, and a primary bedroom with generous closet space. Two additional bedrooms are located upstairs, pro
Key facts
- Quiet living
- Expansive yard
- Convenient access
Tags
Property features AI
Exterior
- Parking: Gravel parking; Shared driveway
- Utilities: Private well water; Septic tank
- Home design: Single-family residence; One and one-half levels; 1 story
- Construction: Vinyl siding; Asbestos shingle roof
- Exterior features: Wooded lot; Barn(s)
Interior
- Kitchen: Range; Oven
- Bathrooms: 1 full bathroom
- Heating & cooling: Forced air heating; Wood heating; Window unit cooling
- Interior features: Wood-burning fireplace (1)
- Laundry & utility: Washer; Dryer; Electric water heater
Neighborhood map
What this means for you Summary
Snapshot
- This is a 3-bed/1.0-bath single-family listed at $160k. Condition is rated fair.
Deal economics
- At list price, monthly cash flow is $-152 ($-2k/yr) — negative.
- To cash-flow at today's rent, offer at most $138k (13.8% below list).
- To meet the 1% rule (rent ≥ 1% of price), the offer needs to be $136k (14.6% below list).
- Recommended offer: $136k (14.6% below list) — sets the bar for 1% rule.
Location & tenants
- Location reads 61/100 on livability (#488 in IN) — a middle-class / working-renter tenant base. Strengths: cost of living A+, health & safety A+, housing A-; Watch: crime D-, amenities F, commute F.
- Zoned schools: Franklin County Middle School (math 29% / reading 37%, grade F, #180 of 330 statewide, top 56%, 358 students, 53% FRL); Franklin County High (math 27% / reading 57%, grade F, #197 of 369 statewide, top 57%, 713 students, 44% FRL).
- Market conditions: 58 units permitted in Franklin County in 2024 (0 in 5+ unit buildings).
Forward outlook
- In year one you build about $14k of equity ($1k loan paydown + $13k appreciation (7.9% local appreciation)).
- Franklin County population projected to shrink 10% by 2050 — rents likely to lag national; underwrite the cash flow, not the appreciation.
- By year 3, paydown + projected appreciation supports a ~$34k cash-out refi (75% LTV) — recoverable capital for the next deal without selling this one.
Negotiation context
- It's been on market 28 days — a 2% lower offer ($158k) is reasonable based on typical stale-listing flexibility.
Risks & watch-outs
- Watch-outs: flood insurance adds $125/mo; built in 1900 — expect roof / HVAC / electrical / plumbing capex.
- Climate carrying-cost: in FEMA flood zone A (mandatory federal flood insurance) — expect insurance premiums to compound above CPI over the hold.
Questions for the listing agent
- What do current leases actually rent for vs. the listed asking? Can we see a recent rent roll and the last 12 months of T-12 income?
- Have any recent inspections been done? Can we get a copy of the seller's disclosures and any deferred-maintenance estimates?
- Built in 1900 — when were the roof, HVAC, electrical panel, plumbing, and water heater last replaced?
- What's the actual annual flood-insurance premium (NFIP or private), and is the property in a SFHA with mandatory coverage?
- Is there a deadline driving the sale (1031 exchange, divorce, estate, relocation)? That informs how much negotiation room exists.
- Schools are F-rated, which usually means shorter tenancies and higher turnover. Who's the typical renter profile here, and what's been the actual vacancy rate?
- Crime grade is D in this area — have there been break-ins, vandalism, or insurance claims at this property in the last 3 years? What carrier currently insures it and at what premium?
- The area grade is low — what's the realistic commute time and amenity access for the typical tenant pool here? Any planned neighborhood developments (good or bad) we should know about?
- What's the average days-on-market for RENTAL listings here right now (not sales)? A rising rental-DOM trend means longer vacancies and softer asking-rent achievability than the comps imply.
- What's the recent tenant-quality profile in this submarket — average credit score on applications, eviction rate, late-payment / NSF rate, and stable-employment percentage? A property-management company in the area should have these aggregated.
- How much new for-sale + rental construction is in the pipeline within 1–3 miles? Heavy new supply typically softens prices + rents 12–24 months out; constrained supply supports both.
Investment metrics
- 1% rule
- 0.85% ✗
- Cap rate
- 6.09%
- Cash-on-cash
- -0.72%
- DSCR
- 0.97
- GRM
- 9.8
CMA / ARV
- ARV (on-the-fly)
- $140,544
- Comps found
- 2
Show comp detail 2 sales within ~0.75 mi
| Address | Dist | Beds/Ba | Sqft | Sold | Price | $/sf | Match |
|---|---|---|---|---|---|---|---|
| 22199 Old US 52 | 0.00mi | 3/1.0 | 1,464 (0%) | 1mo | $140,000 | $96 | 100 |
| 22199 Old Us Highway 52 | 0.00mi | 3/1.0 | 1,464 (0%) | 1mo | $140,000 | $96 | 99 |
Match score weights: distance 35% · size 25% · config 20% · recency 20%. Top-matched comps best support the ARV.
Projected returns pro-forma
7.94% appreciation · 3.0% rent growth · sell at horizon
- IRR
- 16.8%
- Equity multiple
- 2.24×
- Total profit
- $55,699
- Equity at exit
- $120,858
- IRR
- 16.2%
- Equity multiple
- 4.77×
- Total profit
- $168,974
- Equity at exit
- $239,312
Cash invested: $44,772 (down + closing). Projections, not guarantees.
Landlord ↔ Tenant lean methodology
- Overall (STATE)
- 90 Strongly Landlord-Friendly
- State Indiana
- 90 Strongly Landlord-Friendly · R+11
- County
- — inherits STATE
- City
- — inherits STATE
ZIP-level market 47024
- Home prices YoY
- 3.2%
- Price-to-rent
- 9.8×
Monthly cashflow live
- Estimated rent
- $1,365 medium interval (Pro) →
- Mortgage (P&I)
- −$839
- Tax est. 1.5%
- −$200 /mo · $2,398/yr
- Insurance
- −$67
- Flood insurance flood zone
- −$125 /mo · $1,502/yr
- HOA
- −$0
- Vacancy / Maint / Mgmt
- −$287
- Net cashflow
- $-152
Break-even live
Sensitivity live
| Price | -10% $-42 | -5% $-97 | +0% $-152 | +5% $-207 | +10% $-263 |
|---|---|---|---|---|---|
| Rent | -10% $-260 | -5% $-206 | +0% $-152 | +5% $-98 | +10% $-44 |
| Rate | -1.0pp $-72 | -0.5pp $-111 | base $-152 | +0.5pp $-193 | +1.0pp $-236 |
UW: 25.0% down · 7.5% · 30yr · 1.5% tax · 5.0% vac · 8.0% maint · 8.0% mgmt
Financing live
Cash to close
- Down payment
- $39,975
- Closing costs
- $4,797
- Reserves months
- —
- Total cash needed
- —
Loan-product check · same deal, 3 products live
Conventional
25% down · 7.5% · 30yr
- Down + closing
- —
- Monthly P&I
- —
- Monthly cashflow
- —
- DSCR
- —
- Eligible?
- —
Personal DTI + credit; lowest rate.
DSCR
20% down · 8.5% · 30yr
- Down + closing
- —
- Monthly P&I
- —
- Monthly cashflow
- —
- DSCR
- —
- Eligible?
- —
No personal income docs; deal must DSCR.
Hard money
10% down · 12.0% · 12mo
- Down + closing
- —
- Monthly P&I
- —
- Monthly cashflow
- —
- DSCR
- —
- Eligible?
- —
Short-term bridge; refi at stabilization.
Listing history 4 events
-
2026-05-04status Pending
-
2026-04-23price $159,900
-
2026-04-08price $175,000
-
2026-04-06$195,000 Active
ⓘ Source: listings_history table (triggers on properties + properties_extension) + one-shot
backfill from property_details.listing_events for pre-trigger history.
Climate risk First Street
- Flood 9/10 Extreme FEMA zone A · 99% chance over 30 yrs
- Wildfire 1/10 Low
- Heat 3/10 Moderate 7 d/yr ≥102°F today · 19 d/yr by 30 yrs out
- Wind 2/10 Low 100% chance of damaging wind over 30 yrs
- Air quality 2/10 Low 1 unhealthy d/yr today · 2 by 30 yrs out
Nearby sold comps map
Loading sold comps map…
Walkable amenities ~0.75 mi
Loading nearby amenities…
Taxation est. · year 1
- Rental income
- $16,378
- − Mortgage interest
- −$8,957
- − Property taxes
- −$2,398
- − Insurance
- −$2,302
- − Repairs & maintenance
- −$1,310
- − Management
- −$1,310
- − Depreciation
- −$4,652
- Taxable loss
- −$4,552
- Est. tax savings @ 24.0%
- +$1,092
- After-tax cash flow
- $-732/yr
For passive investors: Depreciation is non-cash, so a rental often shows a tax loss while cash-flowing — sheltering income. Rental losses are passive: they offset passive income freely, and up to $25,000/yr can offset ordinary (W-2) income if you actively participate and your MAGI is under $100k (phasing out to $0 by $150k); unused losses carry forward. On sale, claimed depreciation is recaptured at up to 25%, and gains may owe capital-gains tax (a 1031 exchange can defer both). Figures are a year-1 estimate at your 24.0% rate — not tax advice; consult a CPA.
Condition & rehab AI · 2 photos
The property requires significant repairs and maintenance, including roof replacement, exterior repainting, and HVAC system replacement. Landscaping and curb-side improvements will also enhance its appeal.
Repairs flagged
- Major roof — Signs of wear and discoloration suggest significant damage and potential water infiltration.
- Major exterior siding — Peeling and deterioration indicate a need for repainting and possibly replacement.
- Major HVAC/mechanicals — Given the age of the property, HVAC systems are likely outdated and in need of replacement or repair.
- Major interior walls/paint — The walls appear to be in poor condition, indicating a need for painting and possibly repairs to the drywall or plaster.
Value-add opportunities
- Both painting and repainting — Painting and repainting the exterior and interior will improve the home's curb appeal and interior condition, enhancing both resale and rental value.
- Both landscaping and curb-side improvements — Landscaping and curb-side improvements will enhance the home's curb appeal and make it more attractive to potential buyers or renters.
- Both HVAC replacement — Replacing outdated HVAC systems will improve comfort and energy efficiency, making the home more attractive to buyers and renters.
- Both roof replacement — Replacing the old roof will address potential water damage and improve the home's overall condition, enhancing both resale and rental value.
Renovation cost estimate screening
| Repair item | Severity | Est. cost |
|---|---|---|
| roof · Signs of wear and discoloration suggest significant damage and potential water infiltration. | Major | $15,000–50,000 |
| exterior siding · Peeling and deterioration indicate a need for repainting and possibly replacement. | Major | $15,000–50,000 |
| HVAC/mechanicals · Given the age of the property, HVAC systems are likely outdated and in need of replacement or repair. | Major | $15,000–50,000 |
| interior walls/paint · The walls appear to be in poor condition, indicating a need for painting and possibly repairs to the drywall or plaster. | Major | $15,000–50,000 |
| Total estimated repair cost · 4 items | $60,000–200,000 |
Value-add ROI direction
- Both painting and repainting — Painting and repainting the exterior and interior will improve the home's curb appeal and interior condition, enhancing both resale and rental value. ↑
- Both landscaping and curb-side improvements — Landscaping and curb-side improvements will enhance the home's curb appeal and make it more attractive to potential buyers or renters. ↑
- Both HVAC replacement — Replacing outdated HVAC systems will improve comfort and energy efficiency, making the home more attractive to buyers and renters. ↑
- Both roof replacement — Replacing the old roof will address potential water damage and improve the home's overall condition, enhancing both resale and rental value. ↑
ⓘ Cost ranges are severity-bucket heuristics (US national rule-of-thumb). Get contractor quotes + a written scope before underwriting a rehab budget.
Schools (NCES district)
No district data.
Livability — Laurel
- Score
- 61/100
- State rank
- #488
- US rank
- #17449
Category grades
Schools grade is shown separately in the Schools card above.
Census & demographics
- Population (ZIP)
- 2,909
Population outlook (Franklin County) Hauer SSP2
- Today (2025)
- 22,796 people
- By 2030
- 22,556 · -1.1%
- By 2040
- 21,762 · -4.5%
- By 2050
- 20,575 · -9.7%
- By 2075
- 17,810 · -21.9%
- By 2100
- 13,698 · -39.9%
Race, ethnicity, and origin ACS 2023
- Neighborhood character
- Predominantly White (93%)
- Race & ethnicity
- White 93% Two or more races 4% Hispanic / Latino 2%
- Common ancestry
- Slovak 2% Italian 2% Romanian 2%
- Languages at home
- 98% English-only · German/W. Germanic 1%
Political lean MEDSL · Franklin
- 2024 margin
- Solid R (+64.4) · D 17.1% · R 81.5% · Other 1.3%
- 2008→2024 swing
- -30.3pp toward R · 2008: -34.1pp · 2024: -64.4pp
- All cycles
- 2024: R+64.4 2020: R+63.0 2016: R+60.9 2012: R+42.8 2008: R+34.1
Not yet ingested
- Civics
- —
Market trends
- HPI YoY
- ▲ 7.94%
- Current HPI
- 255.8207
- Rent YoY
- —
- Metro
- —
- State GDP YoY
- ▲ 2.90%
- F500 in state
- 18
Industry mix (Fortune 500 HQ in IN)
| Industry | F500 HQs | Revenue |
|---|---|---|
| Industrial Machinery | 2 | $37B |
|
||
| Healthcare | 1 | $177B |
|
||
| Pharmaceuticals | 1 | $45B |
|
||
| Metals / Steel | 1 | $18B |
|
||
| Agriculture | 1 | $17B |
|
||
| Packaging | 1 | $12B |
|
||
Price history
-18.0% since first listed4 events — show timeline
- 2026-05-04 Pending — SEIBR
- 2026-04-23 Price Changed $159,900 SEIBR
- 2026-04-08 Price Changed $175,000 SEIBR
- 2026-04-06 Listed $195,000 SEIBR
Cash-flow waterfall
monthlySold comps — $/sqft
last 12 mo · ≤1 miLoading sold comps…