2807 7th St · Lake Charles, LA
Flood risk 7/10 · Major
- FEMA flood zone
- X (unshaded)
- Chance of flooding over 30 yrs
- 0.99%
- Est. flood insurance / yr
- $507 – $1,088
Fire risk 2/10 · Minimal
- Est. fire insurance / yr
- $1,269 – $2,357
Heat risk 9/10 · Severe
- Hot days now (above 109°F)
- 7 days/yr
- Hot days in 30 yrs
- 22 days/yr
Wind risk 9/10 · Severe
- Chance of severe wind over 30 yrs
- 99.0%
Air-quality risk 2/10 · Minimal
- Unhealthy air days now
- 1 days/yr
- Unhealthy air days in 30 yrs
- 1 days/yr
Risk factors via First Street. Map © Google.
Why this score? — see what drove the C- grade
The composite is a weighted blend of 9 inputs, each scored 0–100. Each bar is that input's sub-score; the figure is the points it added to the 100-point composite (weight × sub-score).
- Cash flow +27.1/30.0
- DSCR +9.4/10.0
- 1% rule +6.2/10.0
- Livability +3.4/5.0
- Schools +3.1/10.0
- Rent growth +2.5/5.0
- Condition / age +2.5/5.0
- ARV discount +0.0/15.0
- Appreciation +0.0/10.0
$84,900
🖨 Deal sheet 📄 Offer letter ✓ Due diligence
Listing remarks MLS
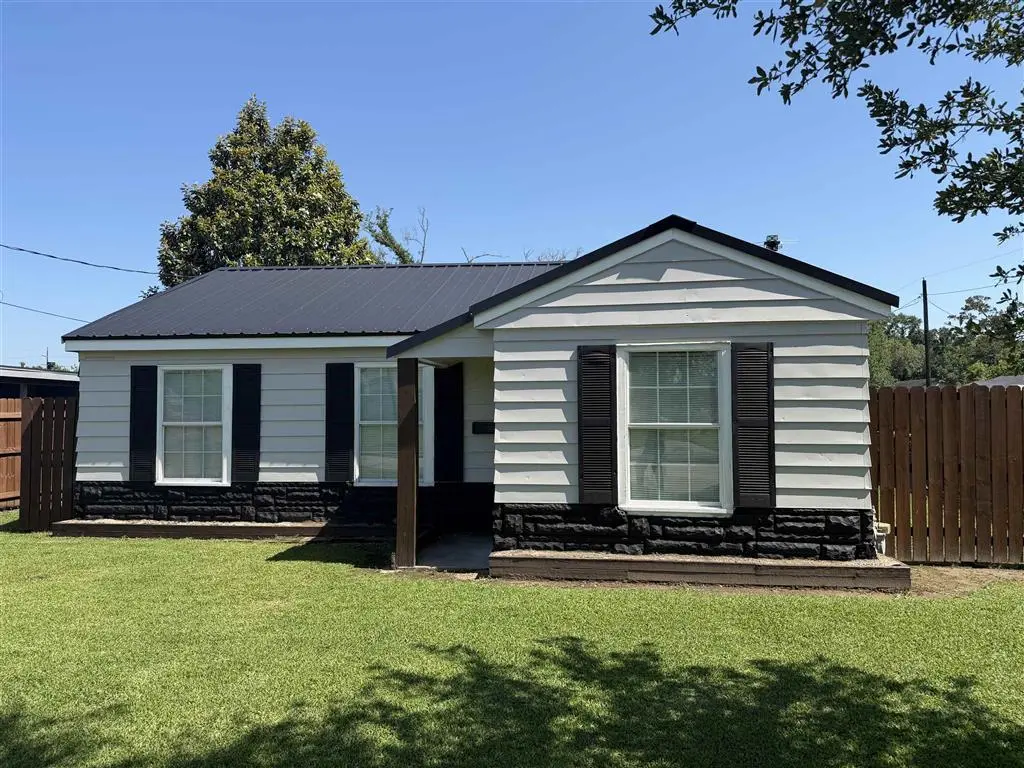
Charming 3 bedroom, 1 bath home featuring a durable metal roof and covered carport with space for 2 vehicles. This property offers a spacious yard, perfect for outdoor activities, entertaining, or future additions. Two storage building provide plenty of room for tools, equipment, or hobbies. A great opportunity for a first-time homebuyer , investor, or anyone looking for comfortable living with extra space.
Key facts
- Spacious yard
- Metal roof
- Covered carport
Tags
Neighborhood map
What this means for you Summary
Snapshot
- This is a 3-bed/1.0-bath single-family listed at $85k.
Deal economics
- At list price, monthly cash flow is $175 ($2k/yr) — positive.
- The deal already cash-flows at list — no discount required.
- Meets the 1% rule at list price ($950 rent vs $85k).
- Recommended offer: $80k (6.0% below list) — sets the bar for market timing.
- Cap rate 9.7% vs local median 4.3% in Lake Charles — top-decile yield for the area; either an underpriced asset or a hidden risk that comps aren't pricing in. Stress-test before assuming the spread holds.
Location & tenants
- Location reads 68/100 on livability (#95 in LA) — a middle-class / working-renter tenant base. Strengths: commute A+, cost of living A+, housing A+; Watch: crime F, amenities F, employment D-.
- Calcasieu Parish (other): math 30% / reading 44% proficiency, ranked #29 of 98 in LA (top 30%) — families likely to look elsewhere, expect single-tenant / working-renter base with shorter leases.
- Market conditions: 162 active listings in the ZIP; 7 comparable units currently listed for rent nearby; rentals at typical pace (median 21d on market — plan ~3-4 weeks tenant-placement turnaround); 43% of comp listings sitting > 30 days — soft ceiling on asking rent; lower-income renter base — watch delinquency; 1,298 units permitted in Calcasieu Parish in 2024 (526 in 5+ unit buildings).
Forward outlook
- Local home prices are declining (-3.0%/yr); year-one equity from $587 of loan paydown is wiped out by about $3k of value loss. Plan a longer hold.
- Calcasieu County population projected at +11% by 2050 — modest demand growth; plan on rents tracking national, not racing it.
Negotiation context
- It's been on market 78 days — a 6% lower offer ($80k) is reasonable based on typical stale-listing flexibility.
- 2 sale attempts since 11y ago; this cycle's ask has dropped $15k (15%) from the opening price — seller is motivated, your offer sets the floor, not the list.
- Current owner paid $50k; list at $85k implies a 70% gain — meaningful room to come down on a strong offer.
Risks & watch-outs
- Watch-outs: flood insurance adds $66/mo; built in 1946 — expect roof / HVAC / electrical / plumbing capex.
- Climate carrying-cost: major flood risk; severe wind risk, 99% chance of damaging wind over 30y; extreme-heat days projected 7→22/yr by 2055 (HVAC capex compounding) — expect insurance premiums to compound above CPI over the hold.
Questions for the listing agent
- It's been on market 78 days. Have you received any prior offers? Is the seller open to a 6% concession, seller financing, or rate buy-down credit?
- Built in 1946 — when were the roof, HVAC, electrical panel, plumbing, and water heater last replaced?
- What's the actual annual flood-insurance premium (NFIP or private), and is the property in a SFHA with mandatory coverage?
- Why hasn't it sold? Are there any deal-killer items the seller is aware of (foundation, flood, title, zoning, code violations)?
- Is there a deadline driving the sale (1031 exchange, divorce, estate, relocation)? That informs how much negotiation room exists.
- Schools are B-rated — typically a magnet for longer-tenancy family renters. What's the average tenant stay here, and is there a school-zone premium baked into asking?
- Crime grade is F in this area — have there been break-ins, vandalism, or insurance claims at this property in the last 3 years? What carrier currently insures it and at what premium?
- What's the average days-on-market for RENTAL listings here right now (not sales)? A rising rental-DOM trend means longer vacancies and softer asking-rent achievability than the comps imply.
- What's the recent tenant-quality profile in this submarket — average credit score on applications, eviction rate, late-payment / NSF rate, and stable-employment percentage? A property-management company in the area should have these aggregated.
- How much new for-sale + rental construction is in the pipeline within 1–3 miles? Heavy new supply typically softens prices + rents 12–24 months out; constrained supply supports both.
Investment metrics
- 1% rule
- 1.12% ✓
- Cap rate
- 9.70%
- Cash-on-cash
- 12.18%
- DSCR
- 1.54
- GRM
- 7.5
CMA / ARV
- ARV (median comp)
- $72,657
- List price
- $84,900
- Delta
- 16.85%
- Verdict
- OVERPRICED
- Comps
- 16 within 1.0 mi
Show comp detail 2 sales within ~0.75 mi
| Address | Dist | Beds/Ba | Sqft | Sold | Price | $/sf | Match |
|---|---|---|---|---|---|---|---|
| 1803 9th Ave | 0.40mi | 2/1.0 (-1) | 725 (-14%) | 16mo | $45,000 | $62 | 39 |
| 2324 Rose St | 0.71mi | 2/1.0 (-1) | 806 (-5%) | 23mo | $83,500 | $104 | 34 |
Match score weights: distance 35% · size 25% · config 20% · recency 20%. Top-matched comps best support the ARV.
Projected returns pro-forma
-3.0% appreciation · 3.0% rent growth · sell at horizon
- IRR
- -2.9%
- Equity multiple
- 0.89×
- Total profit
- $-2,614
- Equity at exit
- $12,659
- IRR
- 6.8%
- Equity multiple
- 1.51×
- Total profit
- $12,092
- Equity at exit
- $7,341
Cash invested: $23,772 (down + closing). Projections, not guarantees.
Landlord ↔ Tenant lean methodology
- Overall (STATE)
- 90 Strongly Landlord-Friendly
- State Louisiana
- 90 Strongly Landlord-Friendly · R+12
- County
- — inherits STATE
- City
- — inherits STATE
ZIP-level market 70615
- Active inventory
- 162
- Price-to-rent
- 7.5×
Monthly cashflow live
- Estimated rent
- $950 high interval (Pro) →
- Mortgage (P&I)
- −$445
- Tax from tax record
- −$28 /mo · $338/yr
- Insurance
- −$35
- Flood insurance flood zone
- −$66 /mo · $798/yr
- HOA
- −$0
- Vacancy / Maint / Mgmt
- −$199
- Net cashflow
- $175
Break-even live
UW: 25.0% down · 7.5% · 30yr · 1.5% tax · 5.0% vac · 8.0% maint · 8.0% mgmt
Financing live
Cash to close
- Down payment
- $21,225
- Closing costs
- $2,547
- Reserves months
- —
- Total cash needed
- —
Loan-product check · same deal, 3 products live
Conventional
25% down · 7.5% · 30yr
- Down + closing
- —
- Monthly P&I
- —
- Monthly cashflow
- —
- DSCR
- —
- Eligible?
- —
Personal DTI + credit; lowest rate.
DSCR
20% down · 8.5% · 30yr
- Down + closing
- —
- Monthly P&I
- —
- Monthly cashflow
- —
- DSCR
- —
- Eligible?
- —
No personal income docs; deal must DSCR.
Hard money
10% down · 12.0% · 12mo
- Down + closing
- —
- Monthly P&I
- —
- Monthly cashflow
- —
- DSCR
- —
- Eligible?
- —
Short-term bridge; refi at stabilization.
Rent comps 7 comps
| Address | Beds | Baths | Sqft | Rent | $/sqft | DOM | Units | Dist |
|---|---|---|---|---|---|---|---|---|
| 1105 Hunter Dr Lake Charles, LA | 2.0 | 1.0 | 849 | $900 | $1.06 | 44d | 1 | 0.34mi |
| 2405 9th St Lake Charles, LA | 2.0 | 1.0 | 788 | $850 | $1.08 | 13d | 1 | 0.40mi |
| 1906 8th Ave Lake Charles, LA | 3.0 | 1.0 | 1001 | $1,350 | $1.35 | 44d | 1 | 0.62mi |
| 2701 Cline St Unit C Lake Charles, LA | 2.0 | 1.0 | 864 | $700 | $0.81 | 21d | 1 | 0.94mi |
| 333 Mill St Lake Charles, LA | 1.0–2.0 | 1.0 | 758 | $750 | $0.99 | 13d | 1 | 1.05mi |
| 1915 Legion St Lake Charles, LA | 3.0 | 1.0 | 966 | $950 | $0.98 | 13d | 1 | 1.09mi |
| 1505 7th St Lake Charles, LA | 2.0 | 1.0 | 1054 | $900 | $0.85 | 44d | 1 | 1.43mi |
Listing history 21 events
-
2026-06-19days on market $84,900 Active 78 DOM
-
2026-06-18days on market $84,900 Active 77 DOM
-
2026-06-17days on market $84,900 Active 76 DOM
-
2026-06-16days on market $84,900 Active 75 DOM
-
2026-06-15days on market $84,900 Active 74 DOM
-
2026-06-14days on market $84,900 Active 72 DOM
-
2026-06-13pricedays on market $84,900 Active 71 DOM
-
2026-06-10days on market $89,500 Active 69 DOM
-
2026-06-09days on market $89,500 Active 68 DOM
-
2026-06-08days on market $89,500 Active 67 DOM
-
2026-06-07days on market $89,500 Active 66 DOM
-
2026-06-05days on market $89,500 Active 63 DOM
-
2026-06-02days on market $89,500 Active 61 DOM
-
2026-06-01days on market $89,500 Active 60 DOM
-
2026-05-31days on market $89,500 Active 59 DOM
-
2026-05-30days on market $89,500 Active 58 DOM
-
2026-04-02$99,900 Active 410-char remark
Show marketing remark (410 chars)
Charming 3 bedroom, 1 bath home featuring a durable metal roof and covered carport with space for 2 vehicles. This property offers a spacious yard, perfect for outdoor activities, entertaining, or future additions. Two storage building provide plenty of room for tools, equipment, or hobbies. A great opportunity for a first-time homebuyer , investor, or anyone looking for comfortable living with extra space.
-
2016-09-06soldstatus $50,000
-
2016-01-20soldstatus 241-char remark
Show marketing remark (241 chars)
Possible investment property. New energy efficient windows, new doors, fresh paint and a new tub surround, all on large corner lot. Seller to install an air/heat window unit before closing. http://www. propertypanorama.com/mls. asp?id=253289
-
2015-02-25$40,000 241-char remark
Show marketing remark (241 chars)
Possible investment property. New energy efficient windows, new doors, fresh paint and a new tub surround, all on large corner lot. Seller to install an air/heat window unit before closing. http://www. propertypanorama.com/mls. asp?id=253289
-
2005-02-22soldstatus $37,200
ⓘ Source: listings_history table (triggers on properties + properties_extension) + one-shot
backfill from property_details.listing_events for pre-trigger history.
Tax reassessment forecast LA · Resets to sale price
- Current annual tax
- $338 · $28/mo
- Projected year-2 tax
- $467 · $39/mo
- Expected delta
- +$128/yr (+$11/mo · 38.0%)
ⓘ Screening estimate from a state-policy table — verify with the county assessor before closing.
Climate risk First Street
- Flood 7/10 Severe FEMA zone X (unshaded) · 99% chance over 30 yrs
- Wildfire 2/10 Low
- Heat 9/10 Extreme 7 d/yr ≥109°F today · 22 d/yr by 30 yrs out
- Wind 9/10 Extreme 99% chance of damaging wind over 30 yrs
- Air quality 2/10 Low 1 unhealthy d/yr today · 1 by 30 yrs out
Nearby sold comps map
Loading sold comps map…
Walkable amenities ~0.75 mi
Loading nearby amenities…
Taxation est. · year 1
- Rental income
- $11,394
- − Mortgage interest
- −$4,756
- − Property taxes
- −$338
- − Insurance
- −$1,222
- − Repairs & maintenance
- −$912
- − Management
- −$912
- − Depreciation
- −$2,470
- Taxable income
- $785
- Est. tax owed @ 24.0%
- −$188
- After-tax cash flow
- $1,910/yr
For passive investors: Depreciation is non-cash, so a rental often shows a tax loss while cash-flowing — sheltering income. Rental losses are passive: they offset passive income freely, and up to $25,000/yr can offset ordinary (W-2) income if you actively participate and your MAGI is under $100k (phasing out to $0 by $150k); unused losses carry forward. On sale, claimed depreciation is recaptured at up to 25%, and gains may owe capital-gains tax (a 1031 exchange can defer both). Figures are a year-1 estimate at your 24.0% rate — not tax advice; consult a CPA.
Schools (NCES district)
- District
- Calcasieu Parish
- NCES district ID
- 2200330
- Math proficiency
- 30% ▼ -39.00%
- Reading proficiency
- 44% ▼ -33.00%
- Median HH income
- $44,700
- Composite
- 31.45/100
- National rank
- #5979
- State rank
- #29 of 98 in LA
Livability — Lake Charles
- Score
- 68/100
- State rank
- #95
- US rank
- #9820
Category grades
Schools grade is shown separately in the Schools card above.
Census & demographics
- Census place
- Lake Charles, LA
- County
- Calcasieu Parish · 170,889 people
- City population
- 133,538
- Metro
- Lake Charles, LA
- Population (ZIP)
- 12,980
- Household income
- $40,047
- Rent vs Own
- Severe rent burden
- 639.0
Population outlook (Calcasieu County) Hauer SSP2
- Today (2025)
- 212,179 people
- By 2030
- 218,199 · +2.8%
- By 2040
- 228,486 · +7.7%
- By 2050
- 236,208 · +11.3%
- By 2075
- 251,696 · +18.6%
- By 2100
- 247,848 · +16.8%
Race, ethnicity, and origin ACS 2023
- Neighborhood character
- Diverse neighborhood (Simpson 0.57)
- Race & ethnicity
- Black 56% White 33% Hispanic / Latino 6% Two or more races 4%
- Hispanic origin (detail)
- Mexican 5%
- Common ancestry
- Lithuanian 8% Serbian 2% Iranian 1%
- Foreign-born
- 1% · Canada
- Languages at home
- 92% English-only · Spanish 4% French/Haitian/Cajun 2%
Political lean MEDSL · Calcasieu
- 2024 margin
- Solid R (+39.6) · D 29.5% · R 69.0% · Other 1.5%
- 2008→2024 swing
- -15.0pp toward R · 2008: -24.6pp · 2024: -39.6pp
- All cycles
- 2024: R+39.6 2020: R+35.2 2016: R+33.3 2012: R+28.7 2008: R+24.6
Not yet ingested
- Civics
- —
Market trends
- HPI YoY
- ▼ -68.09%
- Current HPI
- 87.8826
- Rent YoY
- —
- Metro
- Lake Charles, LA
- State GDP YoY
- ▲ 3.29%
- F500 in state
- 10
Industry mix (Fortune 500 HQ in LA)
| Industry | F500 HQs | Revenue |
|---|---|---|
| Telecommunications | 2 | $23B |
|
||
| Utilities | 1 | $12B |
|
||
| Wholesale / Distribution | 1 | $5B |
|
||
| Advertising | 1 | $2B |
|
||
Price history
+168.5% since first listed5 events — show timeline
- 2026-04-02 Listed $99,900 SWLAR
- 2016-09-06 Sold (Public Records) $50,000 Public Records
- 2016-01-20 Sold (MLS) — SWLAR
- 2015-02-25 Listed $40,000 SWLAR
- 2005-02-22 Sold (Public Records) $37,200 Public Records
Property tax history
+0.7%/yrLatest (2025): $338 · +4.5% YoY. Source: county tax records.
Cash-flow waterfall
monthlySold comps — $/sqft
last 12 mo · ≤1 miLoading sold comps…