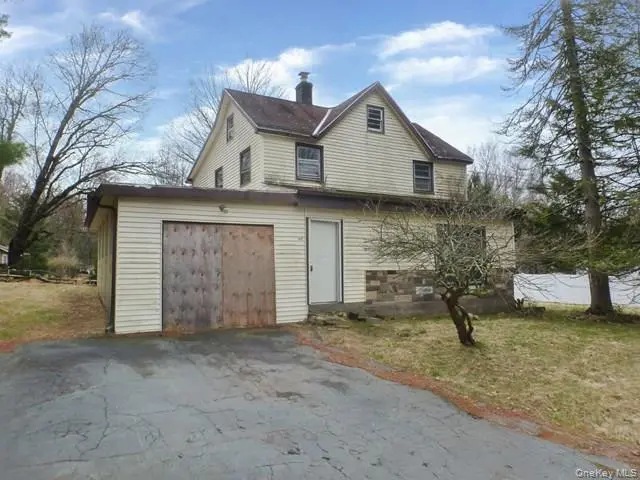
119 Katrina Falls Rd · Rock Hill, NY
Flood risk 1/10 · Minimal
- FEMA flood zone
- X (unshaded)
- Chance of flooding over 30 yrs
- 0.0%
- Est. flood insurance / yr
- $507 – $1,088
Fire risk 4/10 · Minor
- Est. fire insurance / yr
- $691 – $1,283
Heat risk 2/10 · Minimal
- Hot days now (above 93°F)
- 7 days/yr
- Hot days in 30 yrs
- 15 days/yr
Wind risk 3/10 · Minor
- Chance of severe wind over 30 yrs
- 5.0%
Air-quality risk 2/10 · Minimal
- Unhealthy air days now
- 1 days/yr
- Unhealthy air days in 30 yrs
- 1 days/yr
Risk factors via First Street. Map © Google.
Why this score? — see what drove the B+ grade
The composite is a weighted blend of 9 inputs, each scored 0–100. Each bar is that input's sub-score; the figure is the points it added to the 100-point composite (weight × sub-score).
- Cash flow +30.0/30.0
- 1% rule +10.0/10.0
- DSCR +10.0/10.0
- Appreciation +10.0/10.0
- ARV discount +7.5/15.0
- Livability +3.5/5.0
- Rent growth +2.5/5.0
- Schools +2.5/10.0
- Condition / age +2.5/5.0
$154,900
🖨 Deal sheet 📄 Offer letter ✓ Due diligence
Listing remarks
Summertime in the Sullivan County Catskills is the perfect time to undertake this home rehab project on Katrina Falls Road. This 1836 square foot two story has four bedrooms, one full and one half bath, an eat-in kitchen and a one car attached garage. The home is set on a level one acre lot, with a small storage shed and patio out back. The place has great potential, but will need significant repairs and updates, so this is likely to be a cash or rehab loan only.
Key facts
- Level one acre lot
- Patio out back
- Eat-in kitchen
Tags
Property features AI
Exterior
- Parking: Driveway; 1-car garage
- Utilities: Electricity available (NYSEG); Septic tank sewer
- Home design: Single family residence; Listed condition: Fixer
- Construction: Frame construction
- Exterior features: Back yard
Interior
- Kitchen: No appliances included
- Bedrooms: 6 total rooms (includes bedrooms; one on the first floor)
- Bathrooms: 1 full bathroom; 1 half bathroom
- Heating & cooling: Forced air heating; No central cooling
- Interior features: First-floor bedroom; Partial basement
- Laundry & utility: No listed laundry appliances
Neighborhood map
What this means for you Summary
Snapshot
- This is a 4-bed/1.0-bath single-family listed at $155k.
Deal economics
- At list price, monthly cash flow is $699 ($8k/yr) — positive.
- The deal already cash-flows at list — no discount required.
- Meets the 1% rule at list price ($3k rent vs $155k).
- Recommended offer: $150k (3.0% below list) — sets the bar for market timing.
- Cap rate 11.7% vs local median 2.6% in Rock Hill — top-decile yield for the area; either an underpriced asset or a hidden risk that comps aren't pricing in. Stress-test before assuming the spread holds.
Location & tenants
- Location reads 69/100 on livability (#478 in NY) — a middle-class / working-renter tenant base. Strengths: crime A+, employment A+, housing A+; Watch: cost of living D+, amenities F, commute F.
- Monticello Central School District (town): math 29% / reading 30% proficiency, ranked #577 of 590 in NY (top 98%) — low school quality limits family demand, transient renter base, plan for 1-2y turnover.
- Zoned schools: Emma C Chase School (math 32% / reading 47%, grade F, #1,444 of 2,108 statewide, top 71%, 228 students, 57% FRL); Robert J Kaiser Middle School (math 7% / reading 35%, grade F, #661 of 729 statewide, top 91%, 595 students, 66% FRL); Monticello High School (math 82% / reading 34%, grade C, #879 of 1,100 statewide, top 80%, 844 students, 63% FRL).
- Market conditions: 62 active listings in the ZIP; 739 units permitted in Sullivan County in 2024 (5 in 5+ unit buildings).
Forward outlook
- In year one you build about $17k of equity ($1k loan paydown + $15k appreciation (10.0% local appreciation)).
- Sullivan County population projected at -24% by 2050 — secular population decline; favor cash flow + early exit over multi-decade hold.
- At projected returns (10.0% appreciation + 3.0% rent growth), your $43k cash investment doubles in ~2 years — after that, you're playing with house money.
- By year 3, paydown + projected appreciation supports a ~$42k cash-out refi (75% LTV) — recoverable capital for the next deal without selling this one.
Negotiation context
- It's been on market 32 days — a 3% lower offer ($150k) is reasonable based on typical stale-listing flexibility.
- 5 sale attempts since 2y ago with the ask held roughly flat each time — persistent listings suggest the price (not the market) is what's stuck; bring a comps-based counter.
- Current owner paid $85k; list at $155k implies a 82% gain — meaningful room to come down on a strong offer.
Risks & watch-outs
- Watch-outs: property tax is 3.8% of price.
Questions for the listing agent
- It's been on market 32 days. Have you received any prior offers? Is the seller open to a 3% concession, seller financing, or rate buy-down credit?
- Built in 1960 — when were the roof, HVAC, electrical panel, plumbing, and water heater last replaced?
- Property tax is high relative to price — has the assessment been appealed recently, and will the sale trigger a re-assessment?
- Is there a deadline driving the sale (1031 exchange, divorce, estate, relocation)? That informs how much negotiation room exists.
- What's the average days-on-market for RENTAL listings here right now (not sales)? A rising rental-DOM trend means longer vacancies and softer asking-rent achievability than the comps imply.
- What's the recent tenant-quality profile in this submarket — average credit score on applications, eviction rate, late-payment / NSF rate, and stable-employment percentage? A property-management company in the area should have these aggregated.
- How much new for-sale + rental construction is in the pipeline within 1–3 miles? Heavy new supply typically softens prices + rents 12–24 months out; constrained supply supports both.
Investment metrics
- 1% rule
- 1.69% ✓
- Cap rate
- 11.71%
- Cash-on-cash
- 19.34%
- DSCR
- 1.86
- GRM
- 4.9
CMA / ARV
- ARV (on-the-fly)
- $493,884
- Comps found
- 1
Show comp detail 1 sale within ~0.75 mi
| Address | Dist | Beds/Ba | Sqft | Sold | Price | $/sf | Match |
|---|---|---|---|---|---|---|---|
| 19 Bristol Cir | 0.55mi | 4/3.0 | 1,713 (-7%) | 10mo | $461,500 | $269 | 47 |
Match score weights: distance 35% · size 25% · config 20% · recency 20%. Top-matched comps best support the ARV.
Projected returns pro-forma
10.0% appreciation · 3.0% rent growth · sell at horizon
- IRR
- 38.7%
- Equity multiple
- 3.98×
- Total profit
- $129,112
- Equity at exit
- $139,546
- IRR
- 33.4%
- Equity multiple
- 8.97×
- Total profit
- $345,631
- Equity at exit
- $300,937
Cash invested: $43,372 (down + closing). Projections, not guarantees.
Landlord ↔ Tenant lean methodology
- Overall (STATE)
- 15 Strongly Tenant-Friendly
- State New York
- 15 Strongly Tenant-Friendly · D+10
- County
- — inherits STATE
- City
- — inherits STATE
ZIP-level market 12775
- Home prices YoY
- 2.6%
- Active inventory
- 62
- Price-to-rent
- 4.9×
Monthly cashflow live
- Estimated rent
- $2,610 medium interval (Pro) →
- Mortgage (P&I)
- −$812
- Tax from tax record
- −$486 /mo · $5,834/yr
- Insurance
- −$65
- HOA
- −$0
- Vacancy / Maint / Mgmt
- −$548
- Net cashflow
- $699
Break-even live
UW: 25.0% down · 7.5% · 30yr · 1.5% tax · 5.0% vac · 8.0% maint · 8.0% mgmt
Financing live
Cash to close
- Down payment
- $38,725
- Closing costs
- $4,647
- Reserves months
- —
- Total cash needed
- —
Loan-product check · same deal, 3 products live
Conventional
25% down · 7.5% · 30yr
- Down + closing
- —
- Monthly P&I
- —
- Monthly cashflow
- —
- DSCR
- —
- Eligible?
- —
Personal DTI + credit; lowest rate.
DSCR
20% down · 8.5% · 30yr
- Down + closing
- —
- Monthly P&I
- —
- Monthly cashflow
- —
- DSCR
- —
- Eligible?
- —
No personal income docs; deal must DSCR.
Hard money
10% down · 12.0% · 12mo
- Down + closing
- —
- Monthly P&I
- —
- Monthly cashflow
- —
- DSCR
- —
- Eligible?
- —
Short-term bridge; refi at stabilization.
Listing history 23 events
-
2026-06-18days on market $154,900 Active 32 DOM
-
2026-06-17days on market $154,900 Active 31 DOM
-
2026-06-16days on market $154,900 Active 30 DOM
-
2026-06-15days on market $154,900 Active 29 DOM
-
2026-06-14days on market $154,900 Active 27 DOM
-
2026-06-10days on market $154,900 Active 24 DOM
-
2026-06-09days on market $154,900 Active 23 DOM
-
2026-06-08days on market $154,900 Active 22 DOM
-
2026-06-07days on market $154,900 Active 21 DOM
-
2026-06-03days on market $154,900 Active 17 DOM
-
2026-06-02days on market $154,900 Active 16 DOM
-
2026-06-01days on market $154,900 Active 15 DOM
-
2026-05-31days on market $154,900 Active 14 DOM
-
2026-05-31days on market $154,900 Active 13 DOM
-
2026-05-16$154,900 Active
-
2026-02-10$229,000 Active
-
2026-02-01historical
-
2025-08-27status Active
-
2025-06-12status Pending
-
2025-05-19status Active
-
2025-05-19historical
-
2024-11-20$229,000 Active
-
1988-03-08soldstatus $85,000
ⓘ Source: listings_history table (triggers on properties + properties_extension) + one-shot
backfill from property_details.listing_events for pre-trigger history.
Tax reassessment forecast NY · Partial reset (capped growth)
- Current annual tax
- $5,834 · $486/mo
- Projected year-2 tax
- $5,834 · $486/mo
- Expected delta
- $0/yr ($0/mo · 0.0%)
ⓘ Screening estimate from a state-policy table — verify with the county assessor before closing.
Climate risk First Street
- Flood 1/10 Low FEMA zone X (unshaded) · 0% chance over 30 yrs
- Wildfire 4/10 Moderate
- Heat 2/10 Low 7 d/yr ≥93°F today · 15 d/yr by 30 yrs out
- Wind 3/10 Moderate 5% chance of damaging wind over 30 yrs
- Air quality 2/10 Low 1 unhealthy d/yr today · 1 by 30 yrs out
Nearby sold comps map
Loading sold comps map…
Walkable amenities ~0.75 mi
Loading nearby amenities…
Taxation est. · year 1
- Rental income
- $31,324
- − Mortgage interest
- −$8,677
- − Property taxes
- −$5,834
- − Insurance
- −$774
- − Repairs & maintenance
- −$2,506
- − Management
- −$2,506
- − Depreciation
- −$4,506
- Taxable income
- $6,521
- Est. tax owed @ 24.0%
- −$1,565
- After-tax cash flow
- $6,825/yr
For passive investors: Depreciation is non-cash, so a rental often shows a tax loss while cash-flowing — sheltering income. Rental losses are passive: they offset passive income freely, and up to $25,000/yr can offset ordinary (W-2) income if you actively participate and your MAGI is under $100k (phasing out to $0 by $150k); unused losses carry forward. On sale, claimed depreciation is recaptured at up to 25%, and gains may owe capital-gains tax (a 1031 exchange can defer both). Figures are a year-1 estimate at your 24.0% rate — not tax advice; consult a CPA.
Schools (NCES district)
- District
- Monticello Central School District
- NCES district ID
- 3619740
- Math proficiency
- 29% ▼ -4.00%
- Reading proficiency
- 30% ▼ -2.00%
- Median HH income
- $44,696
- Composite
- 25.28/100
- National rank
- #7491
- State rank
- #577 of 590 in NY
Livability — Rock Hill
- Score
- 69/100
- State rank
- #478
- US rank
- #8452
Category grades
Schools grade is shown separately in the Schools card above.
Census & demographics
- Census place
- Rock Hill, NY
- City population
- 2,661
- Population (ZIP)
- 2,661
Population outlook (Sullivan County) Hauer SSP2
- Today (2025)
- 68,974 people
- By 2030
- 65,609 · -4.9%
- By 2040
- 58,878 · -14.6%
- By 2050
- 52,500 · -23.9%
- By 2075
- 39,941 · -42.1%
- By 2100
- 28,880 · -58.1%
Race, ethnicity, and origin ACS 2023
- Neighborhood character
- Predominantly White (68%)
- Race & ethnicity
- White 68% Hispanic / Latino 20% Two or more races 9% Black 5% Asian 4%
- Hispanic origin (detail)
- Puerto Rican 5%
- Common ancestry
- Romanian 5% Italian 4% Scotch-Irish 4%
- Foreign-born
- 17% · Canada, Jamaica
- Languages at home
- 79% English-only · Spanish 16% Other Indo-European 3% Russian/Polish/Slavic 2%
Political lean MEDSL · Sullivan
- 2024 margin
- R (+16.7) · D 41.6% · R 58.4%
- 2008→2024 swing
- -26.2pp toward R · 2008: 9.5pp · 2024: -16.7pp
- All cycles
- 2024: R+16.7 2020: R+9.2 2016: R+13.7 2012: D+10.4 2008: D+9.5
Not yet ingested
- Civics
- —
Market trends
- HPI YoY
- ▲ 11.12%
- Current HPI
- 437.7751
- Rent YoY
- —
- Metro
- —
- State GDP YoY
- ▲ 2.60%
- F500 in state
- 92
Industry mix (Fortune 500 HQ in NY)
| Industry | F500 HQs | Revenue |
|---|---|---|
| Financial Services | 10 | $950B |
|
||
| Consumer Goods | 9 | $162B |
|
||
| Insurance | 4 | $225B |
|
||
| Telecommunications | 2 | $144B |
|
||
| Pharmaceuticals | 2 | $112B |
|
||
| Media / Entertainment | 2 | $69B |
|
||
Price history
+82.2% since first listed9 events — show timeline
- 2026-05-16 Listed $154,900 OneKey® MLS as Distributed by MLS Grid
- 2026-02-10 Listed $229,000 OneKey® MLS as Distributed by MLS Grid
- 2026-02-01 Listing Removed — OneKey® MLS as Distributed by MLS Grid
- 2025-08-27 Relisted — OneKey® MLS as Distributed by MLS Grid
- 2025-06-12 Pending — OneKey® MLS as Distributed by MLS Grid
- 2025-05-19 Relisted — OneKey® MLS as Distributed by MLS Grid
- 2025-05-19 Listing Removed — OneKey® MLS as Distributed by MLS Grid
- 2024-11-20 Listed $229,000 OneKey® MLS as Distributed by MLS Grid
- 1988-03-08 Sold (Public Records) $85,000 Public Records
Property tax history
+0.4%/yrLatest (2025): $5,834 · +3.3% YoY. Source: county tax records.
Cash-flow waterfall
monthlySold comps — $/sqft
last 12 mo · ≤1 miLoading sold comps…