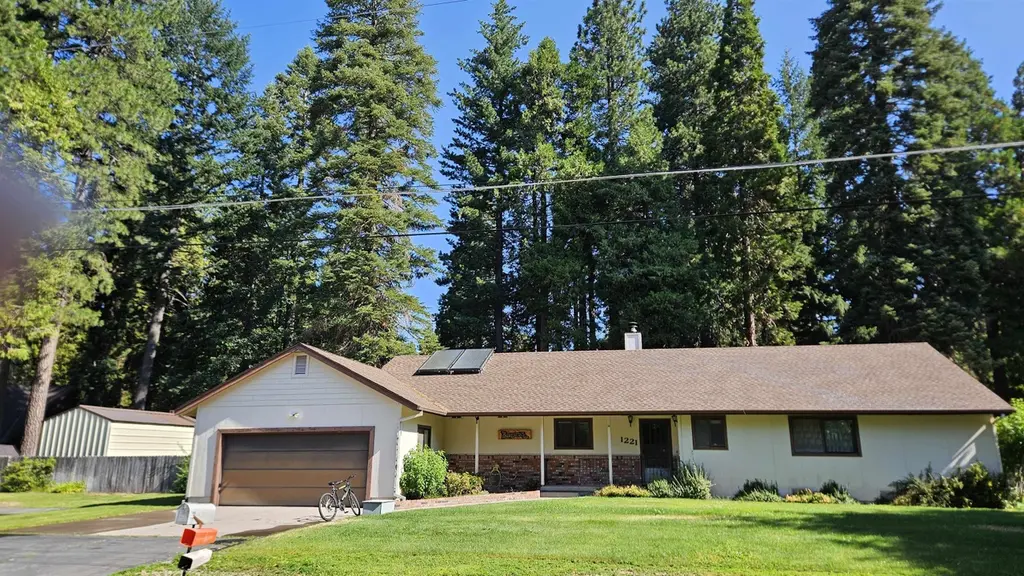
1221 Woodland Park Dr · Mount Shasta, CA
Flood risk 6/10 · Moderate
- FEMA flood zone
- X (unshaded)
- Chance of flooding over 30 yrs
- 0.7%
- Est. flood insurance / yr
- $507 – $1,088
Fire risk 6/10 · Moderate
- Est. fire insurance / yr
- $659 – $1,223
Heat risk 4/10 · Minor
- Hot days now (above 91°F)
- 7 days/yr
- Hot days in 30 yrs
- 17 days/yr
Wind risk 1/10 · Minimal
- Chance of severe wind over 30 yrs
- —
Air-quality risk 10/10 · Severe
- Unhealthy air days now
- 34 days/yr
- Unhealthy air days in 30 yrs
- 34 days/yr
Risk factors via First Street. Map © Google.
Why this score? — see what drove the B+ grade
The composite is a weighted blend of 9 inputs, each scored 0–100. Each bar is that input's sub-score; the figure is the points it added to the 100-point composite (weight × sub-score).
- Cash flow +30.0/30.0
- ARV discount +15.0/15.0
- DSCR +10.0/10.0
- 1% rule +9.5/10.0
- Schools +3.6/10.0
- Livability +3.2/5.0
- Rent growth +2.5/5.0
- Condition / age +2.5/5.0
- Appreciation +0.0/10.0
$440,000
🖨 Deal sheet (PDF) 📄 Offer letter ✓ Due diligence
Listing remarks
Dated Family Home on beautiful . 8 acre parcel. Offering 3 bedrooms, 2.5 baths in 2187 sq ft. as noted by County records. Attached 2 car garage, plus detached 2 car garage/shop/barn, storage/ RV canopy, and wood/storage shed. Appliances included. Unsure if the built in microwave and oven work The clothes washer does not work. A new pump was installed in the well 3/17/2025. Large Schrader Woodstove located just where it should be in the heart of the home. The panty has a ridiculous amount of storage. Trustees are selling this property "as is", may need a new roof, however, no current evidence of leaking. Loads of paved off street parking. Gardening areas, and a small greenhouse in
Key facts
- 8 acre parcel
- Wood storage shed
- 0.8 acre lot
Tags
Property features AI
Exterior
- Parking: Attached garage; 4 garage spaces
- Home design: Single-family residence; One story
- Construction: Cement siding; Composition roof
- Exterior features: Garden; Patio; Workshop
Interior
- Kitchen: Dishwasher; Electric range; Refrigerator
- Flooring: Carpet; Vinyl
- Interior features: Central vacuum; Pantry; Living room fireplace
Neighborhood map
What this means for you Summary
Snapshot
- This is a 2-bed/2.5-bath single-family listed at $440k.
Deal economics
- At list price, monthly cash flow is $2k ($26k/yr) — positive.
- The deal already cash-flows at list — no discount required.
- Meets the 1% rule at list price ($6k rent vs $440k).
- Recommended offer: $427k (3.0% below list) — sets the bar for market timing.
- Cap rate 12.1% vs local median 4.1% in Mount Shasta — top-decile yield for the area; either an underpriced asset or a hidden risk that comps aren't pricing in. Stress-test before assuming the spread holds.
Location & tenants
- Location reads 64/100 on livability (#405 in CA) — a middle-class / working-renter tenant base. Strengths: health & safety A+; Watch: housing C-, employment D+, crime F.
- Siskiyou Union High (rural): math 25% / reading 55% proficiency, ranked #763 of 1,400 in CA (top 54%) — families likely to look elsewhere, expect single-tenant / working-renter base with shorter leases; only 12% free/reduced lunch — higher-income household profile.
- Zoned schools: Mt. Shasta Elementary (math 34% / reading 34%, grade F, #719 of 1,571 statewide, top 48%, 194 students, 51% FRL); Sisson (math 38% / reading 59%, grade C-, #109 of 498 statewide, top 22%, 270 students, 44% FRL); Mount Shasta High (math 15% / reading 64%, grade F, #520 of 1,170 statewide, top 45%, 266 students, 30% FRL) — zoned schools average 42% FRL vs 12% district-wide (30 pts higher); higher-poverty schools than district average — tighter screening recommended.
- Market conditions: 117 active listings in the ZIP; 2 comparable units currently listed for rent nearby; 50 units permitted in Siskiyou County in 2024 (0 in 5+ unit buildings).
Forward outlook
- Local home prices are declining (-3.0%/yr); year-one equity from $3k of loan paydown is wiped out by about $13k of value loss. Plan a longer hold.
- Siskiyou County population projected at -26% by 2050 — secular population decline; favor cash flow + early exit over multi-decade hold.
- At projected returns (-3.0% appreciation + 3.0% rent growth), your $123k cash investment doubles in ~6 years — after that, you're playing with house money.
Negotiation context
- It's been on market 52 days — a 3% lower offer ($427k) is reasonable based on typical stale-listing flexibility.
Risks & watch-outs
- Climate carrying-cost: major flood risk; major wildfire risk — expect insurance premiums to compound above CPI over the hold.
Questions for the listing agent
- It's been on market 52 days. Have you received any prior offers? Is the seller open to a 3% concession, seller financing, or rate buy-down credit?
- Is there a deadline driving the sale (1031 exchange, divorce, estate, relocation)? That informs how much negotiation room exists.
- Crime grade is F in this area — have there been break-ins, vandalism, or insurance claims at this property in the last 3 years? What carrier currently insures it and at what premium?
- What's the average days-on-market for RENTAL listings here right now (not sales)? A rising rental-DOM trend means longer vacancies and softer asking-rent achievability than the comps imply.
- What's the recent tenant-quality profile in this submarket — average credit score on applications, eviction rate, late-payment / NSF rate, and stable-employment percentage? A property-management company in the area should have these aggregated.
- How much new for-sale + rental construction is in the pipeline within 1–3 miles? Heavy new supply typically softens prices + rents 12–24 months out; constrained supply supports both.
Investment metrics
- 1% rule
- 1.45% ✓
- Cap rate
- 12.10%
- Cash-on-cash
- 20.73%
- DSCR
- 1.92
- GRM
- 5.7
CMA / ARV
- ARV (on-the-fly)
- $629,856
- Comps found
- 3
Show comp detail 3 sales within ~0.75 mi
| Address | Dist | Beds/Ba | Sqft | Sold | Price | $/sf | Match |
|---|---|---|---|---|---|---|---|
| 906 Woodland Park Dr | 0.13mi | 3/2.0 (+1) | 2,038 (-7%) | 10mo | $485,000 | $238 | 67 |
| 848 Mac Ln | 0.51mi | 2/2.5 | 1,858 (-15%) | 2mo | $675,000 | $363 | 50 |
| 902 Meadow Valley Dr | 0.44mi | 3/2.0 (+1) | 1,985 (-9%) | 10mo | $571,200 | $288 | 49 |
Match score weights: distance 35% · size 25% · config 20% · recency 20%. Top-matched comps best support the ARV.
Projected returns pro-forma
-3.0% appreciation · 3.0% rent growth · sell at horizon
- IRR
- 13.1%
- Equity multiple
- 1.52×
- Total profit
- $64,305
- Equity at exit
- $65,605
- IRR
- 22.0%
- Equity multiple
- 2.87×
- Total profit
- $230,673
- Equity at exit
- $38,043
Cash invested: $123,200 (down + closing). Projections, not guarantees.
Landlord ↔ Tenant lean methodology
- Overall (STATE)
- 18 Strongly Tenant-Friendly
- State California
- 18 Strongly Tenant-Friendly · D+13
- County
- — inherits STATE
- City
- — inherits STATE
ZIP-level market 96067
- Active inventory
- 117
- Price-to-rent
- 5.7×
Monthly cashflow live
- Estimated rent
- $6,394 medium interval (Pro) →
- Mortgage (P&I)
- −$2,307
- Tax from tax record
- −$432 /mo · $5,182/yr
- Insurance
- −$183
- HOA
- −$0
- Vacancy / Maint / Mgmt
- −$1,343
- Net cashflow
- $2,129
Break-even live
Sensitivity live
| Price | -10% $2,378 | -5% $2,253 | +0% $2,129 | +5% $2,004 | +10% $1,880 |
|---|---|---|---|---|---|
| Rent | -10% $1,624 | -5% $1,876 | +0% $2,129 | +5% $2,381 | +10% $2,634 |
| Rate | -1.0pp $2,350 | -0.5pp $2,241 | base $2,129 | +0.5pp $2,015 | +1.0pp $1,899 |
UW: 25.0% down · 7.5% · 30yr · 1.5% tax · 5.0% vac · 8.0% maint · 8.0% mgmt
Financing live
Cash to close
- Down payment
- $110,000
- Closing costs
- $13,200
- Reserves months
- —
- Total cash needed
- —
Loan-product check · same deal, 3 products live
Conventional
25% down · 7.5% · 30yr
- Down + closing
- —
- Monthly P&I
- —
- Monthly cashflow
- —
- DSCR
- —
- Eligible?
- —
Personal DTI + credit; lowest rate.
DSCR
20% down · 8.5% · 30yr
- Down + closing
- —
- Monthly P&I
- —
- Monthly cashflow
- —
- DSCR
- —
- Eligible?
- —
No personal income docs; deal must DSCR.
Hard money
10% down · 12.0% · 12mo
- Down + closing
- —
- Monthly P&I
- —
- Monthly cashflow
- —
- DSCR
- —
- Eligible?
- —
Short-term bridge; refi at stabilization.
Rent comps 2 comps
| Address | Beds | Baths | Sqft | Rent | $/sqft | DOM | Units | Dist |
|---|---|---|---|---|---|---|---|---|
| 700 N Old Stage Rd Mount Shasta, CA | 3.0 | 2.0 | 2527 | $6,750 | $2.67 | 15d | 1 | 0.68mi |
| 940 Douglas Ln Mount Shasta, CA | 3.0 | 3.0 | 2526 | $6,000 | $2.38 | 22d | 1 | 0.75mi |
Listing history 3 events
-
2026-05-19status Pending
-
2026-05-08price $440,000
-
2026-03-28$480,000 Active
ⓘ Source: listings_history table (triggers on properties + properties_extension) + one-shot
backfill from property_details.listing_events for pre-trigger history.
Tax reassessment forecast CA · Resets to sale price
- Current annual tax
- $5,182 · $432/mo
- Projected year-2 tax
- $5,182 · $432/mo
- Expected delta
- $0/yr ($0/mo · 0.0%)
ⓘ Screening estimate from a state-policy table — verify with the county assessor before closing.
Climate risk First Street
- Flood 6/10 Major FEMA zone X (unshaded) · 70% chance over 30 yrs
- Wildfire 6/10 Major
- Heat 4/10 Moderate 7 d/yr ≥91°F today · 17 d/yr by 30 yrs out
- Wind 1/10 Low
- Air quality 10/10 Extreme 34 unhealthy d/yr today · 34 by 30 yrs out
Nearby sold comps map
Loading sold comps map…
Walkable amenities ~0.75 mi
Loading nearby amenities…
Taxation est. · year 1
- Rental income
- $76,729
- − Mortgage interest
- −$24,647
- − Property taxes
- −$5,182
- − Insurance
- −$2,200
- − Repairs & maintenance
- −$6,138
- − Management
- −$6,138
- − Depreciation
- −$12,800
- Taxable income
- $19,623
- Est. tax owed @ 24.0%
- −$4,710
- After-tax cash flow
- $20,835/yr
For passive investors: Depreciation is non-cash, so a rental often shows a tax loss while cash-flowing — sheltering income. Rental losses are passive: they offset passive income freely, and up to $25,000/yr can offset ordinary (W-2) income if you actively participate and your MAGI is under $100k (phasing out to $0 by $150k); unused losses carry forward. On sale, claimed depreciation is recaptured at up to 25%, and gains may owe capital-gains tax (a 1031 exchange can defer both). Figures are a year-1 estimate at your 24.0% rate — not tax advice; consult a CPA.
Schools (NCES district)
- District
- Siskiyou Union High
- NCES district ID
- 0636940
- Math proficiency
- 25% ▲ 5.00%
- Reading proficiency
- 55% ▲ 5.00%
- Median HH income
- $39,293
- Composite
- 35.84/100
- National rank
- #9605
- State rank
- #763 of 1400 in CA
Livability — Mount Shasta
- Score
- 64/100
- State rank
- #405
- US rank
- #13833
Category grades
Schools grade is shown separately in the Schools card above.
Census & demographics
- City population
- 7,800
- Population (ZIP)
- 7,800
Population outlook (Siskiyou County) Hauer SSP2
- Today (2025)
- 39,337 people
- By 2030
- 36,930 · -6.1%
- By 2040
- 32,367 · -17.7%
- By 2050
- 29,030 · -26.2%
- By 2075
- 23,534 · -40.2%
- By 2100
- 19,312 · -50.9%
Race, ethnicity, and origin ACS 2023
- Neighborhood character
- Predominantly White (82%)
- Race & ethnicity
- White 82% Hispanic / Latino 9% Two or more races 9% Pacific Islander 2% Asian 2%
- Hispanic origin (detail)
- Mexican 5%
- Common ancestry
- Lithuanian 4% Russian 2% Italian 2%
- Foreign-born
- 9% · Canada, China
- Languages at home
- 90% English-only · Spanish 6% Other Asian/Pacific 2% Chinese 1%
Political lean MEDSL · Siskiyou
- 2024 margin
- R (+19.2) · D 38.8% · R 58.0% · Other 3.2%
- 2008→2024 swing
- -8.8pp toward R · 2008: -10.4pp · 2024: -19.2pp
- All cycles
- 2024: R+19.2 2020: R+15.8 2016: R+20.7 2012: R+15.6 2008: R+10.4
Not yet ingested
- Civics
- —
Market trends
- HPI YoY
- ▼ -227.87%
- Current HPI
- 115.4662
- Rent YoY
- —
- Metro
- —
- State GDP YoY
- ▲ 3.21%
- F500 in state
- 116
Industry mix (Fortune 500 HQ in CA)
| Industry | F500 HQs | Revenue |
|---|---|---|
| Technology | 27 | $1,492B |
|
||
| Financial Services | 3 | $174B |
|
||
| Retail | 3 | $44B |
|
||
| Insurance | 3 | $26B |
|
||
| Media / Entertainment | 2 | $115B |
|
||
| Pharmaceuticals / Biotech | 2 | $62B |
|
||
Price history
-8.3% since first listed3 events — show timeline
- 2026-05-19 Pending — SMLS
- 2026-05-08 Price Changed $440,000 SMLS
- 2026-03-28 Listed $480,000 SMLS
Property tax history
+7.5%/yrLatest (2025): $5,182 · +88.9% YoY. Source: county tax records.
Cash-flow waterfall
monthlySold comps — $/sqft
last 12 mo · ≤1 miLoading sold comps…