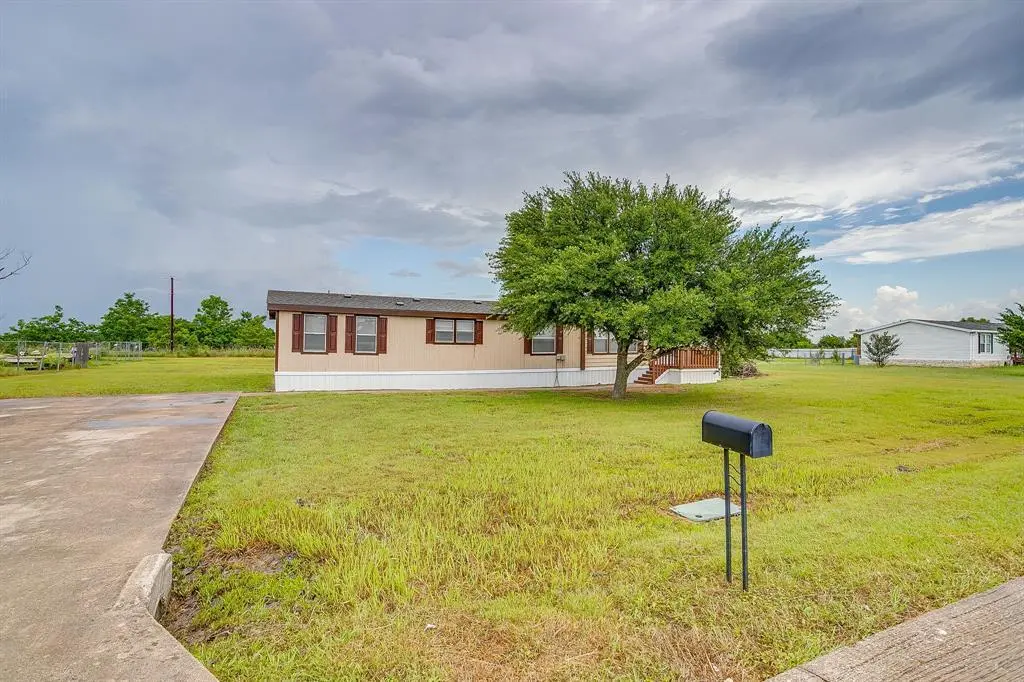
150 Hearne Ln · Red Oak, TX
Flood risk 1/10 · Minimal
- FEMA flood zone
- X (unshaded)
- Chance of flooding over 30 yrs
- 0.0%
- Est. flood insurance / yr
- $507 – $1,088
Fire risk 4/10 · Minor
- Est. fire insurance / yr
- $1,222 – $2,270
Heat risk 7/10 · Major
- Hot days now (above 110°F)
- 7 days/yr
- Hot days in 30 yrs
- 24 days/yr
Wind risk 6/10 · Moderate
- Chance of severe wind over 30 yrs
- 27.0%
Air-quality risk 2/10 · Minimal
- Unhealthy air days now
- 1 days/yr
- Unhealthy air days in 30 yrs
- 1 days/yr
Risk factors via First Street. Map © Google.
Why this score? — see what drove the C grade
The composite is a weighted blend of 9 inputs, each scored 0–100. Each bar is that input's sub-score; the figure is the points it added to the 100-point composite (weight × sub-score).
- Cash flow +20.4/30.0
- ARV discount +15.0/15.0
- DSCR +6.5/10.0
- 1% rule +5.4/10.0
- Livability +3.5/5.0
- Rent growth +3.2/5.0
- Schools +2.5/10.0
- Condition / age +2.5/5.0
- Appreciation +0.0/10.0
$239,900
🖨 Deal sheet (PDF) 📄 Offer letter ✓ Due diligence
Listing remarks MLS
Wide Open spaces are all yours with this 4 BR, 2 bath home Features include Island in Spacious Kitchen with builtin desk with ample Cabinet & Counter space * Roomy Master Bath with Double Sink, Garden Tub, Separate Shower * enjoy the Wood Burning Fireplace Full Sized Guest Bath too Buyer to verify all information contained herein prior to closing. No BLIND OFFERS *
Key facts
- Custom wood decks
- Brand new roof
- New flooring
Tags
Property features AI
Finance
- Other: Lot approximately 0.81 acre (150 x 228 x 150 x 234); Deed restrictions apply; Possession at closing/funding
- Financial info: Financing accepted: Cash, Conventional, FHA, USDA Loan, VA Loan
- HOA & community: No association
Exterior
- Parking: Open concrete parking
- Utilities: Aerobic septic; Co-op water with individual water meter; Electricity available and connected; Asphalt access; Located outside city limits
- Home design: Single-story mobile home (residential); One level; Preowned (built in 2002)
- Construction: Siding exterior; Composition roof; Pillar/post/pier foundation; Year built 2002
- Exterior features: Deck
Interior
- Kitchen: Dishwasher; Electric range; Kitchen island; Eat-in kitchen
- Bedrooms: 4 bedrooms (all on the main level); Primary bedroom with ensuite bath, garden tub, separate shower, dual sinks and walk-in closet; Other bedrooms feature split-bedroom layout; one bedroom includes a walk-in closet
- Flooring: Carpet; Vinyl
- Bathrooms: 2 full bathrooms
- Heating & cooling: Central heating; Electric heating; Fireplace provides supplemental heat; Central air conditioning; Ceiling fans
- Interior features: Open floorplan with vaulted ceilings; Kitchen island; Eat-in kitchen; Window coverings
- Laundry & utility: Washer hookup; Electric dryer hookup; Utility room
Neighborhood map
What this means for you Summary
Snapshot
- This is a 4-bed/2.0-bath manufactured listed at $240k.
Deal economics
- At list price, monthly cash flow is $311 ($4k/yr) — positive.
- The deal already cash-flows at list — no discount required.
- Meets the 1% rule at list price ($3k rent vs $240k).
- Cap rate 7.8% vs local median 3.9% in Red Oak — top-decile yield for the area; either an underpriced asset or a hidden risk that comps aren't pricing in. Stress-test before assuming the spread holds.
Location & tenants
- Location reads 69/100 on livability (#435 in TX) — a middle-class / working-renter tenant base. Strengths: employment A+, housing A+, cost of living A; Watch: amenities F, commute F.
- Ferris ISD (rural): math 28% / reading 29% proficiency, ranked #634 of 826 in TX (top 77%) — low school quality limits family demand, transient renter base, plan for 1-2y turnover; 67% free/reduced lunch — lower-income household profile, screen leases tightly.
- Zoned schools: Hazel Ingram El (322 students, 88% FRL); Ferris J H (math 22% / reading 23%, grade F, #1,341 of 1,662 statewide, top 82%, 590 students, 79% FRL); Ferris H S (math 22% / reading 38%, grade F, #1,096 of 1,632 statewide, top 68%, 821 students, 76% FRL).
- Market conditions: Rents rising (+3.0%/yr); 578 active listings in the ZIP; solid renter incomes; 3,016 units permitted in Ellis County in 2024 (20 in 5+ unit buildings).
Forward outlook
- Local home prices are declining (-3.0%/yr); year-one equity from $2k of loan paydown is wiped out by about $7k of value loss. Plan a longer hold.
- Ellis County population projected at +36% by 2050 — long-run rental-demand tailwind backs the buy-and-hold thesis.
Negotiation context
- Only 8 days on market — expect competitive offers; lowballing is unlikely to land.
- 3 sale attempts since 11y ago with the ask held roughly flat each time — persistent listings suggest the price (not the market) is what's stuck; bring a comps-based counter.
Risks & watch-outs
- Climate carrying-cost: major wind risk, 27% chance of damaging wind over 30y; extreme-heat days projected 7→24/yr by 2055 (HVAC capex compounding) — expect insurance premiums to compound above CPI over the hold.
Questions for the listing agent
- Is there a deadline driving the sale (1031 exchange, divorce, estate, relocation)? That informs how much negotiation room exists.
- Schools are D-rated, which usually means shorter tenancies and higher turnover. Who's the typical renter profile here, and what's been the actual vacancy rate?
- What's the average days-on-market for RENTAL listings here right now (not sales)? A rising rental-DOM trend means longer vacancies and softer asking-rent achievability than the comps imply.
- What's the recent tenant-quality profile in this submarket — average credit score on applications, eviction rate, late-payment / NSF rate, and stable-employment percentage? A property-management company in the area should have these aggregated.
- How much new for-sale + rental construction is in the pipeline within 1–3 miles? Heavy new supply typically softens prices + rents 12–24 months out; constrained supply supports both.
Investment metrics
- 1% rule
- 1.04% ✓
- Cap rate
- 7.85%
- Cash-on-cash
- 5.55%
- DSCR
- 1.25
- GRM
- 8.0
CMA / ARV
- ARV (on-the-fly)
- $294,336
- Comps found
- 3
Show comp detail 3 sales within ~0.75 mi
| Address | Dist | Beds/Ba | Sqft | Sold | Price | $/sf | Match |
|---|---|---|---|---|---|---|---|
| 3144 Shady Creek Cir | 0.38mi | 3/2.0 (-1) | 2,160 (+7%) | 1mo | $270,000 | $125 | 65 |
| 224 Hearne Ln | 0.27mi | 4/3.0 | 1,920 (-5%) | 19mo | $297,500 | $155 | 59 |
| 236 Hearne Ln | 0.33mi | 3/2.0 (-1) | 1,920 (-5%) | 23mo | $279,900 | $146 | 52 |
Match score weights: distance 35% · size 25% · config 20% · recency 20%. Top-matched comps best support the ARV.
Projected returns pro-forma
-3.0% appreciation · 2.99% rent growth · sell at horizon
- IRR
- -7.7%
- Equity multiple
- 0.72×
- Total profit
- $-19,067
- Equity at exit
- $35,770
- IRR
- 1.9%
- Equity multiple
- 1.13×
- Total profit
- $8,950
- Equity at exit
- $20,742
Cash invested: $67,172 (down + closing). Projections, not guarantees.
Landlord ↔ Tenant lean methodology
- Overall (STATE)
- 87 Strongly Landlord-Friendly
- State Texas
- 87 Strongly Landlord-Friendly · R+5
- County
- — inherits STATE
- City
- — inherits STATE
ZIP-level market 75154
- Home prices YoY
- -18.5%
- Rents YoY
- 3.0%
- Active inventory
- 578
- Price-to-rent
- 8.0×
Monthly cashflow live
- Estimated rent
- $2,503 medium interval (Pro) →
- Mortgage (P&I)
- −$1,258
- Tax from tax record
- −$308 /mo · $3,702/yr
- Insurance
- −$100
- HOA
- −$0
- Vacancy / Maint / Mgmt
- −$526
- Net cashflow
- $311
Break-even live
Sensitivity live
| Price | -10% $447 | -5% $379 | +0% $311 | +5% $243 | +10% $175 |
|---|---|---|---|---|---|
| Rent | -10% $113 | -5% $212 | +0% $311 | +5% $410 | +10% $508 |
| Rate | -1.0pp $432 | -0.5pp $372 | base $311 | +0.5pp $249 | +1.0pp $185 |
UW: 25.0% down · 7.5% · 30yr · 1.5% tax · 5.0% vac · 8.0% maint · 8.0% mgmt
Financing live
Cash to close
- Down payment
- $59,975
- Closing costs
- $7,197
- Reserves months
- —
- Total cash needed
- —
Loan-product check · same deal, 3 products live
Conventional
25% down · 7.5% · 30yr
- Down + closing
- —
- Monthly P&I
- —
- Monthly cashflow
- —
- DSCR
- —
- Eligible?
- —
Personal DTI + credit; lowest rate.
DSCR
20% down · 8.5% · 30yr
- Down + closing
- —
- Monthly P&I
- —
- Monthly cashflow
- —
- DSCR
- —
- Eligible?
- —
No personal income docs; deal must DSCR.
Hard money
10% down · 12.0% · 12mo
- Down + closing
- —
- Monthly P&I
- —
- Monthly cashflow
- —
- DSCR
- —
- Eligible?
- —
Short-term bridge; refi at stabilization.
Listing history 6 events
-
2026-06-17status $239,900 Pending 8 DOM
-
2026-06-16days on market $239,900 Active Option Contract 8 DOM
-
2026-06-15days on market $239,900 Active Option Contract 7 DOM
-
2026-06-13statusdays on market $239,900 Active Option Contract 5 DOM
-
2026-06-08remarks 699-char remark
-
2026-06-08$239,900 Active 1 DOM
ⓘ Source: listings_history table (triggers on properties + properties_extension) + one-shot
backfill from property_details.listing_events for pre-trigger history.
Tax reassessment forecast TX · Resets to sale price
- Current annual tax
- $3,702 · $308/mo
- Projected year-2 tax
- $4,390 · $366/mo
- Expected delta
- +$688/yr (+$57/mo · 18.6%)
ⓘ Screening estimate from a state-policy table — verify with the county assessor before closing.
Climate risk First Street
- Flood 1/10 Low FEMA zone X (unshaded) · 0% chance over 30 yrs
- Wildfire 4/10 Moderate
- Heat 7/10 Severe 7 d/yr ≥110°F today · 24 d/yr by 30 yrs out
- Wind 6/10 Major 27% chance of damaging wind over 30 yrs
- Air quality 2/10 Low 1 unhealthy d/yr today · 1 by 30 yrs out
Nearby sold comps map
Loading sold comps map…
Walkable amenities ~0.75 mi
Loading nearby amenities…
Taxation est. · year 1
- Rental income
- $30,034
- − Mortgage interest
- −$13,438
- − Property taxes
- −$3,702
- − Insurance
- −$1,200
- − Repairs & maintenance
- −$2,403
- − Management
- −$2,403
- − Depreciation
- −$6,979
- Taxable loss
- −$90
- Est. tax savings @ 24.0%
- +$22
- After-tax cash flow
- $3,750/yr
For passive investors: Depreciation is non-cash, so a rental often shows a tax loss while cash-flowing — sheltering income. Rental losses are passive: they offset passive income freely, and up to $25,000/yr can offset ordinary (W-2) income if you actively participate and your MAGI is under $100k (phasing out to $0 by $150k); unused losses carry forward. On sale, claimed depreciation is recaptured at up to 25%, and gains may owe capital-gains tax (a 1031 exchange can defer both). Figures are a year-1 estimate at your 24.0% rate — not tax advice; consult a CPA.
Schools (NCES district)
- District
- Ferris ISD
- NCES district ID
- 4819170
- Math proficiency
- 28% ▼ -9.00%
- Reading proficiency
- 29% ▼ -3.00%
- Median HH income
- $53,468
- Composite
- 25.3/100
- National rank
- #7486
- State rank
- #634 of 826 in TX
Livability — Red Oak
- Score
- 69/100
- State rank
- #435
- US rank
- #8931
Category grades
Schools grade is shown separately in the Schools card above.
Census & demographics
- County
- Ellis County · 199,237 people
- City population
- 52,516
- Metro
- Dallas-Fort Worth-Arlington, TX
- Population (ZIP)
- 52,516
- Household income
- $100,388
- Rent vs Own
- Severe rent burden
- 1081.0
Population outlook (Ellis County) Hauer SSP2
- Today (2025)
- 194,556 people
- By 2030
- 209,679 · +7.8%
- By 2040
- 238,837 · +22.8%
- By 2050
- 265,451 · +36.4%
- By 2075
- 326,571 · +67.9%
- By 2100
- 362,156 · +86.1%
Race, ethnicity, and origin ACS 2023
- Neighborhood character
- Diverse neighborhood (Simpson 0.69)
- Race & ethnicity
- White 39% Black 30% Hispanic / Latino 27% Two or more races 12% Asian 1% Native American 1%
- Hispanic origin (detail)
- Mexican 25%
- Common ancestry
- Italian 2% Slovak 1%
- Foreign-born
- 9% · Canada, Jamaica
- Languages at home
- 80% English-only · Spanish 18%
Political lean MEDSL · Ellis
- 2024 margin
- Solid R (+31.1) · D 34.0% · R 65.1%
- 2008→2024 swing
- +11.2pp toward D · 2008: -42.2pp · 2024: -31.1pp
- All cycles
- 2024: R+31.1 2020: R+34.1 2016: R+45.4 2012: R+47.5 2008: R+42.2
Not yet ingested
- Civics
- —
Market trends
- HPI YoY
- ▼ -67.06%
- Current HPI
- 294.5836
- Rent YoY
- ▲ 2.99%
- Metro
- Dallas-Fort Worth-Arlington, TX
- State GDP YoY
- ▲ 3.95%
- F500 in state
- 110
Industry mix (Fortune 500 HQ in TX)
| Industry | F500 HQs | Revenue |
|---|---|---|
| Energy | 16 | $1,198B |
|
||
| Technology | 5 | $198B |
|
||
| Engineering / Construction | 4 | $72B |
|
||
| Energy Services | 3 | $60B |
|
||
| Utilities | 3 | $41B |
|
||
| Healthcare | 2 | $330B |
|
||
Price history
+399.8% since first listed10 events — show timeline
- 2026-06-08 Listed $239,900 NTREIS
- 2015-06-01 Sold (Public Records) — Public Records
- 2015-05-26 Sold (MLS) — NTREIS
- 2015-05-12 Pending — NTREIS
- 2015-05-12 Contingent — NTREIS
- 2015-04-24 Relisted — NTREIS
- 2015-04-13 Pending — NTREIS
- 2015-04-10 Contingent — NTREIS
- 2015-04-06 Listed $48,000 NTREIS
- 2002-08-07 Sold (Public Records) — Public Records
Property tax history
+4.7%/yrLatest (2025): $3,702 · +14.7% YoY. Source: county tax records.
Cash-flow waterfall
monthlySold comps — $/sqft
last 12 mo · ≤1 miLoading sold comps…