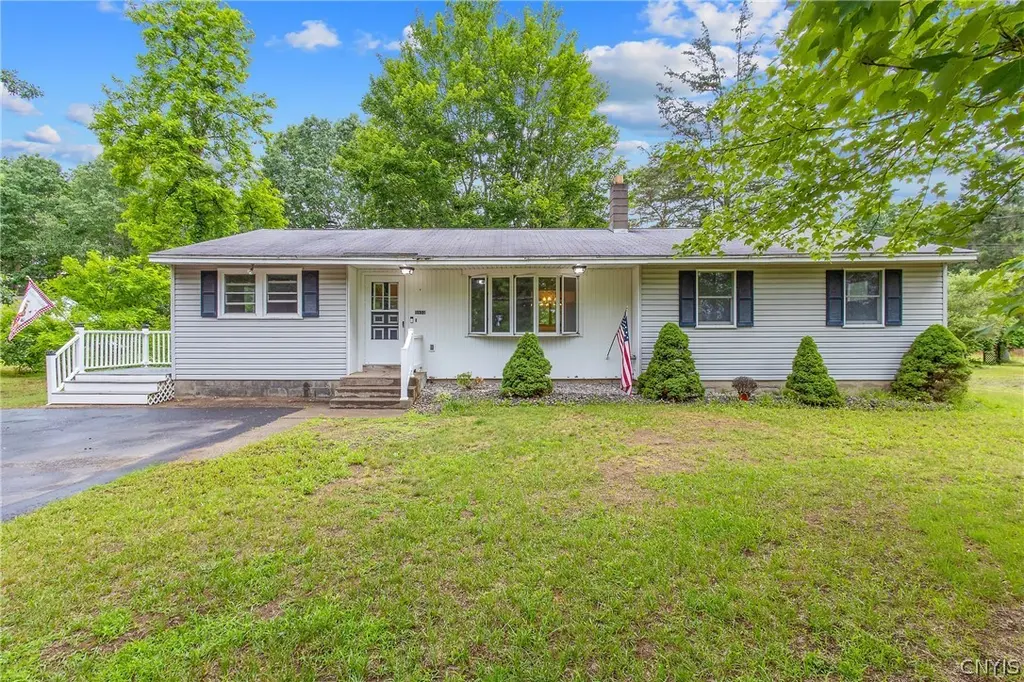
8953 Henry Clay Blvd · Sand Ridge, NY
Flood risk 1/10 · Minimal
- FEMA flood zone
- X (unshaded)
- Chance of flooding over 30 yrs
- 0.0%
- Est. flood insurance / yr
- $473 – $860
Fire risk 2/10 · Minimal
- Est. fire insurance / yr
- $691 – $1,283
Heat risk 2/10 · Minimal
- Hot days now (above 95°F)
- 7 days/yr
- Hot days in 30 yrs
- 16 days/yr
Wind risk 1/10 · Minimal
- Chance of severe wind over 30 yrs
- —
Air-quality risk 2/10 · Minimal
- Unhealthy air days now
- 1 days/yr
- Unhealthy air days in 30 yrs
- 1 days/yr
Risk factors via First Street. Map © Google.
Why this score? — see what drove the D grade
The composite is a weighted blend of 9 inputs, each scored 0–100. Each bar is that input's sub-score; the figure is the points it added to the 100-point composite (weight × sub-score).
- Cash flow +13.7/30.0
- ARV discount +7.5/15.0
- Schools +4.2/10.0
- 1% rule +4.1/10.0
- DSCR +4.1/10.0
- Livability +3.1/5.0
- Rent growth +2.5/5.0
- Condition / age +2.5/5.0
- Appreciation +0.0/10.0
$269,000
🖨 Deal sheet (PDF) 📄 Offer letter ✓ Due diligence
Listing remarks
First time offered in decades! This charming 1,458 sq. ft. four-bedroom ranch sits on a beautiful one-acre lot and has been lovingly maintained by the same owner since the early 1960s. Featuring hardwood floors throughout, an updated kitchen, one-and-a-half baths, and a cozy standalone fireplace, this home blends classic character with modern updates. The spacious layout offers plenty of room to live, work, and entertain both inside and out. Located in a highly desirable area in Clay with easy access to shopping, restaurants, and major conveniences, but in the country, this is the type of property buyers wait for. Opportunities like this don't come along often.
Key facts
- One acre lot
- Updated kitchen
- Hardwood floors
Tags
Property features AI
Exterior
- Parking: Detached garage with electricity; 1 garage space
- Utilities: Cable available; Public water connected; Septic tank
- Home design: Single-story home; Resale property; Entry level: main; City street frontage; Rectangular residential lot (approximately 1 acre, dimensions 95 x 455)
- Construction: Vinyl siding; Asphalt shingle roof; Block foundation; PEX plumbing; Existing (previously built)
- Exterior features: Blacktop driveway; Deck; Open porch
Interior
- Kitchen: Dishwasher; Electric oven; Electric range; Refrigerator; Eat-in kitchen with solid surface counters
- Bedrooms: 4 bedrooms on the main level
- Flooring: Carpet; Hardwood; Luxury vinyl; Varied flooring
- Bathrooms: 1 full bathroom; 1 half bathroom; 2 main-level bathrooms
- Heating & cooling: Forced air heating powered by oil and electric; Central air conditioning
- Interior features: Ceiling fan(s); Den; Eat-in kitchen; Separate/formal living room; Solid surface counters; Bedroom on main level; Full basement with sump pump; 1 fireplace (family/other)
- Laundry & utility: Laundry in basement; Electric water heater
Neighborhood map
What this means for you Summary
Snapshot
- This is a 4-bed/1.5-bath single-family listed at $269k.
Deal economics
- At list price, monthly cash flow is $18 ($211/yr) — positive.
- The deal already cash-flows at list — no discount required.
- To meet the 1% rule (rent ≥ 1% of price), the offer needs to be $245k (9.1% below list).
- Recommended offer: $245k (9.1% below list) — sets the bar for 1% rule.
- Cap rate 6.4% vs local median 3.4% in Sand Ridge — top-decile yield for the area; either an underpriced asset or a hidden risk that comps aren't pricing in. Stress-test before assuming the spread holds.
Location & tenants
- Location reads 61/100 on livability (#926 in NY) — a middle-class / working-renter tenant base. Strengths: housing A+, cost of living A, crime A-; Watch: employment D+, schools F, amenities F.
- North Syracuse Central School District (suburban): math 45% / reading 50% proficiency, ranked #402 of 590 in NY (top 68%) — families likely to look elsewhere, expect single-tenant / working-renter base with shorter leases.
- Market conditions: 62 active listings in the ZIP; 616 units permitted in Onondaga County in 2024 (256 in 5+ unit buildings).
Forward outlook
- Local home prices are declining (-3.0%/yr); year-one equity from $2k of loan paydown is wiped out by about $8k of value loss. Plan a longer hold.
- Onondaga County population projected to shrink 9% by 2050 — rents likely to lag national; underwrite the cash flow, not the appreciation.
Negotiation context
- Only 2 days on market — expect competitive offers; lowballing is unlikely to land.
Questions for the listing agent
- Built in 1961 — when were the roof, HVAC, electrical panel, plumbing, and water heater last replaced?
- Is there a deadline driving the sale (1031 exchange, divorce, estate, relocation)? That informs how much negotiation room exists.
- Schools are F-rated, which usually means shorter tenancies and higher turnover. Who's the typical renter profile here, and what's been the actual vacancy rate?
- The area grade is low — what's the realistic commute time and amenity access for the typical tenant pool here? Any planned neighborhood developments (good or bad) we should know about?
- What's the average days-on-market for RENTAL listings here right now (not sales)? A rising rental-DOM trend means longer vacancies and softer asking-rent achievability than the comps imply.
- What's the recent tenant-quality profile in this submarket — average credit score on applications, eviction rate, late-payment / NSF rate, and stable-employment percentage? A property-management company in the area should have these aggregated.
- How much new for-sale + rental construction is in the pipeline within 1–3 miles? Heavy new supply typically softens prices + rents 12–24 months out; constrained supply supports both.
Investment metrics
- 1% rule
- 0.91% ✗
- Cap rate
- 6.37%
- Cash-on-cash
- 0.28%
- DSCR
- 1.01
- GRM
- 9.2
CMA / ARV
No comps found within radius.
Projected returns pro-forma
-3.0% appreciation · 3.0% rent growth · sell at horizon
- IRR
- -15.8%
- Equity multiple
- 0.44×
- Total profit
- $-42,398
- Equity at exit
- $40,109
- IRR
- -7.4%
- Equity multiple
- 0.53×
- Total profit
- $-35,188
- Equity at exit
- $23,258
Cash invested: $75,320 (down + closing). Projections, not guarantees.
Landlord ↔ Tenant lean methodology
- Overall (STATE)
- 15 Strongly Tenant-Friendly
- State New York
- 15 Strongly Tenant-Friendly · D+10
- County
- — inherits STATE
- City
- — inherits STATE
ZIP-level market 13041
- Active inventory
- 62
- Price-to-rent
- 9.2×
Monthly cashflow live
- Estimated rent
- $2,445 medium interval (Pro) →
- Mortgage (P&I)
- −$1,411
- Tax from tax record
- −$391 /mo · $4,696/yr
- Insurance
- −$112
- HOA
- −$0
- Vacancy / Maint / Mgmt
- −$513
- Net cashflow
- $18
Break-even live
Sensitivity live
| Price | -10% $170 | -5% $94 | +0% $18 | +5% $-59 | +10% $-135 |
|---|---|---|---|---|---|
| Rent | -10% $-176 | -5% $-79 | +0% $18 | +5% $114 | +10% $211 |
| Rate | -1.0pp $153 | -0.5pp $86 | base $18 | +0.5pp $-52 | +1.0pp $-123 |
UW: 25.0% down · 7.5% · 30yr · 1.5% tax · 5.0% vac · 8.0% maint · 8.0% mgmt
Financing live
Cash to close
- Down payment
- $67,250
- Closing costs
- $8,070
- Reserves months
- —
- Total cash needed
- —
Loan-product check · same deal, 3 products live
Conventional
25% down · 7.5% · 30yr
- Down + closing
- —
- Monthly P&I
- —
- Monthly cashflow
- —
- DSCR
- —
- Eligible?
- —
Personal DTI + credit; lowest rate.
DSCR
20% down · 8.5% · 30yr
- Down + closing
- —
- Monthly P&I
- —
- Monthly cashflow
- —
- DSCR
- —
- Eligible?
- —
No personal income docs; deal must DSCR.
Hard money
10% down · 12.0% · 12mo
- Down + closing
- —
- Monthly P&I
- —
- Monthly cashflow
- —
- DSCR
- —
- Eligible?
- —
Short-term bridge; refi at stabilization.
Listing history 2 events
-
2026-06-21remarks 669-char remark
-
2026-06-21$269,000 Active 2 DOM
ⓘ Source: listings_history table (triggers on properties + properties_extension) + one-shot
backfill from property_details.listing_events for pre-trigger history.
Tax reassessment forecast NY · Partial reset (capped growth)
- Current annual tax
- $4,696 · $391/mo
- Projected year-2 tax
- $4,696 · $391/mo
- Expected delta
- $0/yr ($0/mo · 0.0%)
ⓘ Screening estimate from a state-policy table — verify with the county assessor before closing.
Climate risk First Street
- Flood 1/10 Low FEMA zone X (unshaded) · 0% chance over 30 yrs
- Wildfire 2/10 Low
- Heat 2/10 Low 7 d/yr ≥95°F today · 16 d/yr by 30 yrs out
- Wind 1/10 Low
- Air quality 2/10 Low 1 unhealthy d/yr today · 1 by 30 yrs out
Nearby sold comps map
Loading sold comps map…
Walkable amenities ~0.75 mi
Loading nearby amenities…
Taxation est. · year 1
- Rental income
- $29,342
- − Mortgage interest
- −$15,068
- − Property taxes
- −$4,696
- − Insurance
- −$1,345
- − Repairs & maintenance
- −$2,347
- − Management
- −$2,347
- − Depreciation
- −$7,825
- Taxable loss
- −$4,287
- Est. tax savings @ 24.0%
- +$1,029
- After-tax cash flow
- $1,240/yr
For passive investors: Depreciation is non-cash, so a rental often shows a tax loss while cash-flowing — sheltering income. Rental losses are passive: they offset passive income freely, and up to $25,000/yr can offset ordinary (W-2) income if you actively participate and your MAGI is under $100k (phasing out to $0 by $150k); unused losses carry forward. On sale, claimed depreciation is recaptured at up to 25%, and gains may owe capital-gains tax (a 1031 exchange can defer both). Figures are a year-1 estimate at your 24.0% rate — not tax advice; consult a CPA.
Schools (NCES district)
- District
- North Syracuse Central School District
- NCES district ID
- 3621210
- Math proficiency
- 45% ▼ -9.00%
- Reading proficiency
- 50% ▲ 1.00%
- Median HH income
- $62,904
- Composite
- 41.93/100
- National rank
- #3356
- State rank
- #402 of 590 in NY
Livability — Sand Ridge
- Score
- 61/100
- State rank
- #926
- US rank
- #18073
Category grades
Schools grade is shown separately in the Schools card above.
Census & demographics
- Population (ZIP)
- 12,094
Population outlook (Onondaga County) Hauer SSP2
- Today (2025)
- 467,894 people
- By 2030
- 463,381 · -1.0%
- By 2040
- 447,697 · -4.3%
- By 2050
- 426,399 · -8.9%
- By 2075
- 373,661 · -20.1%
- By 2100
- 307,967 · -34.2%
Race, ethnicity, and origin ACS 2023
- Neighborhood character
- Predominantly White (83%)
- Race & ethnicity
- White 83% Two or more races 10% Black 3% Asian 3% Hispanic / Latino 2%
- Common ancestry
- Romanian 7% Lithuanian 3% Slovak 2%
- Foreign-born
- 8% · Canada, China, Vietnam
- Languages at home
- 89% English-only · Other Indo-European 4% Tagalog/Filipino 3% French/Haitian/Cajun 1%
Political lean MEDSL · Onondaga
- 2024 margin
- D (+17.3) · D 58.6% · R 41.4%
- 2008→2024 swing
- -3.0pp toward R · 2008: 20.3pp · 2024: 17.3pp
- All cycles
- 2024: D+17.3 2020: D+20.6 2016: D+12.8 2012: D+21.1 2008: D+20.3
Not yet ingested
- Civics
- —
Market trends
- HPI YoY
- ▼ -235.12%
- Current HPI
- 326.7838
- Rent YoY
- —
- Metro
- —
- State GDP YoY
- ▲ 2.60%
- F500 in state
- 92
Industry mix (Fortune 500 HQ in NY)
| Industry | F500 HQs | Revenue |
|---|---|---|
| Financial Services | 10 | $950B |
|
||
| Consumer Goods | 9 | $162B |
|
||
| Insurance | 4 | $225B |
|
||
| Telecommunications | 2 | $144B |
|
||
| Pharmaceuticals | 2 | $112B |
|
||
| Media / Entertainment | 2 | $69B |
|
||
Price history
1 event — show timeline
- 2026-06-19 Listed $269,000 CNYIS
Property tax history
+13.0%/yrLatest (2025): $4,696 · +5.5% YoY. Source: county tax records.
Cash-flow waterfall
monthlySold comps — $/sqft
last 12 mo · ≤1 miLoading sold comps…