71891 Eleanora Ln · Rancho Mirage, CA
Flood risk 1/10 · Minimal
- FEMA flood zone
- X (shaded)
- Chance of flooding over 30 yrs
- 0.0%
- Est. flood insurance / yr
- $507 – $1,088
Fire risk 5/10 · Moderate
- Est. fire insurance / yr
- $659 – $1,223
Heat risk 9/10 · Severe
- Hot days now (above 114°F)
- 8 days/yr
- Hot days in 30 yrs
- 23 days/yr
Wind risk 1/10 · Minimal
- Chance of severe wind over 30 yrs
- —
Air-quality risk 4/10 · Minor
- Unhealthy air days now
- 5 days/yr
- Unhealthy air days in 30 yrs
- 6 days/yr
Risk factors via First Street. Map © Google.
Why this score? — see what drove the D grade
The composite is a weighted blend of 9 inputs, each scored 0–100. Each bar is that input's sub-score; the figure is the points it added to the 100-point composite (weight × sub-score).
- Cash flow +13.9/30.0
- ARV discount +7.5/15.0
- 1% rule +5.9/10.0
- DSCR +4.2/10.0
- Rent growth +3.4/5.0
- Schools +2.7/10.0
- Livability +2.6/5.0
- Condition / age +2.5/5.0
- Appreciation +0.0/10.0
$399,900
🖨 Deal sheet (PDF) 📄 Offer letter ✓ Due diligence
Listing remarks MLS
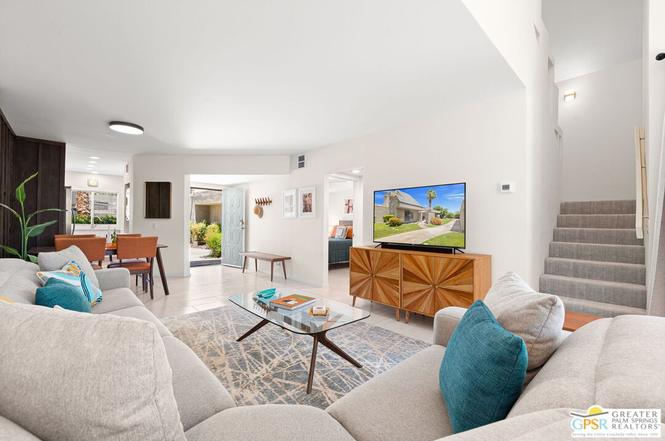
Located in the heart of Rancho Mirage, this hidden gem is an absolute must see! Contemporarily remodeled with new tile flooring downstairs, the living room has soaring ceilings and a cozy dining area. The kitchen features quartz countertops, designer backsplash, new cabinetry and appliances. Upstairs, the newly carpeted primary bedroom is spacious and bright and enjoys mountain views from its patio retreat. The reimagined primary bathroom features a gorgeous walk-in shower, soothing soaker tub, dual sink vanity and an enviable walk in closet! LED lighting and smooth coat walls further give this home an updated and fresh feel. Desert Village is lovely, well-kept community featuring 3 pools, tennis courts and is conveniently located just across the street from The River shopping center. HOA dues include cable, wi-fi, water and trash. Come take a look today!
Key facts
- Remodeled townhome
- Tall ceilings
- Remodeled kitchen
Tags
Property features AI
Finance
- Other: Managed by Desert Resort Management; Complex of 87 units
- HOA & community: HOA amenities: gated community, pool, spa, tennis courts; Association maintains landscaping; Association pet rules apply; HOA phone available; Monthly HOA fee (listed by seller)
Exterior
- Parking: Assigned parking; Carport (1 covered space); 1 total parking space; Guest parking available
- Security: Gated community access; Smoke detector; Carbon monoxide detectors
- Utilities: Sewer connected and paid; Water provided by water district; Cable TV available
- Home design: Residential condominium/townhouse (attached); Two-level building; Entry on level 1; Faces west; Updated/remodeled condition
- Construction: Stucco exterior; Foam roof; Concrete slab foundation; Built as part of planned development (Desert Village)
- Exterior features: Gated community; Landscaped grounds with lawn; Stucco wall fencing; Open patio; Rooftop deck; Balcony; Sliding glass doors; End unit; Community heated and filtered gunite pool; Community heated gunite spa; Community tennis courts; Community mailbox; Mountain views
Interior
- Kitchen: Remodeled galley kitchen; Range (electric); Microwave; Dishwasher; Garbage disposal; Refrigerator; Range/oven
- Bedrooms: Main-floor bedroom
- Flooring: Carpeted floors; Tile floors
- Bathrooms: Remodeled bathrooms; Tile surfaces; Shower stall; Shower and tub
- Heating & cooling: Central cooling and A/C; Multi-zone cooling; Ceiling fans; Forced air heating; Central heat; Zoned heating
- Interior features: Recessed lighting; High ceilings (9 feet+); Ground-level entry with no steps; Custom window coverings and blinds
- Laundry & utility: Laundry area in kitchen; Washer and dryer included; Water heater unit
Neighborhood map
What this means for you Summary
Snapshot
- This is a 2-bed/2.0-bath condo listed at $400k.
Deal economics
- At list price, monthly cash flow is $41 ($492/yr) — positive.
- The deal already cash-flows at list — no discount required.
- Meets the 1% rule at list price ($4k rent vs $400k).
- Cap rate 6.4% vs local median 3.0% in Rancho Mirage — top-decile yield for the area; either an underpriced asset or a hidden risk that comps aren't pricing in. Stress-test before assuming the spread holds.
Location & tenants
- Location reads 51/100 on livability (#1,065 in CA) — a working-class tenant base; expect higher turnover. Strengths: employment A+; Watch: amenities F, commute F, cost of living F.
- Palm Springs Unified (suburban): math 21% / reading 42% proficiency, ranked #328 of 517 in CA (top 63%) — families likely to look elsewhere, expect single-tenant / working-renter base with shorter leases; 73% free/reduced lunch — lower-income household profile, screen leases tightly.
- Zoned schools: Rancho Mirage Elementary (309 students, 86% FRL); Nellie N. Coffman Middle (953 students, 98% FRL); Rancho Mirage High (math 15% / reading 38%, grade F, #804 of 1,170 statewide, top 69%, 1,491 students, 97% FRL) — zoned schools average 94% FRL vs 73% district-wide (20 pts higher); higher-poverty schools than district average — tighter screening recommended.
- Market conditions: Rents rising (+3.7%/yr); 532 active listings in the ZIP; 40 comparable units currently listed for rent nearby; rentals lingering (median 46d on market — plan ~5-8 weeks vacancy on turnover, expect pricing pressure); 60% of comp listings sitting > 30 days — soft ceiling on asking rent; solid renter incomes; 9,195 units permitted in Riverside County in 2024 (1,512 in 5+ unit buildings).
- At $4,359/mo this rent would consume 49% of the median local household income ($107k/yr) (locally 498% of renters already pay >50% of income on rent) — very limited rent-growth headroom before tenants either downsize or default.
Forward outlook
- Local home prices are declining (-3.0%/yr); year-one equity from $3k of loan paydown is wiped out by about $12k of value loss. Plan a longer hold.
- Riverside County population projected at +22% by 2050 — long-run rental-demand tailwind backs the buy-and-hold thesis.
Negotiation context
- Only 2 days on market — expect competitive offers; lowballing is unlikely to land.
- 6 sale attempts since 26y ago; this cycle's ask has dropped $25k (6%) from the opening price — seller is motivated, your offer sets the floor, not the list.
Risks & watch-outs
- Climate carrying-cost: moderate wildfire risk; extreme-heat days projected 8→23/yr by 2055 (HVAC capex compounding) — expect insurance premiums to compound above CPI over the hold.
Questions for the listing agent
- Built in 1977 — when were the roof, HVAC, electrical panel, plumbing, and water heater last replaced?
- What does the HOA fee cover, when was the last increase, and are there any pending special assessments or reserve-fund shortfalls?
- Any open or pending special assessments — roof, HVAC, plumbing, elevator, façade? What's the per-unit balance and payoff schedule, and is the seller paying it off at close or rolling it to the buyer?
- Is there a deadline driving the sale (1031 exchange, divorce, estate, relocation)? That informs how much negotiation room exists.
- The area grade is low — what's the realistic commute time and amenity access for the typical tenant pool here? Any planned neighborhood developments (good or bad) we should know about?
- What's the average days-on-market for RENTAL listings here right now (not sales)? A rising rental-DOM trend means longer vacancies and softer asking-rent achievability than the comps imply.
- What's the recent tenant-quality profile in this submarket — average credit score on applications, eviction rate, late-payment / NSF rate, and stable-employment percentage? A property-management company in the area should have these aggregated.
- How much new apartment / multifamily construction is in the pipeline within 1–3 miles? Heavy new supply (>2% of stock underway) typically softens rents 12–24 months out; light construction supports rent growth.
Investment metrics
- 1% rule
- 1.09% ✓
- Cap rate
- 6.42%
- Cash-on-cash
- 0.44%
- DSCR
- 1.02
- GRM
- 7.6
CMA / ARV
No comps found within radius.
Projected returns pro-forma
-3.0% appreciation · 3.72% rent growth · sell at horizon
- IRR
- -14.5%
- Equity multiple
- 0.48×
- Total profit
- $-58,549
- Equity at exit
- $59,626
- IRR
- -4.2%
- Equity multiple
- 0.71×
- Total profit
- $-32,513
- Equity at exit
- $34,576
Cash invested: $111,972 (down + closing). Projections, not guarantees.
Landlord ↔ Tenant lean methodology
- Overall (STATE)
- 18 Strongly Tenant-Friendly
- State California
- 18 Strongly Tenant-Friendly · D+13
- County
- — inherits STATE
- City
- — inherits STATE
ZIP-level market 92270
- Rents YoY
- 3.7%
- Active inventory
- 532
- Price-to-rent
- 7.6×
Monthly cashflow live
- Estimated rent
- $4,359 high interval (Pro) →
- Mortgage (P&I)
- −$2,097
- Tax from tax record
- −$489 /mo · $5,867/yr
- Insurance
- −$167
- HOA
- −$650
- Vacancy / Maint / Mgmt
- −$915
- Net cashflow
- $41
Break-even live
Sensitivity live
| Price | -10% $267 | -5% $154 | +0% $41 | +5% $-72 | +10% $-185 |
|---|---|---|---|---|---|
| Rent | -10% $-303 | -5% $-131 | +0% $41 | +5% $213 | +10% $385 |
| Rate | -1.0pp $242 | -0.5pp $143 | base $41 | +0.5pp $-63 | +1.0pp $-168 |
UW: 25.0% down · 7.5% · 30yr · 1.5% tax · 5.0% vac · 8.0% maint · 8.0% mgmt
Financing live
Cash to close
- Down payment
- $99,975
- Closing costs
- $11,997
- Reserves months
- —
- Total cash needed
- —
Loan-product check · same deal, 3 products live
Conventional
25% down · 7.5% · 30yr
- Down + closing
- —
- Monthly P&I
- —
- Monthly cashflow
- —
- DSCR
- —
- Eligible?
- —
Personal DTI + credit; lowest rate.
DSCR
20% down · 8.5% · 30yr
- Down + closing
- —
- Monthly P&I
- —
- Monthly cashflow
- —
- DSCR
- —
- Eligible?
- —
No personal income docs; deal must DSCR.
Hard money
10% down · 12.0% · 12mo
- Down + closing
- —
- Monthly P&I
- —
- Monthly cashflow
- —
- DSCR
- —
- Eligible?
- —
Short-term bridge; refi at stabilization.
Rent comps 40 comps
| Address | Beds | Baths | Sqft | Rent | $/sqft | DOM | Units | Dist |
|---|---|---|---|---|---|---|---|---|
| 71863 Eleanora Ln Rancho Mirage, CA | 2.0 | 2.0 | 1384 | $2,600 | $1.88 | 46d | 1 | 0.04mi |
| 71990 Eleanora Ln Rancho Mirage, CA | 2.0 | 2.0 | 996 | $1,995 | $2.00 | 19d | 1 | 0.12mi |
| 5 Majorca Dr Rancho Mirage, CA | 2.0 | 2.0 | 1650 | $5,700 | $3.45 | 46d | 1 | 0.16mi |
| 35 Malaga Dr Rancho Mirage, CA | 3.0 | 2.0 | 1776 | $2,499 | $1.41 | 26d | 1 | 0.27mi |
| 17 Lugo Dr Rancho Mirage, CA | 3.0 | 2.0 | 1581 | $3,700 | $2.34 | 46d | 1 | 0.37mi |
| 42379 Rancho Las Palmas Dr #32 Rancho Mirage, CA | 2.0 | 1.5 | 915 | $2,200 | $2.40 | 46d | 1 | 0.44mi |
| 72 Majorca Dr Rancho Mirage, CA | 2.0 | 2.0 | 1320 | $3,038 | $2.30 | 46d | 1 | 0.44mi |
| 88 La Ronda Dr Rancho Mirage, CA | 2.0 | 2.0 | 1320 | $6,700 | $5.08 | 46d | 1 | 0.46mi |
| 142 La Cerra Dr Rancho Mirage, CA | 2.0 | 2.0 | 1650 | $4,000 | $2.42 | 46d | 1 | 0.49mi |
| 42676 E Veldt St Rancho Mirage, CA | 2.0 | 2.0 | 948 | $2,650 | $2.80 | 26d | 1 | 0.54mi |
| 11 Palma Dr Rancho Mirage, CA | 2.0 | 2.0 | 1320 | $6,500 | $4.92 | 46d | 1 | 0.54mi |
| 6 Granada Dr Rancho Mirage, CA | 2.0 | 2.0 | 1320 | $2,950 | $2.23 | 26d | 1 | 0.56mi |
| 41 Sunrise Dr Rancho Mirage, CA | 1.0 | 1.5 | 882 | $4,200 | $4.76 | 46d | 1 | 0.59mi |
| 97 Palma Dr Rancho Mirage, CA | 2.0 | 2.0 | 1650 | $5,900 | $3.58 | 46d | 1 | 0.61mi |
| 36 Sunrise Dr Rancho Mirage, CA | 2.0 | 2.0 | 1320 | $3,200 | $2.42 | 20d | 1 | 0.62mi |
| 71798 San Gorgonio Rd Rancho Mirage, CA | 3.0 | 2.0 | 1243 | $4,500 | $3.62 | 46d | 1 | 0.63mi |
| 27 Calle Encinitas Rancho Mirage, CA | 2.0 | 2.0 | 1537 | $2,200 | $1.43 | 26d | 1 | 0.63mi |
| 26 Sunrise Dr Rancho Mirage, CA | 3.0 | 3.0 | 1762 | $6,500 | $3.69 | 10d | 1 | 0.65mi |
| 71292 Biskra Rd Rancho Mirage, CA | 3.0 | 2.0 | 1732 | $7,999 | $4.62 | 46d | 1 | 0.69mi |
| 8 Cadiz Dr Rancho Mirage, CA | 2.0 | 2.0 | 1701 | $6,300 | $3.70 | 46d | 1 | 0.70mi |
| 45 Cueta Dr Rancho Mirage, CA | 2.0 | 2.0 | 1270 | $3,000 | $2.36 | 46d | 1 | 0.71mi |
| 81 Marbella Dr Rancho Mirage, CA | 2.0 | 2.0 | 1582 | $5,500 | $3.48 | 46d | 1 | 0.72mi |
| 48 Palma Dr Rancho Mirage, CA | 2.0 | 2.0 | 1320 | $6,200 | $4.70 | 46d | 1 | 0.73mi |
| 8 Valencia Dr Rancho Mirage, CA | 3.0 | 2.0 | 1700 | $6,800 | $4.00 | 46d | 1 | 0.76mi |
| 36 El Toro Dr Rancho Mirage, CA | 2.0 | 2.0 | 1270 | $4,000 | $3.15 | 26d | 1 | 0.86mi |
| 71581 Halgar Rd Rancho Mirage, CA | 3.0 | 3.0 | 1852 | $6,500 | $3.51 | 46d | 1 | 0.86mi |
| 8 Padron Way Rancho Mirage, CA | 3.0 | 2.0 | 1621 | $3,995 | $2.46 | 1d | 1 | 0.87mi |
| 68 El Toro Dr Rancho Mirage, CA | 2.0 | 2.0 | 1381 | $4,000 | $2.90 | 26d | 1 | 0.93mi |
| 199 Torremolinos Dr Rancho Mirage, CA | 2.0 | 2.0 | 1270 | $2,890 | $2.28 | 0d | 1 | 0.95mi |
| 16 Tortosa Dr Rancho Mirage, CA | 3.0 | 2.0 | 1720 | $7,495 | $4.36 | 46d | 1 | 0.97mi |
| 20 San Sebastian Dr Rancho Mirage, CA | 2.0 | 2.0 | 1380 | $2,950 | $2.14 | 46d | 1 | 0.99mi |
| 21 Don Quixote Dr Rancho Mirage, CA | 2.0 | 2.0 | 1270 | $4,000 | $3.15 | 26d | 1 | 0.99mi |
| 159 Torremolinos Dr Rancho Mirage, CA | 2.0 | 2.0 | 1513 | $6,100 | $4.03 | 46d | 1 | 1.01mi |
| 11 Ronda Dr Rancho Mirage, CA | 3.0 | 2.0 | 1680 | $3,200 | $1.90 | 46d | 1 | 1.01mi |
| 72460 Rodeo Way Rancho Mirage, CA | 2.0 | 2.0 | 1851 | $2,500 | $1.35 | 7d | 1 | 1.08mi |
| 70 Durango Cir Rancho Mirage, CA | 2.0 | 2.0 | 1500 | $3,800 | $2.53 | 17d | 1 | 1.09mi |
| 134 Las Lomas Palm Desert, CA | 2.0 | 2.0 | 1584 | $7,500 | $4.73 | 46d | 1 | 1.09mi |
| 203 Serena Dr Palm Desert, CA | 2.0 | 2.0 | 1303 | $3,000 | $2.30 | 5d | 1 | 1.10mi |
| 207 Serena Dr Palm Desert, CA | 2.0 | 2.0 | 1584 | $5,900 | $3.72 | 46d | 1 | 1.10mi |
| 144 Las Lomas Palm Desert, CA | 2.0 | 2.0 | 1584 | $6,600 | $4.17 | 1d | 1 | 1.10mi |
HOA detail condo
- Monthly dues
- $650 · $7,800/yr
- Likely covers
- watertrashinternetcablepool
- Assessments
- None detected in remarks — confirm with the listing agent.
Listing history 2 events
-
2026-06-21remarks 699-char remark
-
2026-06-21$399,900 Coming Soon 2 DOM
ⓘ Source: listings_history table (triggers on properties + properties_extension) + one-shot
backfill from property_details.listing_events for pre-trigger history.
Tax reassessment forecast CA · Resets to sale price
- Current annual tax
- $5,867 · $489/mo
- Projected year-2 tax
- $5,867 · $489/mo
- Expected delta
- $0/yr ($0/mo · 0.0%)
ⓘ Screening estimate from a state-policy table — verify with the county assessor before closing.
Climate risk First Street
- Flood 1/10 Low FEMA zone X (shaded) · 0% chance over 30 yrs
- Wildfire 5/10 Major
- Heat 9/10 Extreme 8 d/yr ≥114°F today · 23 d/yr by 30 yrs out
- Wind 1/10 Low
- Air quality 4/10 Moderate 5 unhealthy d/yr today · 6 by 30 yrs out
Nearby sold comps map
Loading sold comps map…
Walkable amenities ~0.75 mi
Loading nearby amenities…
Taxation est. · year 1
- Rental income
- $52,309
- − Mortgage interest
- −$22,401
- − Property taxes
- −$5,867
- − Insurance
- −$2,000
- − Repairs & maintenance
- −$4,185
- − Management
- −$4,185
- − HOA
- −$7,800
- − Depreciation
- −$11,633
- Taxable loss
- −$5,761
- Est. tax savings @ 24.0%
- +$1,383
- After-tax cash flow
- $1,875/yr
For passive investors: Depreciation is non-cash, so a rental often shows a tax loss while cash-flowing — sheltering income. Rental losses are passive: they offset passive income freely, and up to $25,000/yr can offset ordinary (W-2) income if you actively participate and your MAGI is under $100k (phasing out to $0 by $150k); unused losses carry forward. On sale, claimed depreciation is recaptured at up to 25%, and gains may owe capital-gains tax (a 1031 exchange can defer both). Figures are a year-1 estimate at your 24.0% rate — not tax advice; consult a CPA.
Schools (NCES district)
- District
- Palm Springs Unified
- NCES district ID
- 0629550
- Math proficiency
- 21% ▼ -7.00%
- Reading proficiency
- 42% ▬ 0.00%
- Median HH income
- $43,638
- Composite
- 26.76/100
- National rank
- #7131
- State rank
- #328 of 517 in CA
Livability — Rancho Mirage
- Score
- 51/100
- State rank
- #1065
- US rank
- #25255
Category grades
Schools grade is shown separately in the Schools card above.
Census & demographics
- Census place
- Rancho Mirage, CA
- County
- Riverside County · 2,287,001 people
- City population
- 17,563
- Metro
- Riverside-San Bernardino-Ontario, CA
- Population (ZIP)
- 17,563
- Household income
- $107,364
- Rent vs Own
- Severe rent burden
- 498.0
Population outlook (Riverside County) Hauer SSP2
- Today (2025)
- 2,664,475 people
- By 2030
- 2,802,692 · +5.2%
- By 2040
- 3,050,904 · +14.5%
- By 2050
- 3,256,783 · +22.2%
- By 2075
- 3,655,058 · +37.2%
- By 2100
- 3,766,594 · +41.4%
Race, ethnicity, and origin ACS 2023
- Neighborhood character
- Predominantly White (77%)
- Race & ethnicity
- White 77% Hispanic / Latino 15% Two or more races 6% Asian 4% Black 2%
- Hispanic origin (detail)
- Mexican 12%
- Common ancestry
- Slovak 4% Romanian 3% Lithuanian 3%
- Foreign-born
- 17% · Canada, South Korea, China
- Languages at home
- 81% English-only · Spanish 11% Other Indo-European 3% French/Haitian/Cajun 1%
Political lean MEDSL · Riverside
- 2024 margin
- Toss-up / Even · D 48.0% · R 49.3% · Other 2.6%
- 2008→2024 swing
- -3.6pp toward R · 2008: 2.3pp · 2024: -1.3pp
- All cycles
- 2024: R+1.3 2020: D+8.0 2016: D+4.3 2012: R+0.4 2008: D+2.3
Not yet ingested
- Civics
- —
Market trends
- HPI YoY
- ▼ -210.99%
- Current HPI
- 282.2957
- Rent YoY
- ▲ 3.72%
- Metro
- Riverside-San Bernardino-Ontario, CA
- State GDP YoY
- ▲ 3.21%
- F500 in state
- 116
Industry mix (Fortune 500 HQ in CA)
| Industry | F500 HQs | Revenue |
|---|---|---|
| Technology | 27 | $1,492B |
|
||
| Financial Services | 3 | $174B |
|
||
| Retail | 3 | $44B |
|
||
| Insurance | 3 | $26B |
|
||
| Media / Entertainment | 2 | $115B |
|
||
| Pharmaceuticals / Biotech | 2 | $62B |
|
||
Price history
+362.3% since first listed27 events — show timeline
- 2026-06-20 Coming Soon $399,900 TheMLS
- 2024-04-19 Sold (MLS) $430,000 GPSMLS
- 2024-04-03 Pending — GPSMLS
- 2024-03-21 Contingent — GPSMLS
- 2024-03-07 Listed $425,000 GPSMLS
- 2023-08-16 Sold (Public Records) $305,000 Public Records
- 2023-08-02 Pending — CRMLS
- 2023-08-02 Sold (MLS) $303,000 CRMLS
- 2023-07-20 Relisted — CRMLS
- 2023-05-16 Pending — CRMLS
- 2023-05-16 Price Changed $350,000 CRMLS
- 2023-05-16 Listing Removed — CRMLS
- 2023-05-15 Listed $300,000 CRMLS
- 2008-06-26 Listing Removed — GPSMLS
- 2008-06-14 Price Changed $259,900 GPSMLS
- 2008-06-09 Price Changed $254,900 GPSMLS
- 2008-03-07 Price Changed $259,900 GPSMLS
- 2008-01-25 Price Changed $279,900 GPSMLS
- 2008-01-23 Listed $299,000 GPSMLS
- 2006-04-03 Listing Removed — GPSMLS
- 2006-02-27 Listed $325,000 GPSMLS
- 2000-12-15 Sold (Public Records) $102,000 Public Records
- 2000-11-16 Listing Removed — GPSMLS
- 2000-09-15 Listed $115,000 GPSMLS
- 1993-11-15 Sold (Public Records) $93,000 Public Records
- 1990-07-09 Sold (Public Records) $85,000 Public Records
- 1985-10-31 Sold (Public Records) $86,500 Public Records
Property tax history
+5.9%/yrLatest (2025): $5,867 · +34.7% YoY. Source: county tax records.
Cash-flow waterfall
monthlySold comps — $/sqft
last 12 mo · ≤1 miLoading sold comps…