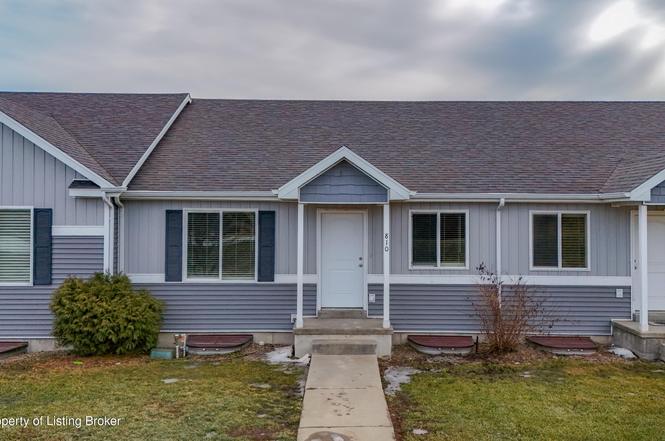
810 Adams Dr · Killdeer, ND
Flood risk No data
- FEMA flood zone
- —
- Chance of flooding over 30 yrs
- —
- Est. flood insurance / yr
- —
Fire risk No data
- Est. fire insurance / yr
- —
Heat risk No data
- Hot days now (above threshold)
- —
- Hot days in 30 yrs
- —
Wind risk No data
- Chance of severe wind over 30 yrs
- —
Air-quality risk No data
- Unhealthy air days now
- —
- Unhealthy air days in 30 yrs
- —
Risk factors via First Street. Map © Google.
Why this score? — see what drove the D grade
The composite is a weighted blend of 9 inputs, each scored 0–100. Each bar is that input's sub-score; the figure is the points it added to the 100-point composite (weight × sub-score).
- Cash flow +10.0/30.0
- ARV discount +7.5/15.0
- Appreciation +6.4/10.0
- Livability +3.8/5.0
- Schools +3.3/10.0
- DSCR +2.9/10.0
- Rent growth +2.5/5.0
- Condition / age +2.5/5.0
- 1% rule +2.1/10.0
$209,900
🖨 Deal sheet (PDF) 📄 Offer letter ✓ Due diligence
Key facts
- Built 2012
- Listed 123 days
Property features AI
Exterior
- Utilities: Public sewer
- Home design: Residential townhouse
- Construction: Finished basement
- Exterior features: Lot dimensions approximately 26 x 132; Zoned RMD
Interior
- Kitchen: Dishwasher; Disposal; Microwave; Range; Refrigerator
- Bathrooms: 3 full bathrooms
- Heating & cooling: Forced air heating; Has cooling
- Interior features: Eat-in kitchen; Window coverings; Finished basement
Neighborhood map
What this means for you Summary
Snapshot
- This is a 4-bed/3.0-bath other listed at $210k.
Deal economics
- At list price, monthly cash flow is $-125 ($-2k/yr) — negative.
- To cash-flow at today's rent, offer at most $188k (10.5% below list).
- To meet the 1% rule (rent ≥ 1% of price), the offer needs to be $150k (28.5% below list).
- Recommended offer: $150k (28.5% below list) — sets the bar for 1% rule.
Location & tenants
- Location reads 76/100 on livability (#13 in ND, #3,337 nationally) — a middle-class / working-renter tenant base. Strengths: cost of living A+, housing A+, health & safety A+; Watch: amenities F, commute F.
- Killdeer 16 (rural): math 32% / reading 42% proficiency, ranked #31 of 53 in ND (top 58%) — families likely to look elsewhere, expect single-tenant / working-renter base with shorter leases; only 16% free/reduced lunch — higher-income household profile.
- Zoned schools: Killdeer Elementary School (math 32% / reading 42%, grade F, #152 of 236 statewide, top 68%, 396 students, 22% FRL); Killdeer High School (math 32% / reading 42%, grade F, #71 of 144 statewide, top 52%, 250 students, 22% FRL).
- Market conditions: 39 active listings in the ZIP; 19 units permitted in Dunn County in 2024 (0 in 5+ unit buildings).
Forward outlook
- In year one you build about $7k of equity ($1k loan paydown + $6k appreciation (2.9% local appreciation)).
- Dunn County population projected at +106% by 2050 — long-run rental-demand tailwind backs the buy-and-hold thesis.
- By year 5, paydown + projected appreciation supports a ~$32k cash-out refi (75% LTV) — recoverable capital for the next deal without selling this one.
Negotiation context
- It's been on market 124 days — a 12% lower offer ($185k) is reasonable based on typical stale-listing flexibility.
Questions for the listing agent
- What do current leases actually rent for vs. the listed asking? Can we see a recent rent roll and the last 12 months of T-12 income?
- It's been on market 124 days. Have you received any prior offers? Is the seller open to a 29% concession, seller financing, or rate buy-down credit?
- Why hasn't it sold? Are there any deal-killer items the seller is aware of (foundation, flood, title, zoning, code violations)?
- Is there a deadline driving the sale (1031 exchange, divorce, estate, relocation)? That informs how much negotiation room exists.
- Schools are D-rated, which usually means shorter tenancies and higher turnover. Who's the typical renter profile here, and what's been the actual vacancy rate?
- The area grade is low — what's the realistic commute time and amenity access for the typical tenant pool here? Any planned neighborhood developments (good or bad) we should know about?
- What's the average days-on-market for RENTAL listings here right now (not sales)? A rising rental-DOM trend means longer vacancies and softer asking-rent achievability than the comps imply.
- What's the recent tenant-quality profile in this submarket — average credit score on applications, eviction rate, late-payment / NSF rate, and stable-employment percentage? A property-management company in the area should have these aggregated.
- How much new for-sale + rental construction is in the pipeline within 1–3 miles? Heavy new supply typically softens prices + rents 12–24 months out; constrained supply supports both.
Investment metrics
- 1% rule
- 0.71% ✗
- Cap rate
- 5.58%
- Cash-on-cash
- -2.56%
- DSCR
- 0.89
- GRM
- 11.7
CMA / ARV
No comps found within radius.
Projected returns pro-forma
2.85% appreciation · 3.0% rent growth · sell at horizon
- IRR
- 4.7%
- Equity multiple
- 1.27×
- Total profit
- $15,584
- Equity at exit
- $92,610
- IRR
- 7.8%
- Equity multiple
- 2.17×
- Total profit
- $68,679
- Equity at exit
- $141,362
Cash invested: $58,772 (down + closing). Projections, not guarantees.
Landlord ↔ Tenant lean methodology
- Overall (STATE)
- 82 Strongly Landlord-Friendly
- State North Dakota
- 82 Strongly Landlord-Friendly · R+20
- County
- — inherits STATE
- City
- — inherits STATE
ZIP-level market 58640
- Home prices YoY
- 2.2%
- Active inventory
- 39
- Price-to-rent
- 11.7×
Monthly cashflow live
- Estimated rent
- $1,500 medium interval (Pro) →
- Mortgage (P&I)
- −$1,101
- Tax from tax record
- −$122 /mo · $1,469/yr
- Insurance
- −$87
- HOA
- −$0
- Vacancy / Maint / Mgmt
- −$315
- Net cashflow
- $-125
Break-even live
Sensitivity live
| Price | -10% $-6 | -5% $-66 | +0% $-125 | +5% $-185 | +10% $-244 |
|---|---|---|---|---|---|
| Rent | -10% $-244 | -5% $-184 | +0% $-125 | +5% $-66 | +10% $-7 |
| Rate | -1.0pp $-19 | -0.5pp $-72 | base $-125 | +0.5pp $-180 | +1.0pp $-235 |
UW: 25.0% down · 7.5% · 30yr · 1.5% tax · 5.0% vac · 8.0% maint · 8.0% mgmt
Financing live
Cash to close
- Down payment
- $52,475
- Closing costs
- $6,297
- Reserves months
- —
- Total cash needed
- —
Loan-product check · same deal, 3 products live
Conventional
25% down · 7.5% · 30yr
- Down + closing
- —
- Monthly P&I
- —
- Monthly cashflow
- —
- DSCR
- —
- Eligible?
- —
Personal DTI + credit; lowest rate.
DSCR
20% down · 8.5% · 30yr
- Down + closing
- —
- Monthly P&I
- —
- Monthly cashflow
- —
- DSCR
- —
- Eligible?
- —
No personal income docs; deal must DSCR.
Hard money
10% down · 12.0% · 12mo
- Down + closing
- —
- Monthly P&I
- —
- Monthly cashflow
- —
- DSCR
- —
- Eligible?
- —
Short-term bridge; refi at stabilization.
Listing history 17 events
-
2026-06-22days on market $209,900 Active 124 DOM
-
2026-06-19days on market $209,900 Active 121 DOM
-
2026-06-18days on market $209,900 Active 120 DOM
-
2026-06-17days on market $209,900 Active 119 DOM
-
2026-06-16days on market $209,900 Active 118 DOM
-
2026-06-15days on market $209,900 Active 117 DOM
-
2026-06-14days on market $209,900 Active 115 DOM
-
2026-06-12days on market $209,900 Active 114 DOM
-
2026-06-09days on market $209,900 Active 111 DOM
-
2026-06-08days on market $209,900 Active 110 DOM
-
2026-06-07days on market $209,900 Active 109 DOM
-
2026-06-02days on market $209,900 Active 104 DOM
-
2026-06-01days on market $209,900 Active 103 DOM
-
2026-05-31days on market $209,900 Active 102 DOM
-
2026-05-30days on market $209,900 Active 101 DOM
-
2026-02-18$209,900 Active
-
2023-07-25historical
ⓘ Source: listings_history table (triggers on properties + properties_extension) + one-shot
backfill from property_details.listing_events for pre-trigger history.
Tax reassessment forecast ND · Resets to sale price
- Current annual tax
- $1,469 · $122/mo
- Projected year-2 tax
- $2,057 · $171/mo
- Expected delta
- +$588/yr (+$49/mo · 40.1%)
ⓘ Screening estimate from a state-policy table — verify with the county assessor before closing.
Nearby sold comps map
Loading sold comps map…
Walkable amenities ~0.75 mi
Loading nearby amenities…
Taxation est. · year 1
- Rental income
- $18,006
- − Mortgage interest
- −$11,758
- − Property taxes
- −$1,469
- − Insurance
- −$1,050
- − Repairs & maintenance
- −$1,440
- − Management
- −$1,440
- − Depreciation
- −$6,106
- Taxable loss
- −$5,257
- Est. tax savings @ 24.0%
- +$1,262
- After-tax cash flow
- $-241/yr
For passive investors: Depreciation is non-cash, so a rental often shows a tax loss while cash-flowing — sheltering income. Rental losses are passive: they offset passive income freely, and up to $25,000/yr can offset ordinary (W-2) income if you actively participate and your MAGI is under $100k (phasing out to $0 by $150k); unused losses carry forward. On sale, claimed depreciation is recaptured at up to 25%, and gains may owe capital-gains tax (a 1031 exchange can defer both). Figures are a year-1 estimate at your 24.0% rate — not tax advice; consult a CPA.
Schools (NCES district)
- District
- Killdeer 16
- NCES district ID
- 3810270
- Math proficiency
- 32% ▼ -3.00%
- Reading proficiency
- 42% ▲ 6.00%
- Median HH income
- $64,263
- Composite
- 33.34/100
- National rank
- #5495
- State rank
- #31 of 53 in ND
Livability — Killdeer
- Score
- 76/100
- State rank
- #13
- US rank
- #3337
Category grades
Schools grade is shown separately in the Schools card above.
Census & demographics
- Census place
- Killdeer, ND
- Population (ZIP)
- 1,324
Population outlook (Dunn County) Hauer SSP2
- Today (2025)
- 6,779 people
- By 2030
- 8,039 · +18.6%
- By 2040
- 10,863 · +60.2%
- By 2050
- 13,981 · +106.2%
- By 2075
- 22,779 · +236.0%
- By 2100
- 30,687 · +352.7%
Race, ethnicity, and origin ACS 2023
- Neighborhood character
- Predominantly White (92%)
- Race & ethnicity
- White 92% Two or more races 5% Native American 3% Hispanic / Latino 3%
- Common ancestry
- Portuguese 13% Romanian 4% Scotch-Irish 4%
- Foreign-born
- 2% · Canada
- Languages at home
- 89% English-only · Spanish 4% Russian/Polish/Slavic 1% German/W. Germanic 1%
Political lean MEDSL · Dunn
- 2024 margin
- Solid R (+69.2) · D 14.9% · R 84.1%
- 2008→2024 swing
- -35.6pp toward R · 2008: -33.6pp · 2024: -69.2pp
- All cycles
- 2024: R+69.2 2020: R+68.8 2016: R+63.5 2012: R+50.0 2008: R+33.6
Not yet ingested
- Civics
- —
Market trends
- HPI YoY
- ▲ 2.85%
- Current HPI
- 129.7711
- Rent YoY
- —
- Metro
- —
- State GDP YoY
- ▲ 2.09%
- F500 in state
- 2
Industry mix (Fortune 500 HQ in ND)
| Industry | F500 HQs | Revenue |
|---|---|---|
| Utilities / Construction | 1 | $6B |
|
||
Price history
2 events — show timeline
- 2026-02-18 Listed $209,900 Badlands BOR MLS
- 2023-07-25 Rental Removed — APPFOLIO
Cash-flow waterfall
monthlySold comps — $/sqft
last 12 mo · ≤1 miLoading sold comps…