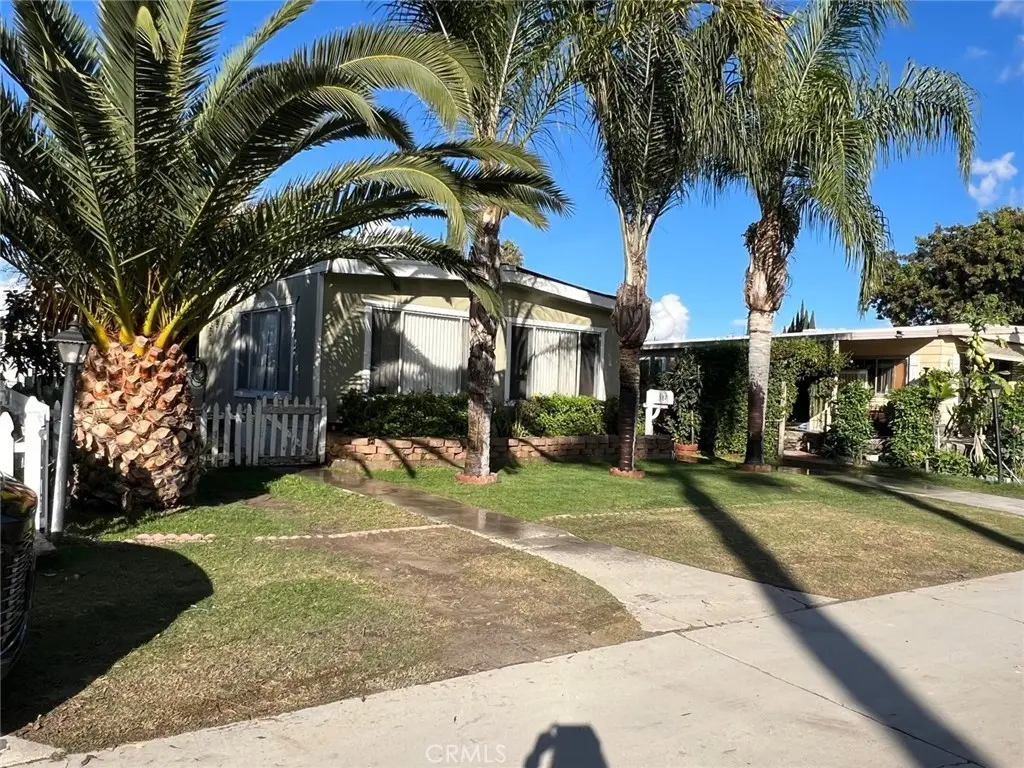
5800 Hamner Ave #387 · Eastvale, CA
Flood risk 4/10 · Minor
- FEMA flood zone
- X (unshaded)
- Chance of flooding over 30 yrs
- 0.2%
- Est. flood insurance / yr
- $507 – $1,088
Fire risk 7/10 · Major
- Est. fire insurance / yr
- $659 – $1,223
Heat risk 7/10 · Major
- Hot days now (above 102°F)
- 3 days/yr
- Hot days in 30 yrs
- 7 days/yr
Wind risk 1/10 · Minimal
- Chance of severe wind over 30 yrs
- —
Air-quality risk 9/10 · Severe
- Unhealthy air days now
- 23 days/yr
- Unhealthy air days in 30 yrs
- 26 days/yr
Risk factors via First Street. Map © Google.
Why this score? — see what drove the C- grade
The composite is a weighted blend of 9 inputs, each scored 0–100. Each bar is that input's sub-score; the figure is the points it added to the 100-point composite (weight × sub-score).
- Cash flow +15.0/30.0
- ARV discount +15.0/15.0
- 1% rule +5.0/10.0
- DSCR +5.0/10.0
- Rent growth +3.2/5.0
- Livability +3.2/5.0
- Schools +3.1/10.0
- Condition / age +2.5/5.0
- Appreciation +0.0/10.0
$77,500
🖨 Deal sheet 📄 Offer letter ✓ Due diligence
Listing remarks
Welcome to this spacious and well-maintained 2-bedroom, 2-bathroom manufactured home located in the highly sought-after Swan Lake Community, an all-ages gated community in Eastvale, CA. Built in 1969 and offering approximately 1,440 square feet of comfortable living space, this home provides excellent value. Step inside to find a functional layout with generous room sizes perfect for families or those seeking extra space. The home features a bright living area, and a practical kitchen. You’ll also enjoy the convenience of in-home laundry and ample storage throughout. Many recent updates make this a move-in ready opportunity in a prime location facing the serene lake. This desirable co
Key facts
- Gated community
- Move-in ready
- Recent updates
Tags
Property features AI
Finance
- Other: Park name: Swan Lake; Manager approval may be required
- Financial info: Land lease in effect; monthly land lease payment (seller-provided amount)
- HOA & community: Association amenities include pool, spa, clubhouse, billiard room, dog park, onsite property management, controlled access/guard, common RV parking, and other community rules; Community features include biking, dog park, fishing, lake access, and street lighting
Exterior
- Parking: Two parking spaces; Two-car attached carport; Driveway; RV potential (common RV parking available; park has controlled RV parking and may charge RV parking fee)
- Security: Gated with guard; Controlled access
- Utilities: Public sewer; District/Public water
- Home design: Single-story mobile home (24' x 60'); Mobile home remains on site; Total of 1 story; Has a view
- Construction: Year built per public records
- Exterior features: Community pool; Back yard; Lot on lakefront / lake view
Interior
- Kitchen: Gas range; Dishwasher
- Flooring: Vinyl flooring
- Bathrooms: Two full bathrooms; Shower-in-tub in bath(s)
- Heating & cooling: Central cooling; Central furnace heating
- Interior features: One-level home; Entry at main level; Carbon monoxide detectors and fire/smoke detection system; 24-hour security and gated community with guard; Community spa
- Laundry & utility: Laundry inside the home
Neighborhood map
What this means for you Summary
Snapshot
- This is a 2-bed/2.0-bath manufactured listed at $78k.
Deal economics
- At list price, monthly cash flow is $2k ($25k/yr) — positive.
- The deal already cash-flows at list — no discount required.
- Meets the 1% rule at list price ($3k rent vs $78k).
- Cap rate 38.1% vs local median 2.9% in Eastvale — top-decile yield for the area; either an underpriced asset or a hidden risk that comps aren't pricing in. Stress-test before assuming the spread holds.
Location & tenants
- Location reads 63/100 on livability (#464 in CA) — a middle-class / working-renter tenant base. Strengths: employment A+, housing A+, crime A-; Watch: amenities F, commute F, cost of living F.
- Jurupa Unified (suburban): math 25% / reading 38% proficiency, ranked #953 of 1,400 in CA (top 68%) — families likely to look elsewhere, expect single-tenant / working-renter base with shorter leases; 64% free/reduced lunch — lower-income household profile, screen leases tightly.
- Market conditions: Rents rising (+3.0%/yr); 64 active listings in the ZIP; 39 comparable units currently listed for rent nearby; rentals at typical pace (median 25d on market — plan ~3-4 weeks tenant-placement turnaround); high-income renter base; 9,195 units permitted in Riverside County in 2024 (1,512 in 5+ unit buildings).
- This rent runs 34% of the median local income ($115k/yr) — at the standard rent-burdened threshold; future hikes will face affordability resistance.
Forward outlook
- Local home prices are declining (-3.0%/yr); year-one equity from $536 of loan paydown is wiped out by about $2k of value loss. Plan a longer hold.
- Riverside County population projected at +22% by 2050 — long-run rental-demand tailwind backs the buy-and-hold thesis.
- At projected returns (-3.0% appreciation + 3.0% rent growth), your $22k cash investment doubles in ~1 year — after that, you're playing with house money.
Negotiation context
- Only 8 days on market — expect competitive offers; lowballing is unlikely to land.
- 11 sale attempts since 20y ago with the ask held roughly flat each time — persistent listings suggest the price (not the market) is what's stuck; bring a comps-based counter.
- Current owner paid $49k; list at $78k implies a 58% gain — meaningful room to come down on a strong offer.
Risks & watch-outs
- Climate carrying-cost: major wildfire risk; extreme-heat days projected 3→7/yr by 2055 (HVAC capex compounding) — expect insurance premiums to compound above CPI over the hold.
Questions for the listing agent
- Built in 1969 — when were the roof, HVAC, electrical panel, plumbing, and water heater last replaced?
- Is there a deadline driving the sale (1031 exchange, divorce, estate, relocation)? That informs how much negotiation room exists.
- Schools are B-rated — typically a magnet for longer-tenancy family renters. What's the average tenant stay here, and is there a school-zone premium baked into asking?
- What's the average days-on-market for RENTAL listings here right now (not sales)? A rising rental-DOM trend means longer vacancies and softer asking-rent achievability than the comps imply.
- What's the recent tenant-quality profile in this submarket — average credit score on applications, eviction rate, late-payment / NSF rate, and stable-employment percentage? A property-management company in the area should have these aggregated.
- How much new for-sale + rental construction is in the pipeline within 1–3 miles? Heavy new supply typically softens prices + rents 12–24 months out; constrained supply supports both.
Investment metrics
- 1% rule
- 4.23% ✓
- Cap rate
- 38.07%
- Cash-on-cash
- 113.48%
- DSCR
- 6.05
- GRM
- 2.0
CMA / ARV
- ARV (median comp)
- $150,282
- List price
- $77,500
- Delta
- -33.52%
- Verdict
- UNDERPRICED
- Comps
- 20 within 1.0 mi
Show comp detail 12 sales within ~0.75 mi
| Address | Dist | Beds/Ba | Sqft | Sold | Price | $/sf | Match |
|---|---|---|---|---|---|---|---|
| 5800 Hamner Ave #354 | 0.00mi | 3/2.0 (+1) | 1,440 (0%) | 7mo | $139,900 | $97 | 89 |
| 5800 Hamner Ave #237 | 0.10mi | 3/2.0 (+1) | 1,440 (0%) | 4mo | $82,500 | $57 | 87 |
| 5800 Hamner Ave #259 | 0.00mi | 3/2.0 (+1) | 1,440 (0%) | 9mo | $105,000 | $73 | 87 |
| 5800 Hamner Ave #705 | 0.00mi | 3/2.0 (+1) | 1,440 (0%) | 11mo | $184,000 | $128 | 86 |
| 5800 Hamner Ave #72 | 0.00mi | 3/2.0 (+1) | 1,344 (-7%) | 3mo | $255,000 | $190 | 82 |
| 5800 Hamner Ave #568 | 0.07mi | 3/2.0 (+1) | 1,344 (-7%) | 0mo | $247,500 | $184 | 80 |
| 5800-#407 Hamner Ave #407 | 0.00mi | 3/2.0 (+1) | 1,344 (-7%) | 8mo | $161,500 | $120 | 77 |
| 5800 Hamner #431 | 0.00mi | 3/2.0 (+1) | 1,248 (-13%) | 1mo | $155,000 | $124 | 72 |
| 5800 Hamner Ave #447 | 0.00mi | 3/2.5 (+1) | 1,632 (+13%) | 1mo | $115,000 | $70 | 70 |
| 5800 Hamner Ave #436 | 0.00mi | 3/2.0 (+1) | 1,230 (-15%) | 1mo | $235,000 | $191 | 70 |
| 5800 Hamner #308 | 0.13mi | 2/2.0 | 1,607 (+12%) | 10mo | $72,000 | $45 | 67 |
| 5800 Hamner Ave #471 | 0.22mi | 3/2.0 (+1) | 1,596 (+11%) | 11mo | $159,000 | $100 | 57 |
Match score weights: distance 35% · size 25% · config 20% · recency 20%. Top-matched comps best support the ARV.
Projected returns pro-forma
-3.0% appreciation · 3.0% rent growth · sell at horizon
- IRR
- —
- Equity multiple
- 6.45×
- Total profit
- $118,192
- Equity at exit
- $11,556
- IRR
- —
- Equity multiple
- 13.51×
- Total profit
- $271,419
- Equity at exit
- $6,701
Cash invested: $21,700 (down + closing). Projections, not guarantees.
Landlord ↔ Tenant lean methodology
- Overall (STATE)
- 18 Strongly Tenant-Friendly
- State California
- 18 Strongly Tenant-Friendly · D+13
- County
- — inherits STATE
- City
- — inherits STATE
ZIP-level market 91752
- Rents YoY
- 3.0%
- Active inventory
- 64
- Price-to-rent
- 2.0×
Monthly cashflow live
- Estimated rent
- $3,276 high interval (Pro) →
- Mortgage (P&I)
- −$406
- Tax est. 1.5%
- −$97 /mo · $1,162/yr
- Insurance
- −$32
- HOA
- −$0
- Vacancy / Maint / Mgmt
- −$688
- Net cashflow
- $2,052
Break-even live
UW: 25.0% down · 7.5% · 30yr · 1.5% tax · 5.0% vac · 8.0% maint · 8.0% mgmt
Financing live
Cash to close
- Down payment
- $19,375
- Closing costs
- $2,325
- Reserves months
- —
- Total cash needed
- —
Loan-product check · same deal, 3 products live
Conventional
25% down · 7.5% · 30yr
- Down + closing
- —
- Monthly P&I
- —
- Monthly cashflow
- —
- DSCR
- —
- Eligible?
- —
Personal DTI + credit; lowest rate.
DSCR
20% down · 8.5% · 30yr
- Down + closing
- —
- Monthly P&I
- —
- Monthly cashflow
- —
- DSCR
- —
- Eligible?
- —
No personal income docs; deal must DSCR.
Hard money
10% down · 12.0% · 12mo
- Down + closing
- —
- Monthly P&I
- —
- Monthly cashflow
- —
- DSCR
- —
- Eligible?
- —
Short-term bridge; refi at stabilization.
Rent comps 39 comps
| Address | Beds | Baths | Sqft | Rent | $/sqft | DOM | Units | Dist |
|---|---|---|---|---|---|---|---|---|
| 12515 Celebration Dr Eastvale, CA | 3.0 | 2.0 | 1760 | $3,400 | $1.93 | 43d | 1 | 0.24mi |
| 5464 W Homecoming Cir Eastvale, CA | 1.0–3.0 | 1.5–3.0 | 1359 | $3,438 | $2.53 | 1d | 20 | 0.26mi |
| 5929 Rockport Rd Eastvale, CA | 3.0 | 2.5 | 1605 | $3,300 | $2.06 | 24d | 1 | 0.32mi |
| 5954 Catskills Ct Eastvale, CA | 2.0 | 2.5 | 1378 | $3,500 | $2.54 | 22d | 1 | 0.43mi |
| 12766 Bolsa Dr Eastvale, CA | 3.0 | 2.5 | 1772 | $3,300 | $1.86 | 43d | 1 | 0.50mi |
| 12774 Bolsa Dr Eastvale, CA | 3.0 | 3.0 | 1772 | $3,395 | $1.92 | 16d | 1 | 0.51mi |
| 12782 Lomond Way Eastvale, CA | 3.0 | 2.5 | 1775 | $3,300 | $1.86 | 43d | 1 | 0.51mi |
| 6302 Ancora Ln Eastvale, CA | 2.0 | 2.5 | 1211 | $2,800 | $2.31 | 43d | 1 | 0.60mi |
| 12579 Ruvina Ln Eastvale, CA | 2.0 | 2.5 | 1550 | $2,850 | $1.84 | 24d | 1 | 0.61mi |
| 12579 Ruvina Ln Eastvale, CA | 2.0 | 2.5 | 1550 | $2,850 | $1.84 | 43d | 1 | 0.61mi |
| 12402 Constellation St Eastvale, CA | 3.0 | 3.0 | 1499 | $3,300 | $2.20 | 43d | 1 | 0.62mi |
| 12432 Constellation St Eastvale, CA | 3.0 | 2.0 | 1668 | $3,150 | $1.89 | 43d | 1 | 0.62mi |
| 12432 Constellation St Unit 10 Eastvale, CA | 3.0 | 2.5 | 1668 | $3,150 | $1.89 | 43d | 1 | 0.62mi |
| 6337 Andromeda Ct Eastvale, CA | 3.0 | 4.0 | 1513 | $3,300 | $2.18 | 24d | 1 | 0.64mi |
| 12538 Tavira Ln Eastvale, CA | 3.0 | 3.5 | 1583 | $3,000 | $1.90 | 4d | 1 | 0.65mi |
| 6366 Aquila Way Eastvale, CA | 3.0 | 2.5 | 1681 | $3,000 | $1.78 | 43d | 1 | 0.67mi |
| 6386 Pegasus Ct Eastvale, CA | 3.0 | 4.0 | 1500 | $3,100 | $2.07 | 24d | 1 | 0.69mi |
| 6371 Estrela Ln Eastvale, CA | 3.0 | 4.0 | 1583 | $3,500 | $2.21 | 1d | 1 | 0.70mi |
| 6397 Peacock Ct Eastvale, CA | 3.0 | 2.5 | 1668 | $6,000 | $3.60 | 1d | 1 | 0.70mi |
| 4029 E Perdido Privado Ontario, CA | 2.0 | 2.0 | 1556 | $3,200 | $2.06 | 24d | 1 | 0.75mi |
| 5930 Ginger Dr Eastvale, CA | 3.0 | 2.5 | 1554 | $2,990 | $1.92 | 43d | 1 | 0.77mi |
| 13010 58th St Eastvale, CA | 3.0 | 2.5 | 1554 | $3,299 | $2.12 | 15d | 1 | 0.77mi |
| 5942 Ginger Dr Eastvale, CA | 3.0 | 2.5 | 1742 | $3,000 | $1.72 | 43d | 1 | 0.78mi |
| 4536 S Afton Privado Ontario, CA | 2.0 | 2.0 | 1416 | $3,500 | $2.47 | 1d | 1 | 0.80mi |
| 12967 Paradiso Dr #103 Eastvale, CA | 3.0 | 3.5 | 1597 | $6,400 | $4.01 | 1d | 1 | 0.82mi |
| 4395 S Alegre Privado #2 Ontario, CA | 3.0 | 2.5 | 1628 | $3,600 | $2.21 | 4d | 1 | 0.86mi |
| 11958 Sunstone Ct Unit 2-M Jurupa Valley, CA | 1.0 | 1.0 | 899 | $1,699 | $1.89 | 43d | 1 | 0.88mi |
| 4130 E Malagon Privado #88 Ontario, CA | 3.0 | 2.5 | 1389 | $3,150 | $2.27 | 24d | 1 | 0.91mi |
| 4282 S Malagon Privado Ontario, CA | 3.0 | 2.5 | 1707 | $3,300 | $1.93 | 24d | 1 | 0.92mi |
| 4209 S Malagon Privado Ontario, CA | 3.0 | 2.5 | 1753 | $3,400 | $1.94 | 1d | 1 | 1.00mi |
| 4110 E Coronado Privado Ontario, CA | 2.0 | 2.0 | 1193 | $3,300 | $2.77 | 22d | 1 | 1.06mi |
| 6770 Pats Ranch Rd Jurupa Valley, CA | 1.0–2.0 | 1.0–2.0 | 938 | $3,712 | $3.96 | 1d | 16 | 1.14mi |
| 4243 E Rincon St Ontario, CA | 3.0 | 2.5 | 1650 | $3,500 | $2.12 | 1d | 1 | 1.15mi |
| 3977 E Huntington St Ontario, CA | 3.0 | 2.5 | 1555 | $3,200 | $2.06 | 4d | 1 | 1.16mi |
| 4255 E Carmel Privado Ontario, CA | 3.0 | 2.5 | 1450 | $3,200 | $2.21 | 24d | 1 | 1.17mi |
| 4191 E Carmel Privado Ontario, CA | 3.0 | 2.5 | 1652 | $3,300 | $2.00 | 24d | 1 | 1.20mi |
| 4231 S Hollyhock Paseo #76 Ontario, CA | 3.0 | 2.5 | 1428 | $3,000 | $2.10 | 24d | 1 | 1.22mi |
| 4231 E Sage Paseo Unit 97 Ontario, CA | 3.0 | 2.5 | 1428 | $3,150 | $2.21 | 24d | 1 | 1.25mi |
| 12167 Chutes Ct Jurupa Valley, CA | 3.0 | 2.5 | 1819 | $3,200 | $1.76 | 5d | 1 | 1.48mi |
Listing history 33 events
-
2026-06-18days on market $77,500 Active 8 DOM
-
2026-06-17days on market $77,500 Active 7 DOM
-
2026-06-16days on market $77,500 Active 6 DOM
-
2026-06-15days on market $77,500 Active 5 DOM
-
2026-06-13days on market $77,500 Active 3 DOM
-
2026-06-13remarks 693-char remark
-
2026-06-13pricedays on market $77,500 Active 2 DOM
-
2026-06-01days on market $99,900 Active 40 DOM
-
2026-05-31days on market $99,900 Active 39 DOM
-
2026-05-12price $99,900 488-char remark
-
2026-04-22$109,900 Active 488-char remark
-
2026-04-05historical
-
2026-03-10price $109,900
-
2026-03-02price $125,000
-
2026-02-21price $129,000
-
2026-01-08$130,000 Active
-
2021-12-22status Active
-
2021-10-17status Active
-
2021-10-13$85,000 Active
-
2009-10-25price $48,000 Expired
-
2009-02-01historical
-
2009-01-06price $8,000
-
2008-11-20price $21,000
-
2008-11-12$27,000
-
2007-11-01historical
-
2007-08-29price $58,000
-
2007-05-22$65,000
-
2006-11-29soldstatus $49,000
-
2006-11-01historical
-
2006-11-01historical
-
2006-09-27$45,900
-
2006-09-27$60,000
-
2006-09-27$60,000
ⓘ Source: listings_history table (triggers on properties + properties_extension) + one-shot
backfill from property_details.listing_events for pre-trigger history.
Climate risk First Street
- Flood 4/10 Moderate FEMA zone X (unshaded) · 20% chance over 30 yrs
- Wildfire 7/10 Severe
- Heat 7/10 Severe 3 d/yr ≥102°F today · 7 d/yr by 30 yrs out
- Wind 1/10 Low
- Air quality 9/10 Extreme 23 unhealthy d/yr today · 26 by 30 yrs out
Nearby sold comps map
Loading sold comps map…
Walkable amenities ~0.75 mi
Loading nearby amenities…
Taxation est. · year 1
- Rental income
- $39,307
- − Mortgage interest
- −$4,341
- − Property taxes
- −$1,162
- − Insurance
- −$388
- − Repairs & maintenance
- −$3,145
- − Management
- −$3,145
- − Depreciation
- −$2,255
- Taxable income
- $24,872
- Est. tax owed @ 24.0%
- −$5,969
- After-tax cash flow
- $18,656/yr
For passive investors: Depreciation is non-cash, so a rental often shows a tax loss while cash-flowing — sheltering income. Rental losses are passive: they offset passive income freely, and up to $25,000/yr can offset ordinary (W-2) income if you actively participate and your MAGI is under $100k (phasing out to $0 by $150k); unused losses carry forward. On sale, claimed depreciation is recaptured at up to 25%, and gains may owe capital-gains tax (a 1031 exchange can defer both). Figures are a year-1 estimate at your 24.0% rate — not tax advice; consult a CPA.
Schools (NCES district)
- District
- Jurupa Unified
- NCES district ID
- 0619260
- Math proficiency
- 25% ▲ 2.00%
- Reading proficiency
- 38% ▲ 2.00%
- Median HH income
- $58,100
- Composite
- 30.97/100
- National rank
- #11327
- State rank
- #953 of 1400 in CA
Livability — Eastvale
- Score
- 63/100
- State rank
- #464
- US rank
- #15853
Category grades
Schools grade is shown separately in the Schools card above.
Census & demographics
- Census place
- Eastvale, CA
- County
- Riverside County · 2,287,001 people
- City population
- 75,043
- Metro
- Riverside-San Bernardino-Ontario, CA
- Population (ZIP)
- 37,983
- Household income
- $115,177
- Rent vs Own
- Severe rent burden
- 1280.0
Population outlook (Riverside County) Hauer SSP2
- Today (2025)
- 2,664,475 people
- By 2030
- 2,802,692 · +5.2%
- By 2040
- 3,050,904 · +14.5%
- By 2050
- 3,256,783 · +22.2%
- By 2075
- 3,655,058 · +37.2%
- By 2100
- 3,766,594 · +41.4%
Race, ethnicity, and origin ACS 2023
- Neighborhood character
- Diverse neighborhood (Simpson 0.57)
- Race & ethnicity
- Hispanic / Latino 61% White 20% Two or more races 16% Asian 10% Black 7% Native American 1%
- Hispanic origin (detail)
- Mexican 54% Puerto Rican 1%
- Common ancestry
- Italian 1% Lithuanian 1% Iranian 1%
- Foreign-born
- 26% · Canada, China, South Korea
- Languages at home
- 47% English-only · Spanish 45% Tagalog/Filipino 2% Other Indo-European 2%
Political lean MEDSL · Riverside
- 2024 margin
- Toss-up / Even · D 48.0% · R 49.3% · Other 2.6%
- 2008→2024 swing
- -3.6pp toward R · 2008: 2.3pp · 2024: -1.3pp
- All cycles
- 2024: R+1.3 2020: D+8.0 2016: D+4.3 2012: R+0.4 2008: D+2.3
Not yet ingested
- Civics
- —
Market trends
- HPI YoY
- ▼ -560.99%
- Current HPI
- 426.3636
- Rent YoY
- ▲ 3.00%
- Metro
- Riverside-San Bernardino-Ontario, CA
- State GDP YoY
- ▲ 3.21%
- F500 in state
- 116
Industry mix (Fortune 500 HQ in CA)
| Industry | F500 HQs | Revenue |
|---|---|---|
| Technology | 27 | $1,492B |
|
||
| Financial Services | 3 | $174B |
|
||
| Retail | 3 | $44B |
|
||
| Insurance | 3 | $26B |
|
||
| Media / Entertainment | 2 | $115B |
|
||
| Pharmaceuticals / Biotech | 2 | $62B |
|
||
Price history
+68.8% since first listed26 events — show timeline
- 2026-06-10 Listed $77,500 CRMLS
- 2026-06-01 Listing Removed — CRMLS
- 2026-05-12 Price Changed $99,900 CRMLS
- 2026-04-22 Listed $109,900 CRMLS
- 2026-04-05 Listing Removed — CRMLS
- 2026-03-10 Price Changed $109,900 CRMLS
- 2026-03-02 Price Changed $125,000 CRMLS
- 2026-02-21 Price Changed $129,000 CRMLS
- 2026-01-08 Listed $130,000 CRMLS
- 2021-12-22 Relisted — CRMLS
- 2021-10-17 Relisted — CRMLS
- 2021-10-13 Listed $85,000 CRMLS
- 2009-10-25 Price Changed $48,000 CRMLS
- 2009-02-01 Listing Removed — CRMLS
- 2009-01-06 Price Changed $8,000 CRMLS
- 2008-11-20 Price Changed $21,000 CRMLS
- 2008-11-12 Listed $27,000 CRMLS
- 2007-11-01 Listing Removed — CRMLS
- 2007-08-29 Price Changed $58,000 CRMLS
- 2007-05-22 Listed $65,000 CRMLS
- 2006-11-29 Sold (MLS) $49,000 CRMLS
- 2006-11-01 Listing Removed — CRMLS
- 2006-11-01 Listing Removed — CRMLS
- 2006-09-27 Listed $60,000 CRMLS
- 2006-09-27 Listed $60,000 CRMLS
- 2006-09-27 Listed $45,900 CRMLS
Property tax history
-6.4%/yrLatest (2025): $86 · +7.3% YoY. Source: county tax records.
Cash-flow waterfall
monthlySold comps — $/sqft
last 12 mo · ≤1 miLoading sold comps…