7113 Meandering Creek Ln · Fort Worth, TX
Flood risk 1/10 · Minimal
- FEMA flood zone
- X (unshaded)
- Chance of flooding over 30 yrs
- 0.0%
- Est. flood insurance / yr
- $507 – $1,088
Fire risk 4/10 · Minor
- Est. fire insurance / yr
- $1,222 – $2,270
Heat risk 7/10 · Major
- Hot days now (above 109°F)
- 6 days/yr
- Hot days in 30 yrs
- 19 days/yr
Wind risk 6/10 · Moderate
- Chance of severe wind over 30 yrs
- 27.0%
Air-quality risk 2/10 · Minimal
- Unhealthy air days now
- 1 days/yr
- Unhealthy air days in 30 yrs
- 2 days/yr
Risk factors via First Street. Map © Google.
Why this score? — see what drove the D grade
The composite is a weighted blend of 9 inputs, each scored 0–100. Each bar is that input's sub-score; the figure is the points it added to the 100-point composite (weight × sub-score).
- Cash flow +14.2/30.0
- ARV discount +7.5/15.0
- DSCR +4.3/10.0
- Livability +4.0/5.0
- Condition / age +4.0/5.0
- Schools +3.5/10.0
- 1% rule +3.0/10.0
- Rent growth +2.9/5.0
- Appreciation +0.0/10.0
$285,999
🖨 Deal sheet (PDF) 📄 Offer letter ✓ Due diligence
Listing remarks
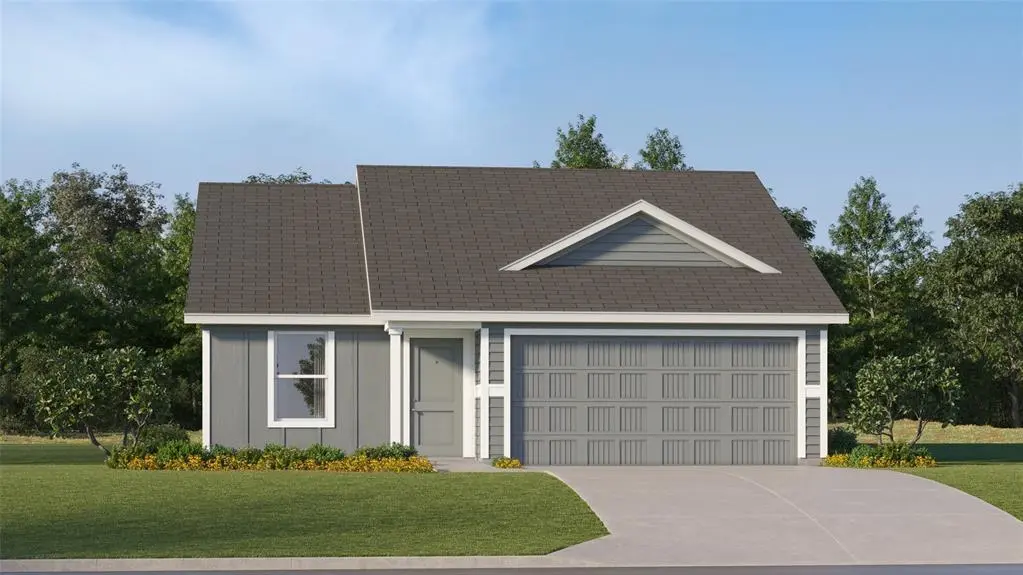
This new single-story design makes smart use of the space available. At the front are all three secondary bedrooms arranged near a convenient full-sized bathroom. Down the foyer is a modern layout connecting a peninsula-style kitchen made for inspired meals, an intimate dining area and a family room ideal for gatherings. Tucked in a quiet corner is the owner’s suite with an attached bathroom and walk-in closet.
Key facts
- 5,500 sq ft lot
- 2 garage spots
- Built 2026
Property features AI
Finance
- Other: Green/energy-efficient features including enhanced attic insulation, efficient appliances, insulated doors and windows, low-flow commode, rain/freeze sensors, programmable thermostat and efficient water heater
- Financial info: Listing accepts Cash, Conventional, FHA and VA financing
- HOA & community: Mandatory HOA; Annual association fee with management by Legacy Southwest; Association covers front yard maintenance and management fees
Exterior
- Parking: Attached 2-car garage (garage width ~20 ft, length ~18 ft); 2 covered parking spaces
- Security: Prewired security features with smoke detectors, carbon monoxide detectors and fire alarm
- Utilities: City water and city sewer; Concrete roads, curbs and sidewalks; Not in a municipal utility district
- Home design: Single family residence; One-story entry with additional upstairs bedrooms (one level listed as One); New construction (incomplete) built in 2026; Property faces front (garage faces front)
- Construction: Brick, siding and other exterior materials; Composition roof; Slab foundation
- Exterior features: Covered porch(es); Gutters; Wood fencing; Corner lot with landscaping; Large backyard with grass; Sprinkler system; Subdivision location
Interior
- Kitchen: Dishwasher; Disposal; Electric oven; Gas cooktop; Microwave; Double oven; Kitchen plumbed for gas; Water line to refrigerator
- Bedrooms: 4 bedrooms (primary on first floor; two bedrooms on second floor); Primary bedroom includes dual sinks, garden tub, separate vanities, linen closet, and walk-in closet(s)
- Flooring: Carpet; Ceramic tile; Other flooring types
- Bathrooms: 2 full bathrooms and 1 half bathroom
- Heating & cooling: Central heating; Central air with zoned system; Ceiling fans
- Interior features: Built-in features and decorative lighting; Kitchen island and walk-in pantry; Open floor plan; Smart home system and sound system wiring; Walk-in closets; Pantry
- Laundry & utility: Tankless water heater
Neighborhood map
What this means for you Summary
Snapshot
- This is a 4-bed/2.5-bath other listed at $286k. Condition is rated good.
Deal economics
- At list price, monthly cash flow is $46 ($548/yr) — positive.
- The deal already cash-flows at list — no discount required.
- To meet the 1% rule (rent ≥ 1% of price), the offer needs to be $230k (19.7% below list).
- Recommended offer: $230k (19.7% below list) — sets the bar for 1% rule.
- Cap rate 6.5% vs local median 3.9% in Fort Worth — top-decile yield for the area; either an underpriced asset or a hidden risk that comps aren't pricing in. Stress-test before assuming the spread holds.
Location & tenants
- Location reads 80/100 on livability (#49 in TX, #1,954 nationally) — a professional / high-income tenant draw. Strengths: amenities A+, cost of living A+, housing A+; Watch: crime F.
- Eagle Mt-Saginaw ISD (urban): math 35% / reading 42% proficiency, ranked #361 of 826 in TX (top 44%) — families likely to look elsewhere, expect single-tenant / working-renter base with shorter leases.
- Zoned schools: Bryson El (math 23% / reading 27%, grade F, #3,013 of 4,322 statewide, top 70%, 547 students, 63% FRL); Creekview Middle (math 52% / reading 55%, grade C+, #275 of 1,662 statewide, top 17%, 844 students, 50% FRL); Chisholm Trail H S (math 27% / reading 55%, grade F, #774 of 1,632 statewide, top 49%, 2,493 students, 48% FRL) — zoned schools average 54% FRL vs 36% district-wide (18 pts higher); higher-poverty schools than district average — tighter screening recommended.
- Market conditions: Rents rising (+1.5%/yr); 1074 active listings in the ZIP; 40 comparable units currently listed for rent nearby; rentals at typical pace (median 23d on market — plan ~3-4 weeks tenant-placement turnaround); solid renter incomes; 18,938 units permitted in Tarrant County in 2024 (8,336 in 5+ unit buildings).
Forward outlook
- Local home prices are declining (-3.0%/yr); year-one equity from $2k of loan paydown is wiped out by about $9k of value loss. Plan a longer hold.
- Tarrant County population projected at +41% by 2050 — long-run rental-demand tailwind backs the buy-and-hold thesis.
Negotiation context
- Only 3 days on market — expect competitive offers; lowballing is unlikely to land.
Risks & watch-outs
- Climate carrying-cost: major wind risk, 27% chance of damaging wind over 30y; extreme-heat days projected 6→19/yr by 2055 (HVAC capex compounding) — expect insurance premiums to compound above CPI over the hold.
Questions for the listing agent
- What does the HOA fee cover, when was the last increase, and are there any pending special assessments or reserve-fund shortfalls?
- Is there a deadline driving the sale (1031 exchange, divorce, estate, relocation)? That informs how much negotiation room exists.
- Schools are D-rated, which usually means shorter tenancies and higher turnover. Who's the typical renter profile here, and what's been the actual vacancy rate?
- Crime grade is F in this area — have there been break-ins, vandalism, or insurance claims at this property in the last 3 years? What carrier currently insures it and at what premium?
- The area grade is low — what's the realistic commute time and amenity access for the typical tenant pool here? Any planned neighborhood developments (good or bad) we should know about?
- What's the average days-on-market for RENTAL listings here right now (not sales)? A rising rental-DOM trend means longer vacancies and softer asking-rent achievability than the comps imply.
- What's the recent tenant-quality profile in this submarket — average credit score on applications, eviction rate, late-payment / NSF rate, and stable-employment percentage? A property-management company in the area should have these aggregated.
- How much new for-sale + rental construction is in the pipeline within 1–3 miles? Heavy new supply typically softens prices + rents 12–24 months out; constrained supply supports both.
Investment metrics
- 1% rule
- 0.80% ✗
- Cap rate
- 6.48%
- Cash-on-cash
- 0.68%
- DSCR
- 1.03
- GRM
- 10.4
CMA / ARV
No comps found within radius.
Projected returns pro-forma
-3.0% appreciation · 1.51% rent growth · sell at horizon
- IRR
- -16.8%
- Equity multiple
- 0.41×
- Total profit
- $-46,920
- Equity at exit
- $42,643
- IRR
- -11.3%
- Equity multiple
- 0.36×
- Total profit
- $-50,997
- Equity at exit
- $24,728
Cash invested: $80,080 (down + closing). Projections, not guarantees.
Landlord ↔ Tenant lean methodology
- Overall (STATE)
- 87 Strongly Landlord-Friendly
- State Texas
- 87 Strongly Landlord-Friendly · R+5
- County
- — inherits STATE
- City
- — inherits STATE
ZIP-level market 76179
- Rents YoY
- 1.5%
- Active inventory
- 1074
- Price-to-rent
- 10.4×
Monthly cashflow live
- Estimated rent
- $2,296 high interval (Pro) →
- Mortgage (P&I)
- −$1,500
- Tax from tax record
- −$91 /mo · $1,095/yr
- Insurance
- −$119
- HOA
- −$58
- Vacancy / Maint / Mgmt
- −$482
- Net cashflow
- $46
Break-even live
Sensitivity live
| Price | -10% $208 | -5% $127 | +0% $46 | +5% $-35 | +10% $-116 |
|---|---|---|---|---|---|
| Rent | -10% $-136 | -5% $-45 | +0% $46 | +5% $136 | +10% $227 |
| Rate | -1.0pp $190 | -0.5pp $118 | base $46 | +0.5pp $-28 | +1.0pp $-104 |
UW: 25.0% down · 7.5% · 30yr · 1.5% tax · 5.0% vac · 8.0% maint · 8.0% mgmt
Financing live
Cash to close
- Down payment
- $71,500
- Closing costs
- $8,580
- Reserves months
- —
- Total cash needed
- —
Loan-product check · same deal, 3 products live
Conventional
25% down · 7.5% · 30yr
- Down + closing
- —
- Monthly P&I
- —
- Monthly cashflow
- —
- DSCR
- —
- Eligible?
- —
Personal DTI + credit; lowest rate.
DSCR
20% down · 8.5% · 30yr
- Down + closing
- —
- Monthly P&I
- —
- Monthly cashflow
- —
- DSCR
- —
- Eligible?
- —
No personal income docs; deal must DSCR.
Hard money
10% down · 12.0% · 12mo
- Down + closing
- —
- Monthly P&I
- —
- Monthly cashflow
- —
- DSCR
- —
- Eligible?
- —
Short-term bridge; refi at stabilization.
Rent comps 40 comps
| Address | Beds | Baths | Sqft | Rent | $/sqft | DOM | Units | Dist |
|---|---|---|---|---|---|---|---|---|
| 4900 Old Ember Ln Fort Worth, TX | 3.0 | 2.0 | 1260 | $1,500 | $1.19 | 9d | 1 | 0.31mi |
| 6848 Valley Creek Dr Fort Worth, TX | 3.0 | 2.0 | 1537 | $1,875 | $1.22 | 1d | 1 | 0.38mi |
| 4964 Creek Ridge Trl Fort Worth, TX | 3.0 | 2.5 | 2177 | $2,140 | $0.98 | 24d | 1 | 0.38mi |
| 8261 Bufflehead Dr Fort Worth, TX | 4.0 | 2.0 | 1883 | $2,295 | $1.22 | 26d | 1 | 0.44mi |
| 8249 Muscovy Dr Fort Worth, TX | 4.0 | 2.5 | 2095 | $2,599 | $1.24 | 17d | 1 | 0.44mi |
| 6824 Turtle Stream Dr Fort Worth, TX | 3.0 | 2.0 | 1575 | $1,925 | $1.22 | 1d | 1 | 0.45mi |
| 4725 Harlequin Dr Fort Worth, TX | 3.0 | 2.0 | 1636 | $2,250 | $1.38 | 7d | 1 | 0.45mi |
| 6812 Valley Creek Dr Fort Worth, TX | 4.0 | 2.0 | 1764 | $1,950 | $1.11 | 22d | 1 | 0.45mi |
| 4705 Harlequin Dr Fort Worth, TX | 4.0 | 2.0 | 1721 | $2,300 | $1.34 | 26d | 1 | 0.50mi |
| 4900 Bass Dr Fort Worth, TX | 4.0 | 3.0 | 1910 | $2,700 | $1.41 | 22d | 1 | 0.51mi |
| 5344 Brahma Trl Fort Worth, TX | 3.0 | 2.0 | 1720 | $2,195 | $1.28 | 9d | 1 | 0.51mi |
| 5344 Brahma Trl Fort Worth, TX | 3.0 | 2.0 | 1720 | $2,295 | $1.33 | 26d | 1 | 0.51mi |
| 6933 Meadow Way Ln Fort Worth, TX | 4.0 | 2.5 | 1942 | $2,021 | $1.04 | 24d | 1 | 0.53mi |
| 6933 Meadow Way Ln Fort Worth, TX | 4.0 | 2.5 | 1942 | $1,955 | $1.01 | 22d | 1 | 0.53mi |
| 5100 Waterford Dr Fort Worth, TX | 3.0 | 2.5 | 1848 | $1,850 | $1.00 | 26d | 1 | 0.60mi |
| 5008 Waterford Dr Fort Worth, TX | 4.0 | 2.5 | 1972 | $2,100 | $1.06 | 5d | 1 | 0.61mi |
| 5008 Waterford Dr Fort Worth, TX | 4.0 | 2.5 | 1972 | $2,100 | $1.06 | 26d | 1 | 0.61mi |
| 4545 Waterford Dr Fort Worth, TX | 4.0 | 2.5 | 1960 | $2,086 | $1.06 | 14d | 1 | 0.61mi |
| 6701 Meadow Way Ln Fort Worth, TX | 4.0 | 2.0 | 1532 | $1,950 | $1.27 | 24d | 1 | 0.62mi |
| 8205 Buck Mountain Pass Fort Worth, TX | 3.0 | 2.0 | 1316 | $1,995 | $1.52 | 14d | 1 | 0.63mi |
| 6521 Trident Ct Fort Worth, TX | 4.0 | 2.0 | 1802 | $2,195 | $1.22 | 1d | 1 | 0.64mi |
| 4937 Waterford Dr Fort Worth, TX | 3.0 | 2.5 | 1810 | $1,879 | $1.04 | 26d | 1 | 0.65mi |
| 8204 Buck Mountain Pass Fort Worth, TX | 3.0 | 2.0 | 1638 | $2,100 | $1.28 | 4d | 1 | 0.65mi |
| 8348 Hawkview Dr Fort Worth, TX | 4.0 | 2.5 | 2121 | $3,000 | $1.41 | 14d | 1 | 0.66mi |
| 5824 Heatherglen Ter Fort Worth, TX | 3.0 | 2.0 | 1297 | $1,865 | $1.44 | 7d | 1 | 0.66mi |
| 4921 Waterford Dr Fort Worth, TX | 4.0 | 2.5 | 1975 | $1,200 | $0.61 | 1d | 1 | 0.66mi |
| 4749 Swan Neck Dr Fort Worth, TX | 4.0 | 2.0 | 1802 | $2,200 | $1.22 | 1d | 1 | 0.67mi |
| 6433 Riverwater Trl Fort Worth, TX | 3.0 | 2.0 | 1150 | $2,100 | $1.83 | 26d | 1 | 0.71mi |
| 8320 Buck Mountain Pass Fort Worth, TX | 3.0 | 2.0 | 1316 | $1,999 | $1.52 | 1d | 1 | 0.72mi |
| 5612 Northfield Dr Fort Worth, TX | 3.0 | 2.0 | 1336 | $1,983 | $1.48 | 1d | 1 | 0.74mi |
| 5725 Northfield Dr Fort Worth, TX | 3.0 | 2.0 | 1275 | $1,860 | $1.46 | 22d | 1 | 0.75mi |
| 8408 Buck Mountain Pass Fort Worth, TX | 4.0 | 2.5 | 2131 | $2,375 | $1.11 | 26d | 1 | 0.75mi |
| 8453 Shallow Creek Dr Fort Worth, TX | 3.0 | 2.5 | 1947 | $2,195 | $1.13 | 9d | 1 | 0.75mi |
| 8453 Shallow Creek Dr Fort Worth, TX | 3.0 | 3.0 | 1947 | $2,195 | $1.13 | 26d | 1 | 0.75mi |
| 6409 Riverwater Trl Fort Worth, TX | 3.0 | 2.0 | 1461 | $1,900 | $1.30 | 1d | 1 | 0.75mi |
| 5800 Stone Meadow Ln Fort Worth, TX | 3.0 | 2.0 | 1574 | $1,925 | $1.22 | 26d | 1 | 0.76mi |
| 7656 Northumberland Dr Fort Worth, TX | 3.0 | 2.0 | 2007 | $2,325 | $1.16 | 24d | 1 | 0.77mi |
| 5716 Stone Meadow Ln Fort Worth, TX | 3.0 | 2.0 | 1356 | $2,135 | $1.57 | 26d | 1 | 0.77mi |
| 5816 Stone Meadow Ln Fort Worth, TX | 3.0 | 2.0 | 1608 | $2,095 | $1.30 | 26d | 1 | 0.77mi |
| 5620 Stone Meadow Ln Fort Worth, TX | 3.0 | 2.0 | 1292 | $1,950 | $1.51 | 26d | 1 | 0.78mi |
HOA detail
- Monthly dues
- $58 · $696/yr
Listing history 2 events
-
2026-05-09status Pending
-
2026-05-06$285,999 Active
ⓘ Source: listings_history table (triggers on properties + properties_extension) + one-shot
backfill from property_details.listing_events for pre-trigger history.
Tax reassessment forecast TX · Resets to sale price
- Current annual tax
- $1,095 · $91/mo
- Projected year-2 tax
- $5,234 · $436/mo
- Expected delta
- +$4,139/yr (+$345/mo · 378.2%)
ⓘ Screening estimate from a state-policy table — verify with the county assessor before closing.
Climate risk First Street
- Flood 1/10 Low FEMA zone X (unshaded) · 0% chance over 30 yrs
- Wildfire 4/10 Moderate
- Heat 7/10 Severe 6 d/yr ≥109°F today · 19 d/yr by 30 yrs out
- Wind 6/10 Major 27% chance of damaging wind over 30 yrs
- Air quality 2/10 Low 1 unhealthy d/yr today · 2 by 30 yrs out
Nearby sold comps map
Loading sold comps map…
Walkable amenities ~0.75 mi
Loading nearby amenities…
Taxation est. · year 1
- Rental income
- $27,553
- − Mortgage interest
- −$16,020
- − Property taxes
- −$1,095
- − Insurance
- −$1,430
- − Repairs & maintenance
- −$2,204
- − Management
- −$2,204
- − HOA
- −$696
- − Depreciation
- −$8,320
- Taxable loss
- −$4,417
- Est. tax savings @ 24.0%
- +$1,060
- After-tax cash flow
- $1,608/yr
For passive investors: Depreciation is non-cash, so a rental often shows a tax loss while cash-flowing — sheltering income. Rental losses are passive: they offset passive income freely, and up to $25,000/yr can offset ordinary (W-2) income if you actively participate and your MAGI is under $100k (phasing out to $0 by $150k); unused losses carry forward. On sale, claimed depreciation is recaptured at up to 25%, and gains may owe capital-gains tax (a 1031 exchange can defer both). Figures are a year-1 estimate at your 24.0% rate — not tax advice; consult a CPA.
Condition & rehab AI · 1 photo
This single-story home is in excellent condition with no visible repairs needed. It offers a good return on investment with updates that can significantly increase its resale and rental value.
Value-add opportunities
- Both Painting exterior and interior — Fresh paint enhances curb appeal and interior aesthetics
- Both Landscaping improvements — Enhances curb appeal and adds value
- Resale Kitchen appliances — Modern appliances improve functionality and attract buyers
- Resale Bathroom fixtures — Upgraded fixtures enhance the bathroom's appeal and functionality
Renovation cost estimate screening
Value-add ROI direction
- Both Painting exterior and interior — Fresh paint enhances curb appeal and interior aesthetics ↑
- Both Landscaping improvements — Enhances curb appeal and adds value ↑
- Resale Kitchen appliances — Modern appliances improve functionality and attract buyers ↑
- Resale Bathroom fixtures — Upgraded fixtures enhance the bathroom's appeal and functionality ↑
ⓘ Cost ranges are severity-bucket heuristics (US national rule-of-thumb). Get contractor quotes + a written scope before underwriting a rehab budget.
Schools (NCES district)
- District
- Eagle Mt-Saginaw ISD
- NCES district ID
- 4817700
- Math proficiency
- 35% ▼ -16.00%
- Reading proficiency
- 42% ▼ -9.00%
- Median HH income
- $72,781
- Composite
- 35.41/100
- National rank
- #4945
- State rank
- #361 of 826 in TX
Livability — Fort Worth
- Score
- 80/100
- State rank
- #49
- US rank
- #1954
Category grades
Schools grade is shown separately in the Schools card above.
Census & demographics
- Census place
- Fort Worth, TX
- County
- Tarrant County · 2,033,669 people
- City population
- 911,619
- Metro
- Dallas-Fort Worth-Arlington, TX
- Population (ZIP)
- 80,090
- Household income
- $107,428
- Rent vs Own
- Severe rent burden
- 1494.0
Population outlook (Tarrant County) Hauer SSP2
- Today (2025)
- 2,380,417 people
- By 2030
- 2,578,900 · +8.3%
- By 2040
- 2,974,995 · +25.0%
- By 2050
- 3,350,489 · +40.8%
- By 2075
- 4,216,909 · +77.2%
- By 2100
- 4,741,527 · +99.2%
Race, ethnicity, and origin ACS 2023
- Neighborhood character
- Diverse neighborhood (Simpson 0.63)
- Race & ethnicity
- White 53% Hispanic / Latino 28% Two or more races 14% Black 12% Asian 4%
- Hispanic origin (detail)
- Mexican 22% Puerto Rican 2%
- Common ancestry
- Slovak 2% Lithuanian 2% Italian 1%
- Foreign-born
- 8% · Canada, Jamaica
- Languages at home
- 81% English-only · Spanish 15% Other Asian/Pacific 2% Other Indo-European 1%
Political lean MEDSL · Tarrant
- 2024 margin
- Lean R (+5.1) · D 46.7% · R 51.9% · Other 1.4%
- 2008→2024 swing
- +6.6pp toward D · 2008: -11.7pp · 2024: -5.1pp
- All cycles
- 2024: R+5.1 2020: D+0.2 2016: R+8.7 2012: R+15.7 2008: R+11.7
Not yet ingested
- Civics
- —
Market trends
- HPI YoY
- ▼ -137.12%
- Current HPI
- 237.6676
- Rent YoY
- ▲ 1.51%
- Metro
- Dallas-Fort Worth-Arlington, TX
- State GDP YoY
- ▲ 3.95%
- F500 in state
- 110
Industry mix (Fortune 500 HQ in TX)
| Industry | F500 HQs | Revenue |
|---|---|---|
| Energy | 16 | $1,198B |
|
||
| Technology | 5 | $198B |
|
||
| Engineering / Construction | 4 | $72B |
|
||
| Energy Services | 3 | $60B |
|
||
| Utilities | 3 | $41B |
|
||
| Healthcare | 2 | $330B |
|
||
Price history
2 events — show timeline
- 2026-05-09 Pending — NTREIS
- 2026-05-06 Listed $285,999 NTREIS
Cash-flow waterfall
monthlySold comps — $/sqft
last 12 mo · ≤1 miLoading sold comps…