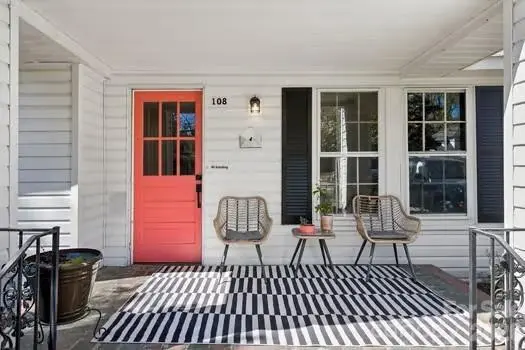
108 Faulkner St · Clover, SC
Flood risk 1/10 · Minimal
- FEMA flood zone
- X (unshaded)
- Chance of flooding over 30 yrs
- 0.0%
- Est. flood insurance / yr
- $507 – $1,088
Fire risk 3/10 · Minor
- Est. fire insurance / yr
- $783 – $1,453
Heat risk 6/10 · Moderate
- Hot days now (above 104°F)
- 7 days/yr
- Hot days in 30 yrs
- 16 days/yr
Wind risk 5/10 · Moderate
- Chance of severe wind over 30 yrs
- 22.0%
Air-quality risk 3/10 · Minor
- Unhealthy air days now
- 2 days/yr
- Unhealthy air days in 30 yrs
- 3 days/yr
Risk factors via First Street. Map © Google.
Why this score? — see what drove the D grade
The composite is a weighted blend of 9 inputs, each scored 0–100. Each bar is that input's sub-score; the figure is the points it added to the 100-point composite (weight × sub-score).
- Cash flow +12.7/30.0
- ARV discount +9.3/15.0
- Schools +5.4/10.0
- DSCR +3.8/10.0
- Livability +3.5/5.0
- 1% rule +2.8/10.0
- Rent growth +2.7/5.0
- Condition / age +2.5/5.0
- Appreciation +0.0/10.0
$274,000
🖨 Deal sheet (PDF) 📄 Offer letter ✓ Due diligence
Listing remarks MLS
Clean, move-in ready home in the heart of Clover! Renovated kitchen, includes subway tile backsplash, granite countertops, new cabinets, new tile floor, new dishwasher, new farm sink, disposal, new dry wall and ceiling with recess lighting. Refinished hardwood floors throughout in 2016.Deck can be accessed through back bedroom and kitchen. Large wired workshop, and wired shed. New ceiling fans and chandeliers. Brand new gas logs in living room! Walkable to elementary school in neighborhood and Main Street.
Key facts
- 0.48 acre lot
- Built 1950
- Listed 63 days
Property features AI
Finance
- HOA & community: No HOA
Exterior
- Parking: Driveway
- Utilities: City water; Public sewer; Cable available; Electricity connected; Wired internet available; Publicly maintained paved road access
- Home design: Single-family residential property; One story; Entry level: Main; Zoned R
- Construction: Site-built construction; Vinyl exterior; Crawl space foundation; Shingle roof
- Exterior features: Covered patio/porch; Deck; Front porch; Back yard fencing; Shed(s)
Interior
- Kitchen: Dishwasher; Electric range; Refrigerator
- Bedrooms: 3 bedrooms on the main level
- Flooring: Wood flooring
- Bathrooms: 1 full bathroom on the main level
- Heating & cooling: Heat pump heating; Central air conditioning
- Interior features: 9 total rooms; Gas log fireplace in the living room
- Laundry & utility: Washer and dryer (located in the kitchen)
Neighborhood map
What this means for you Summary
Snapshot
- This is a 3-bed/1.0-bath single-family listed at $274k.
Deal economics
- At list price, monthly cash flow is $-32 ($-381/yr) — negative.
- To cash-flow at today's rent, offer at most $268k (2.0% below list).
- To meet the 1% rule (rent ≥ 1% of price), the offer needs to be $214k (21.9% below list).
- Recommended offer: $214k (21.9% below list) — sets the bar for 1% rule.
- Cap rate 6.2% vs local median 4.2% in Clover — top-decile yield for the area; either an underpriced asset or a hidden risk that comps aren't pricing in. Stress-test before assuming the spread holds.
Location & tenants
- Location reads 70/100 on livability (#63 in SC) — a middle-class / working-renter tenant base. Strengths: cost of living A+, housing A+, crime A; Watch: health & safety D+, employment D, amenities F.
- York 02 (rural): math 61% / reading 63% proficiency, ranked #2 of 80 in SC (top 2%) — acceptable for families but not a draw, mixed tenant base, ~2y average lease.
- Zoned schools: Kinard Elementary (math 47% / reading 42%, grade F, #226 of 597 statewide, top 40%, 441 students, 61% FRL); Clover Middle (math 44% / reading 49%, grade D+, #44 of 229 statewide, top 19%, 988 students, 52% FRL); Clover High (math 86% / reading 94%, grade A+, #4 of 196 statewide, top 2%, 2,685 students, 35% FRL) — zoned schools average 49% FRL vs 26% district-wide (24 pts higher); higher-poverty schools than district average — tighter screening recommended.
- Market conditions: Rents flat; 359 active listings in the ZIP; 5 comparable units currently listed for rent nearby; rentals leasing fast (median 4d on market — plan ~1-2 weeks tenant-placement turnaround); solid renter incomes; 2,550 units permitted in York County in 2024 (350 in 5+ unit buildings).
Forward outlook
- Local home prices are declining (-3.0%/yr); year-one equity from $2k of loan paydown is wiped out by about $8k of value loss. Plan a longer hold.
- York County population projected at +44% by 2050 — long-run rental-demand tailwind backs the buy-and-hold thesis.
Negotiation context
- It's been on market 63 days — a 6% lower offer ($258k) is reasonable based on typical stale-listing flexibility.
- 4 sale attempts since 10y ago; this cycle's ask has dropped $16k (6%) from the opening price — seller is motivated, your offer sets the floor, not the list.
- Current owner paid $190k; 44% above their basis — modest negotiation headroom, anchor on the comps not their cost.
Risks & watch-outs
- Watch-outs: built in 1950 — expect roof / HVAC / electrical / plumbing capex.
- Climate carrying-cost: moderate wind risk, 22% chance of damaging wind over 30y; extreme-heat days projected 7→16/yr by 2055 (HVAC capex compounding) — expect insurance premiums to compound above CPI over the hold.
Questions for the listing agent
- What do current leases actually rent for vs. the listed asking? Can we see a recent rent roll and the last 12 months of T-12 income?
- It's been on market 63 days. Have you received any prior offers? Is the seller open to a 22% concession, seller financing, or rate buy-down credit?
- Built in 1950 — when were the roof, HVAC, electrical panel, plumbing, and water heater last replaced?
- Why hasn't it sold? Are there any deal-killer items the seller is aware of (foundation, flood, title, zoning, code violations)?
- Is there a deadline driving the sale (1031 exchange, divorce, estate, relocation)? That informs how much negotiation room exists.
- The area grade is low — what's the realistic commute time and amenity access for the typical tenant pool here? Any planned neighborhood developments (good or bad) we should know about?
- What's the average days-on-market for RENTAL listings here right now (not sales)? A rising rental-DOM trend means longer vacancies and softer asking-rent achievability than the comps imply.
- What's the recent tenant-quality profile in this submarket — average credit score on applications, eviction rate, late-payment / NSF rate, and stable-employment percentage? A property-management company in the area should have these aggregated.
- How much new for-sale + rental construction is in the pipeline within 1–3 miles? Heavy new supply typically softens prices + rents 12–24 months out; constrained supply supports both.
Investment metrics
- 1% rule
- 0.78% ✗
- Cap rate
- 6.15%
- Cash-on-cash
- -0.50%
- DSCR
- 0.98
- GRM
- 10.7
CMA / ARV
- ARV (on-the-fly)
- $285,694
- Comps found
- 12
Show comp detail 12 sales within ~0.75 mi
| Address | Dist | Beds/Ba | Sqft | Sold | Price | $/sf | Match |
|---|---|---|---|---|---|---|---|
| 409 Stokes Ave | 0.32mi | 3/2.0 | 1,300 (-4%) | 8mo | $300,000 | $231 | 68 |
| 210 Smith St | 0.10mi | 2/1.0 (-1) | 1,535 (+13%) | 5mo | $295,000 | $192 | 64 |
| 603 Old North Main St | 0.74mi | 3/2.0 | 1,298 (-4%) | 0mo | $215,700 | $166 | 54 |
| 105 Valley Ave | 0.51mi | 3/2.0 | 1,284 (-5%) | 11mo | $213,000 | $166 | 54 |
| 251 Final Stretch Ln | 0.68mi | 3/2.5 | 1,414 (+4%) | 3mo | $299,000 | $211 | 52 |
| 2001 Roscommon Dr | 0.44mi | 3/2.0 | 1,192 (-12%) | 5mo | $251,500 | $211 | 52 |
| 102 Ridge Ave | 0.31mi | 3/2.0 | 1,555 (+15%) | 9mo | $376,000 | $242 | 49 |
| 909 S Main St | 0.64mi | 2/1.5 (-1) | 1,440 (+6%) | 5mo | $275,000 | $191 | 49 |
| 526 Pennyfields Ln | 0.53mi | 3/2.0 | 1,209 (-11%) | 7mo | $281,000 | $232 | 47 |
| 124 Marion St | 0.64mi | 3/2.0 | 1,439 (+6%) | 11mo | $325,000 | $226 | 47 |
| 104 Maple St | 0.57mi | 3/2.0 | 1,154 (-15%) | 2mo | $224,900 | $195 | 43 |
| 103 Fairview St | 0.67mi | 2/2.0 (-1) | 1,184 (-13%) | 6mo | $170,000 | $144 | 33 |
Match score weights: distance 35% · size 25% · config 20% · recency 20%. Top-matched comps best support the ARV.
Projected returns pro-forma
-3.0% appreciation · 0.88% rent growth · sell at horizon
- IRR
- -19.3%
- Equity multiple
- 0.34×
- Total profit
- $-50,963
- Equity at exit
- $40,854
- IRR
- -16.7%
- Equity multiple
- 0.15×
- Total profit
- $-64,854
- Equity at exit
- $23,691
Cash invested: $76,720 (down + closing). Projections, not guarantees.
Landlord ↔ Tenant lean methodology
- Overall (STATE)
- 90 Strongly Landlord-Friendly
- State South Carolina
- 90 Strongly Landlord-Friendly · R+6
- County
- — inherits STATE
- City
- — inherits STATE
ZIP-level market 29710
- Rents YoY
- 0.9%
- Active inventory
- 359
- Price-to-rent
- 10.7×
Monthly cashflow live
- Estimated rent
- $2,140 high interval (Pro) →
- Mortgage (P&I)
- −$1,437
- Tax from tax record
- −$171 /mo · $2,052/yr
- Insurance
- −$114
- HOA
- −$0
- Lot rent
- −$0
- Vacancy / Maint / Mgmt
- −$449
- Net cashflow
- $-32
Break-even live
Sensitivity live
| Price | -10% $123 | -5% $46 | +0% $-32 | +5% $-109 | +10% $-187 |
|---|---|---|---|---|---|
| Rent | -10% $-201 | -5% $-116 | +0% $-32 | +5% $53 | +10% $137 |
| Rate | -1.0pp $106 | -0.5pp $38 | base $-32 | +0.5pp $-103 | +1.0pp $-175 |
UW: 25.0% down · 7.5% · 30yr · 1.5% tax · 5.0% vac · 8.0% maint · 8.0% mgmt
Financing live
Cash to close
- Down payment
- $68,500
- Closing costs
- $8,220
- Reserves months
- —
- Total cash needed
- —
Loan-product check · same deal, 3 products live
Conventional
25% down · 7.5% · 30yr
- Down + closing
- —
- Monthly P&I
- —
- Monthly cashflow
- —
- DSCR
- —
- Eligible?
- —
Personal DTI + credit; lowest rate.
DSCR
20% down · 8.5% · 30yr
- Down + closing
- —
- Monthly P&I
- —
- Monthly cashflow
- —
- DSCR
- —
- Eligible?
- —
No personal income docs; deal must DSCR.
Hard money
10% down · 12.0% · 12mo
- Down + closing
- —
- Monthly P&I
- —
- Monthly cashflow
- —
- DSCR
- —
- Eligible?
- —
Short-term bridge; refi at stabilization.
Rent comps 5 comps
| Address | Beds | Baths | Sqft | Rent | $/sqft | DOM | Units | Dist |
|---|---|---|---|---|---|---|---|---|
| 1157 Faulkner Rd Unit Main Clover, SC | 3.0 | 2.0 | 1100 | $1,925 | $1.75 | 26d | 1 | 0.48mi |
| 142 Rockford Way Clover, SC | 1.0–3.0 | 1.0–2.0 | 969 | $1,702 | $1.76 | 0d | 1 | 0.52mi |
| 110 Willow St Clover, SC | 3.0 | 2.0 | 1300 | $1,835 | $1.41 | 26d | 1 | 0.67mi |
| 294 Zion Church Rd Clover, SC | 3.0 | 2.0 | 1596 | $2,295 | $1.44 | 4d | 1 | 0.92mi |
| 316 Zion Church Rd Clover, SC | 3.0 | 2.0 | 1500 | $2,295 | $1.53 | 4d | 1 | 0.92mi |
Listing history 21 events
-
2026-06-22days on market $274,000 Active 63 DOM
-
2026-06-21statusdays on market $274,000 Active 62 DOM
-
2026-06-01status $274,000 Pending 60 DOM
-
2026-05-31days on market $274,000 Active 60 DOM
-
2026-05-04price $274,000
-
2026-04-21price $279,000
-
2026-04-01$289,999 Active
-
2021-12-27soldstatus $190,000
-
2021-09-14price $199,000
-
2021-08-12price $209,900
-
2021-07-30price $215,000
-
2019-05-21soldstatus $164,000 Closed 513-char remark
Show marketing remark (513 chars)
Clean, move-in ready home in the heart of Clover! Renovated kitchen, includes subway tile backsplash, granite countertops, new cabinets, new tile floor, new dishwasher, new farm sink, disposal, new dry wall and ceiling with recess lighting. Refinished hardwood floors throughout in 2016.Deck can be accessed through back bedroom and kitchen. Large wired workshop, and wired shed. New ceiling fans and chandeliers. Brand new gas logs in living room! Walkable to elementary school in neighborhood and Main Street.
-
2019-04-05historical Under Contract - Show 513-char remark
Show marketing remark (513 chars)
Clean, move-in ready home in the heart of Clover! Renovated kitchen, includes subway tile backsplash, granite countertops, new cabinets, new tile floor, new dishwasher, new farm sink, disposal, new dry wall and ceiling with recess lighting. Refinished hardwood floors throughout in 2016.Deck can be accessed through back bedroom and kitchen. Large wired workshop, and wired shed. New ceiling fans and chandeliers. Brand new gas logs in living room! Walkable to elementary school in neighborhood and Main Street.
-
2019-04-02price $169,000 513-char remark
Show marketing remark (513 chars)
Clean, move-in ready home in the heart of Clover! Renovated kitchen, includes subway tile backsplash, granite countertops, new cabinets, new tile floor, new dishwasher, new farm sink, disposal, new dry wall and ceiling with recess lighting. Refinished hardwood floors throughout in 2016.Deck can be accessed through back bedroom and kitchen. Large wired workshop, and wired shed. New ceiling fans and chandeliers. Brand new gas logs in living room! Walkable to elementary school in neighborhood and Main Street.
-
2019-03-26$179,000 Active 513-char remark
Show marketing remark (513 chars)
Clean, move-in ready home in the heart of Clover! Renovated kitchen, includes subway tile backsplash, granite countertops, new cabinets, new tile floor, new dishwasher, new farm sink, disposal, new dry wall and ceiling with recess lighting. Refinished hardwood floors throughout in 2016.Deck can be accessed through back bedroom and kitchen. Large wired workshop, and wired shed. New ceiling fans and chandeliers. Brand new gas logs in living room! Walkable to elementary school in neighborhood and Main Street.
-
2016-09-19soldstatus $125,000
-
2016-09-16soldstatus $125,000 Closed
-
2016-07-31historical Under Contract - Show
-
2016-07-29status Active
-
2016-07-12historical Under Contract - Show
-
2016-07-11$129,000 Active
ⓘ Source: listings_history table (triggers on properties + properties_extension) + one-shot
backfill from property_details.listing_events for pre-trigger history.
Tax reassessment forecast SC · Resets to sale price
- Current annual tax
- $2,052 · $171/mo
- Projected year-2 tax
- $2,052 · $171/mo
- Expected delta
- $0/yr ($0/mo · 0.0%)
ⓘ Screening estimate from a state-policy table — verify with the county assessor before closing.
Climate risk First Street
- Flood 1/10 Low FEMA zone X (unshaded) · 0% chance over 30 yrs
- Wildfire 3/10 Moderate
- Heat 6/10 Major 7 d/yr ≥104°F today · 16 d/yr by 30 yrs out
- Wind 5/10 Major 22% chance of damaging wind over 30 yrs
- Air quality 3/10 Moderate 2 unhealthy d/yr today · 3 by 30 yrs out
Nearby sold comps map
Loading sold comps map…
Walkable amenities ~0.75 mi
Loading nearby amenities…
Taxation est. · year 1
- Rental income
- $25,676
- − Mortgage interest
- −$15,348
- − Property taxes
- −$2,052
- − Insurance
- −$1,370
- − Repairs & maintenance
- −$2,054
- − Management
- −$2,054
- − Depreciation
- −$7,971
- Taxable loss
- −$5,173
- Est. tax savings @ 24.0%
- +$1,242
- After-tax cash flow
- $861/yr
For passive investors: Depreciation is non-cash, so a rental often shows a tax loss while cash-flowing — sheltering income. Rental losses are passive: they offset passive income freely, and up to $25,000/yr can offset ordinary (W-2) income if you actively participate and your MAGI is under $100k (phasing out to $0 by $150k); unused losses carry forward. On sale, claimed depreciation is recaptured at up to 25%, and gains may owe capital-gains tax (a 1031 exchange can defer both). Figures are a year-1 estimate at your 24.0% rate — not tax advice; consult a CPA.
Schools (NCES district)
- District
- York 02
- NCES district ID
- 4503840
- Math proficiency
- 61% ▼ -4.00%
- Reading proficiency
- 63% ▲ 3.00%
- Median HH income
- $60,598
- Composite
- 53.74/100
- National rank
- #1421
- State rank
- #2 of 80 in SC
Livability — Clover
- Score
- 70/100
- State rank
- #63
- US rank
- #7672
Category grades
Schools grade is shown separately in the Schools card above.
Census & demographics
- Census place
- Clover, SC
- County
- York County · 281,758 people
- City population
- 40,595
- Metro
- Charlotte-Concord-Gastonia, NC-SC
- Population (ZIP)
- 40,595
- Household income
- $96,563
- Rent vs Own
- Severe rent burden
- 569.0
Population outlook (York County) Hauer SSP2
- Today (2025)
- 307,757 people
- By 2030
- 335,979 · +9.2%
- By 2040
- 391,378 · +27.2%
- By 2050
- 443,234 · +44.0%
- By 2075
- 557,102 · +81.0%
- By 2100
- 625,837 · +103.4%
Race, ethnicity, and origin ACS 2023
- Neighborhood character
- Predominantly White (77%)
- Race & ethnicity
- White 77% Black 10% Hispanic / Latino 8% Two or more races 7%
- Hispanic origin (detail)
- Mexican 2% Cuban 1%
- Common ancestry
- Serbian 4% Slovak 3% Romanian 2%
- Foreign-born
- 4% · Canada, Jamaica
- Languages at home
- 94% English-only · Spanish 4% Other Indo-European 1%
Political lean MEDSL · York
- 2024 margin
- R (+19.1) · D 39.7% · R 58.8% · Other 1.5%
- 2008→2024 swing
- -1.4pp toward R · 2008: -17.7pp · 2024: -19.1pp
- All cycles
- 2024: R+19.1 2020: R+16.5 2016: R+22.1 2012: R+20.5 2008: R+17.7
Not yet ingested
- Civics
- —
Market trends
- HPI YoY
- ▼ -194.83%
- Current HPI
- 252.3011
- Rent YoY
- ▲ 0.88%
- Metro
- Charlotte-Concord-Gastonia, NC-SC
- State GDP YoY
- ▲ 4.51%
- F500 in state
- 2
Industry mix (Fortune 500 HQ in SC)
| Industry | F500 HQs | Revenue |
|---|---|---|
| Packaging | 1 | $7B |
|
||
Price history
+112.4% since first listed17 events — show timeline
- 2026-05-04 Price Changed $274,000 CANOPYMLS as Distributed by MLS Grid
- 2026-04-21 Price Changed $279,000 CANOPYMLS as Distributed by MLS Grid
- 2026-04-01 Listed $289,999 CANOPYMLS as Distributed by MLS Grid
- 2021-12-27 Sold (Public Records) $190,000 Public Records
- 2021-09-14 Price Changed $199,000 CANOPYMLS as Distributed by MLS Grid
- 2021-08-12 Price Changed $209,900 CANOPYMLS as Distributed by MLS Grid
- 2021-07-30 Price Changed $215,000 CANOPYMLS as Distributed by MLS Grid
- 2019-05-21 Sold (MLS) $164,000 CANOPYMLS as Distributed by MLS Grid
- 2019-04-05 Contingent — CANOPYMLS as Distributed by MLS Grid
- 2019-04-02 Price Changed $169,000 CANOPYMLS as Distributed by MLS Grid
- 2019-03-26 Listed $179,000 CANOPYMLS as Distributed by MLS Grid
- 2016-09-19 Sold (Public Records) $125,000 Public Records
- 2016-09-16 Sold (MLS) $125,000 CANOPYMLS as Distributed by MLS Grid
- 2016-07-31 Contingent — CANOPYMLS as Distributed by MLS Grid
- 2016-07-29 Relisted — CANOPYMLS as Distributed by MLS Grid
- 2016-07-12 Contingent — CANOPYMLS as Distributed by MLS Grid
- 2016-07-11 Listed $129,000 CANOPYMLS as Distributed by MLS Grid
Property tax history
+19.0%/yrLatest (2025): $2,052 · +8.5% YoY. Source: county tax records.
Cash-flow waterfall
monthlySold comps — $/sqft
last 12 mo · ≤1 miLoading sold comps…