26279 Colony Rd · Bonita Springs, FL
Flood risk 7/10 · Major
- FEMA flood zone
- AE
- Chance of flooding over 30 yrs
- 0.82%
- Est. flood insurance / yr
- $1,737 – $8,500
Fire risk 1/10 · Minimal
- Est. fire insurance / yr
- $947 – $1,759
Heat risk 9/10 · Severe
- Hot days now (above 107°F)
- 2 days/yr
- Hot days in 30 yrs
- 10 days/yr
Wind risk 10/10 · Severe
- Chance of severe wind over 30 yrs
- 99.0%
Air-quality risk 3/10 · Minor
- Unhealthy air days now
- 2 days/yr
- Unhealthy air days in 30 yrs
- 2 days/yr
Risk factors via First Street. Map © Google.
Why this score? — see what drove the C grade
The composite is a weighted blend of 9 inputs, each scored 0–100. Each bar is that input's sub-score; the figure is the points it added to the 100-point composite (weight × sub-score).
- Cash flow +26.4/30.0
- DSCR +9.0/10.0
- 1% rule +6.7/10.0
- Schools +4.1/10.0
- Livability +3.5/5.0
- ARV discount +3.3/15.0
- Condition / age +2.5/5.0
- Rent growth +2.3/5.0
- Appreciation +0.0/10.0
$238,000
🖨 Deal sheet 📄 Offer letter ✓ Due diligence
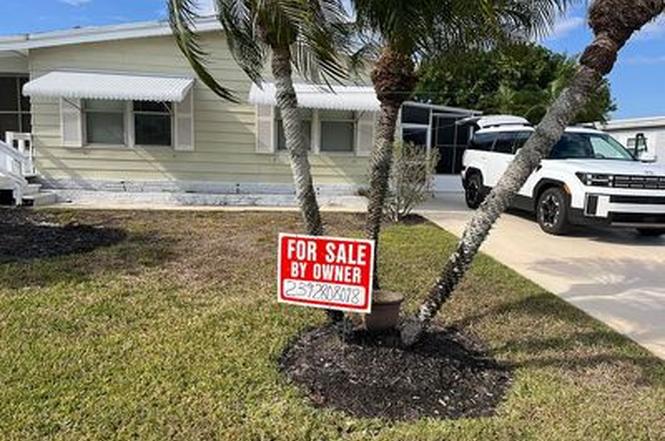
Listing remarks
This manufactured home 24 x48 feet is in great condition and has been very well maintained. 12x21 Lani & amp; sunroom. Furnished. It shows well and has great curb appeal. Located in the newer popular section of the park and is on a large lot. There are not a lot of homes for sale in Imperial Harbor at this time and this one is priced to sell. Do not wait!
Key facts
- Built 1983
Neighborhood map
What this means for you Summary
Snapshot
- This is a 2-bed/2.0-bath manufactured listed at $238k.
Deal economics
- At list price, monthly cash flow is $198 ($2k/yr) — positive.
- The deal already cash-flows at list — no discount required.
- Meets the 1% rule at list price ($3k rent vs $238k).
- Cap rate 9.4% vs local median 1.7% in Bonita Springs — top-decile yield for the area; either an underpriced asset or a hidden risk that comps aren't pricing in. Stress-test before assuming the spread holds.
Location & tenants
- Location reads 70/100 on livability (#428 in FL) — a middle-class / working-renter tenant base. Strengths: crime A+, housing A+, employment A; Watch: schools C-, cost of living C-, health & safety D.
- Lee (suburban): math 47% / reading 50% proficiency, ranked #42 of 73 in FL (top 58%) — families likely to look elsewhere, expect single-tenant / working-renter base with shorter leases.
- Market conditions: Rents soft (-0.6%/yr); 835 active listings in the ZIP; 40 comparable units currently listed for rent nearby; rentals at typical pace (median 24d on market — plan ~3-4 weeks tenant-placement turnaround); solid renter incomes; 15,411 units permitted in Lee County in 2024 (4,686 in 5+ unit buildings).
- This rent runs 37% of the median local income ($91k/yr) — at the standard rent-burdened threshold; future hikes will face affordability resistance.
Forward outlook
- Local home prices are declining (-3.0%/yr); year-one equity from $2k of loan paydown is wiped out by about $7k of value loss. Plan a longer hold.
- Lee County population projected at +44% by 2050 — long-run rental-demand tailwind backs the buy-and-hold thesis.
Negotiation context
- Only 0 days on market — expect competitive offers; lowballing is unlikely to land.
- Current owner paid $110k; list at $238k implies a 117% gain — meaningful room to come down on a strong offer.
Risks & watch-outs
- Watch-outs: flood insurance adds $427/mo.
- Climate carrying-cost: in FEMA flood zone AE (mandatory federal flood insurance); severe wind risk, 99% chance of damaging wind over 30y; extreme-heat days projected 2→10/yr by 2055 (HVAC capex compounding) — expect insurance premiums to compound above CPI over the hold.
Questions for the listing agent
- What's the actual annual flood-insurance premium (NFIP or private), and is the property in a SFHA with mandatory coverage?
- Is there a deadline driving the sale (1031 exchange, divorce, estate, relocation)? That informs how much negotiation room exists.
- What's the average days-on-market for RENTAL listings here right now (not sales)? A rising rental-DOM trend means longer vacancies and softer asking-rent achievability than the comps imply.
- What's the recent tenant-quality profile in this submarket — average credit score on applications, eviction rate, late-payment / NSF rate, and stable-employment percentage? A property-management company in the area should have these aggregated.
- How much new for-sale + rental construction is in the pipeline within 1–3 miles? Heavy new supply typically softens prices + rents 12–24 months out; constrained supply supports both.
Investment metrics
- 1% rule
- 1.17% ✓
- Cap rate
- 9.44%
- Cash-on-cash
- 11.24%
- DSCR
- 1.50
- GRM
- 7.1
CMA / ARV
- ARV (on-the-fly)
- $217,728
- Comps found
- 10
Show comp detail 10 sales within ~0.75 mi
| Address | Dist | Beds/Ba | Sqft | Sold | Price | $/sf | Match |
|---|---|---|---|---|---|---|---|
| 26236 Queen Mary Ln | 0.20mi | 2/2.0 | 1,072 (-7%) | 4mo | $230,000 | $215 | 75 |
| 26129 Countess Ln | 0.34mi | 2/2.0 | 1,056 (-8%) | 1mo | $179,000 | $170 | 69 |
| 26256 Imperial Harbor Blvd | 0.10mi | 2/2.0 | 1,320 (+15%) | 12mo | $225,000 | $170 | 61 |
| 26377 Colony Rd | 0.19mi | 2/2.0 | 1,273 (+10%) | 19mo | $249,000 | $196 | 57 |
| 26282 Princess Ln | 0.08mi | 2/1.5 | 1,000 (-13%) | 19mo | $140,000 | $140 | 56 |
| 10191 Wales Loop | 0.68mi | 2/2.0 | 1,152 (0%) | 15mo | $140,000 | $122 | 56 |
| 26931 Sammoset Way | 0.52mi | 2/2.0 | 1,177 (+2%) | 20mo | $279,900 | $238 | 55 |
| 26104 Kings Rd | 0.38mi | 2/2.0 | 1,056 (-8%) | 17mo | $215,000 | $204 | 54 |
| 26149 Kings Rd | 0.29mi | 2/2.0 | 1,056 (-8%) | 23mo | $200,000 | $189 | 54 |
| 26260 Bonita Fairways Cir | 0.45mi | 2/2.0 | 1,277 (+11%) | 24mo | $235,000 | $184 | 41 |
Match score weights: distance 35% · size 25% · config 20% · recency 20%. Top-matched comps best support the ARV.
Projected returns pro-forma
-3.0% appreciation · 0.0% rent growth · sell at horizon
- IRR
- -14.7%
- Equity multiple
- 0.49×
- Total profit
- $-33,852
- Equity at exit
- $35,487
- IRR
- -13.4%
- Equity multiple
- 0.34×
- Total profit
- $-43,693
- Equity at exit
- $20,578
Cash invested: $66,640 (down + closing). Projections, not guarantees.
Landlord ↔ Tenant lean methodology
- Overall (STATE)
- 87 Strongly Landlord-Friendly
- State Florida
- 87 Strongly Landlord-Friendly · R+3
- County
- — inherits STATE
- City
- — inherits STATE
ZIP-level market 34135
- Rents YoY
- -0.6%
- Active inventory
- 835
- Price-to-rent
- 7.1×
Monthly cashflow live
- Estimated rent
- $2,782 high interval (Pro) →
- Mortgage (P&I)
- −$1,248
- Tax from tax record
- −$226 /mo · $2,709/yr
- Insurance
- −$99
- Flood insurance flood zone
- −$427 /mo · $5,118/yr
- HOA
- −$0
- Vacancy / Maint / Mgmt
- −$584
- Net cashflow
- $198
Break-even live
UW: 25.0% down · 7.5% · 30yr · 1.5% tax · 5.0% vac · 8.0% maint · 8.0% mgmt
Financing live
Cash to close
- Down payment
- $59,500
- Closing costs
- $7,140
- Reserves months
- —
- Total cash needed
- —
Loan-product check · same deal, 3 products live
Conventional
25% down · 7.5% · 30yr
- Down + closing
- —
- Monthly P&I
- —
- Monthly cashflow
- —
- DSCR
- —
- Eligible?
- —
Personal DTI + credit; lowest rate.
DSCR
20% down · 8.5% · 30yr
- Down + closing
- —
- Monthly P&I
- —
- Monthly cashflow
- —
- DSCR
- —
- Eligible?
- —
No personal income docs; deal must DSCR.
Hard money
10% down · 12.0% · 12mo
- Down + closing
- —
- Monthly P&I
- —
- Monthly cashflow
- —
- DSCR
- —
- Eligible?
- —
Short-term bridge; refi at stabilization.
Rent comps 40 comps
| Address | Beds | Baths | Sqft | Rent | $/sqft | DOM | Units | Dist |
|---|---|---|---|---|---|---|---|---|
| 26282 Queen Mary Ln Bonita Springs, FL | 2.0 | 2.0 | 1236 | $1,800 | $1.46 | 24d | 1 | 0.07mi |
| 26680 Bonita Fairways Blvd #201 Bonita Springs, FL | 2.0 | 2.0 | 1216 | $4,500 | $3.70 | 24d | 1 | 0.13mi |
| 26691 Rosewood Pointe Dr #101 Bonita Springs, FL | 2.0 | 2.0 | 1216 | $3,600 | $2.96 | 24d | 1 | 0.15mi |
| 26660 Rosewood Pointe Dr #203 Bonita Springs, FL | 2.0 | 2.0 | 1190 | $3,500 | $2.94 | 24d | 1 | 0.19mi |
| 26700 Rosewood Pointe Dr Bonita Springs, FL | 2.0 | 2.0 | 1199 | $2,200 | $1.83 | 3d | 2 | 0.20mi |
| 26603 Bonita Fairways Blvd Bonita Springs, FL | 3.0 | 2.0 | 1308 | $4,500 | $3.44 | 16d | 1 | 0.21mi |
| 26610 Rosewood Pointe Dr #308 Bonita Springs, FL | 2.0 | 2.0 | 1231 | $2,100 | $1.71 | 3d | 1 | 0.33mi |
| 26589-610 Rosewood Pointe Dr Unit A 301 Bonita Springs, FL | 2.0 | 2.0 | 986 | $3,500 | $3.55 | 24d | 1 | 0.34mi |
| 9250 Highland Woods Blvd #2308 Bonita Springs, FL | 2.0 | 2.0 | 1100 | $1,995 | $1.81 | 3d | 1 | 0.35mi |
| 9250 Highland Woods Blvd #2308 Bonita Springs, FL | 2.0 | 2.0 | 1100 | $1,995 | $1.81 | 24d | 1 | 0.35mi |
| 9450 Highland Woods Blvd #6203 Bonita Springs, FL | 2.0 | 2.0 | 1100 | $6,000 | $5.45 | 14d | 1 | 0.35mi |
| 26600 Rosewood Pointe Dr Unit B-101 Bonita Springs, FL | 2.0 | 2.0 | 983 | $2,200 | $2.24 | 3d | 1 | 0.37mi |
| 26600 Rosewood Pointe Dr Unit 102 Bonita Springs, FL | 1.0 | 2.0 | 833 | $2,900 | $3.48 | 3d | 1 | 0.37mi |
| 9500 Highland Woods Blvd #207 Bonita Springs, FL | 2.0 | 2.0 | 1162 | $1,600 | $1.38 | 24d | 1 | 0.39mi |
| 9200 Highland Woods Blvd Bonita Springs, FL | 2.0 | 2.0 | 1083 | $4,050 | $3.74 | 16d | 3 | 0.40mi |
| 26239 Bonita Fairways Cir Bonita Springs, FL | 2.0 | 2.0 | 1088 | $2,500 | $2.30 | 24d | 1 | 0.42mi |
| 26175 Bonita Fairways Blvd Bonita Springs, FL | 3.0 | 2.0 | 1308 | $3,000 | $2.29 | 16d | 1 | 0.47mi |
| 10101 Sandy Hollow Ln #102 Bonita Springs, FL | 2.0 | 2.5 | 808 | $1,645 | $2.04 | 24d | 1 | 0.59mi |
| 25925 Pebblecreek Dr Bonita Springs, FL | 2.0 | 2.0 | 1498 | $3,400 | $2.27 | 21d | 1 | 0.67mi |
| 26751 Clarkston Dr #102 Bonita Springs, FL | 2.0 | 2.0 | 1256 | $6,500 | $5.18 | 24d | 1 | 0.69mi |
| 26390 Coco Cay Cir #101 Bonita Springs, FL | 2.0 | 2.5 | 1498 | $2,700 | $1.80 | 24d | 1 | 0.74mi |
| 25806 Cockleshell Dr #314 Bonita Springs, FL | 2.0 | 2.0 | 975 | $1,800 | $1.85 | 24d | 1 | 0.80mi |
| 25735 Lake Amelia Way #105 Bonita Springs, FL | 2.0 | 2.0 | 1230 | $1,500 | $1.22 | 24d | 1 | 0.82mi |
| 25727 Lake Amelia Way #105 Bonita Springs, FL | 2.0 | 2.0 | 1230 | $2,200 | $1.79 | 24d | 1 | 0.86mi |
| 10328 Windley Key Ter Bonita Springs, FL | 3.0 | 2.0 | 1400 | $2,600 | $1.86 | 14d | 1 | 0.87mi |
| 8735 River Homes Ln #6302 Bonita Springs, FL | 2.0 | 2.0 | 1087 | $1,875 | $1.72 | 24d | 1 | 0.94mi |
| 8735 River Homes Ln #6108 Bonita Springs, FL | 3.0 | 2.0 | 1223 | $2,000 | $1.64 | 14d | 1 | 0.94mi |
| 8735 River Homes Ln #6104 Bonita Springs, FL | 2.0 | 2.0 | 1051 | $2,000 | $1.90 | 24d | 1 | 0.94mi |
| 8736 River Homes Ln #7302 Bonita Springs, FL | 2.0 | 2.0 | 1087 | $1,950 | $1.79 | 24d | 1 | 0.94mi |
| 10325 Tarrah Ln Unit 1073517P Bonita Springs, FL | 2.0 | 1.0 | 818 | $4,608 | $5.63 | 3d | 1 | 0.99mi |
| 25480 Cockleshell Dr #1005 Bonita Springs, FL | 2.0 | 2.5 | 1119 | $4,600 | $4.11 | 24d | 1 | 1.03mi |
| 25480 Cockleshell Dr #1005 Bonita Springs, FL | 2.0 | 2.5 | 1129 | $4,500 | $3.99 | 21d | 1 | 1.03mi |
| 10710 Rosemary Dr #712 Bonita Springs, FL | 1.0 | 1.0 | 984 | $1,750 | $1.78 | 24d | 1 | 1.07mi |
| 27501 Playa del Rey Ln #503 Bonita Springs, FL | 2.0 | 1.0 | 1120 | $1,875 | $1.67 | 24d | 1 | 1.08mi |
| 8659 River Homes Ln #1307 Bonita Springs, FL | 2.0 | 2.0 | 1087 | $1,850 | $1.70 | 19d | 1 | 1.11mi |
| 8659 River Homes Ln #1108 Bonita Springs, FL | 2.0 | 2.0 | 1087 | $4,500 | $4.14 | 24d | 1 | 1.11mi |
| 9204 Pennsylvania Ave Bonita Springs, FL | 2.0 | 1.0 | 900 | $1,895 | $2.11 | 24d | 1 | 1.13mi |
| 27304 Buccaneer Dr Bonita Springs, FL | 3.0 | 1.0 | 1216 | $2,695 | $2.22 | 3d | 1 | 1.14mi |
| 10004 Connecticut St Bonita Springs, FL | 3.0 | 2.0 | 1420 | $3,100 | $2.18 | 24d | 1 | 1.21mi |
| 27250 Shriver Ave Unit 1073504P Bonita Springs, FL | 2.0 | 1.0 | 661 | $4,275 | $6.46 | 3d | 2 | 1.24mi |
Listing history 2 events
-
2026-06-13remarks 357-char remark
-
2026-06-13$238,000 Under Contract
ⓘ Source: listings_history table (triggers on properties + properties_extension) + one-shot
backfill from property_details.listing_events for pre-trigger history.
Tax reassessment forecast FL · Resets to sale price
- Current annual tax
- $2,709 · $226/mo
- Projected year-2 tax
- $2,709 · $226/mo
- Expected delta
- $0/yr ($0/mo · 0.0%)
ⓘ Screening estimate from a state-policy table — verify with the county assessor before closing.
Climate risk First Street
- Flood 7/10 Severe FEMA zone AE · 82% chance over 30 yrs
- Wildfire 1/10 Low
- Heat 9/10 Extreme 2 d/yr ≥107°F today · 10 d/yr by 30 yrs out
- Wind 10/10 Extreme 99% chance of damaging wind over 30 yrs
- Air quality 3/10 Moderate 2 unhealthy d/yr today · 2 by 30 yrs out
Nearby sold comps map
Loading sold comps map…
Walkable amenities ~0.75 mi
Loading nearby amenities…
Taxation est. · year 1
- Rental income
- $33,380
- − Mortgage interest
- −$13,332
- − Property taxes
- −$2,709
- − Insurance
- −$6,308
- − Repairs & maintenance
- −$2,670
- − Management
- −$2,670
- − Depreciation
- −$6,924
- Taxable loss
- −$1,234
- Est. tax savings @ 24.0%
- +$296
- After-tax cash flow
- $2,671/yr
For passive investors: Depreciation is non-cash, so a rental often shows a tax loss while cash-flowing — sheltering income. Rental losses are passive: they offset passive income freely, and up to $25,000/yr can offset ordinary (W-2) income if you actively participate and your MAGI is under $100k (phasing out to $0 by $150k); unused losses carry forward. On sale, claimed depreciation is recaptured at up to 25%, and gains may owe capital-gains tax (a 1031 exchange can defer both). Figures are a year-1 estimate at your 24.0% rate — not tax advice; consult a CPA.
Schools (NCES district)
- District
- Lee
- NCES district ID
- 1201080
- Math proficiency
- 47% ▼ -11.00%
- Reading proficiency
- 50% ▼ -4.00%
- Median HH income
- $49,518
- Composite
- 41.49/100
- National rank
- #3458
- State rank
- #42 of 73 in FL
Livability — Bonita Springs
- Score
- 70/100
- State rank
- #428
- US rank
- #7576
Category grades
Schools grade is shown separately in the Schools card above.
Census & demographics
- Census place
- Bonita Springs, FL
- County
- Lee County · 788,662 people
- City population
- 64,727
- Metro
- Cape Coral-Fort Myers, FL
- Population (ZIP)
- 48,252
- Household income
- $91,380
- Rent vs Own
- Severe rent burden
- 976.0
Population outlook (Lee County) Hauer SSP2
- Today (2025)
- 871,946 people
- By 2030
- 955,468 · +9.6%
- By 2040
- 1,113,587 · +27.7%
- By 2050
- 1,256,891 · +44.1%
- By 2075
- 1,560,270 · +78.9%
- By 2100
- 1,726,848 · +98.0%
Race, ethnicity, and origin ACS 2023
- Neighborhood character
- Predominantly White (69%)
- Race & ethnicity
- White 69% Hispanic / Latino 26% Two or more races 13% Native American 3% Black 2%
- Hispanic origin (detail)
- Mexican 8% Puerto Rican 4% Cuban 3%
- Common ancestry
- Romanian 5% Lithuanian 2% Slovak 2%
- Foreign-born
- 22% · Canada, Jamaica
- Languages at home
- 74% English-only · Spanish 21% French/Haitian/Cajun 1% Russian/Polish/Slavic 1%
Political lean MEDSL · Lee
- 2024 margin
- Strong R (+28.4) · D 35.5% · R 63.9%
- 2008→2024 swing
- -18.0pp toward R · 2008: -10.4pp · 2024: -28.4pp
- All cycles
- 2024: R+28.4 2020: R+19.2 2016: R+20.4 2012: R+16.6 2008: R+10.4
Not yet ingested
- Civics
- —
Market trends
- HPI YoY
- ▼ -188.86%
- Current HPI
- 243.4153
- Rent YoY
- ▼ -0.61%
- Metro
- Cape Coral-Fort Myers, FL
- State GDP YoY
- ▲ 3.28%
- F500 in state
- 36
Industry mix (Fortune 500 HQ in FL)
| Industry | F500 HQs | Revenue |
|---|---|---|
| Industrial Technology | 2 | $29B |
|
||
| Insurance | 2 | $17B |
|
||
| Retail | 1 | $60B |
|
||
| Technology Distribution | 1 | $58B |
|
||
| Homebuilding | 1 | $35B |
|
||
| Technology Manufacturing | 1 | $35B |
|
||
Price history
+428.9% since first listed4 events — show timeline
- 2026-06-09 Listed $238,000 FSBO.com
- 2014-06-23 Sold (Public Records) $109,900 Public Records
- 2013-11-18 Sold (Public Records) $93,500 Public Records
- 1999-05-17 Sold (Public Records) $45,000 Public Records
Property tax history
+11.7%/yrLatest (2025): $2,709 · +13.9% YoY. Source: county tax records.
Cash-flow waterfall
monthlySold comps — $/sqft
last 12 mo · ≤1 miLoading sold comps…