 Duplex
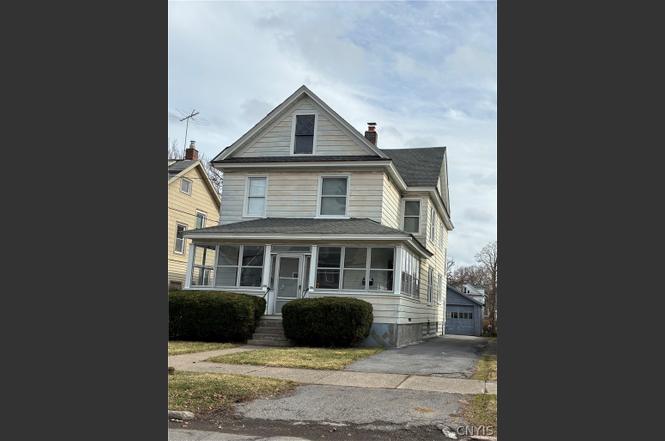
1204 Oak St #6 · Syracuse, NY
Flood risk 1/10 · Minimal
- FEMA flood zone
- X (unshaded)
- Chance of flooding over 30 yrs
- 0.0%
- Est. flood insurance / yr
- $473 – $860
Fire risk 1/10 · Minimal
- Est. fire insurance / yr
- $691 – $1,283
Heat risk 3/10 · Minor
- Hot days now (above 95°F)
- 7 days/yr
- Hot days in 30 yrs
- 16 days/yr
Wind risk 1/10 · Minimal
- Chance of severe wind over 30 yrs
- 1.0%
Air-quality risk 2/10 · Minimal
- Unhealthy air days now
- 0 days/yr
- Unhealthy air days in 30 yrs
- 1 days/yr
Risk factors via First Street. Map © Google.
Why this score? — see what drove the C+ grade
The composite is a weighted blend of 9 inputs, each scored 0–100. Each bar is that input's sub-score; the figure is the points it added to the 100-point composite (weight × sub-score).
- Cash flow +30.0/30.0
- 1% rule +10.0/10.0
- DSCR +10.0/10.0
- Rent growth +4.6/5.0
- Livability +3.9/5.0
- Condition / age +2.5/5.0
- Schools +1.8/10.0
- ARV discount +0.0/15.0
- Appreciation +0.0/10.0
$209,900
🖨 Deal sheet 📄 Offer letter ✓ Due diligence
Multi-family units
County records classify this as Multi-Family (2-4 Unit). Listing-text estimate: 2 units. confirmed
Listing remarks
Well- maintained two-family home featuring two spacious 2-bedroom units. Both units offer beautiful hardwood floors, classic hardwood trim and central air conditioning. Property includes a 2-car garage and is conveniently located close to all amenities.
Key facts
- 4,255 sq ft lot
- 2 garage spots
- Built 1920
Neighborhood map
What this means for you Summary
Snapshot
- This is a 2 × 2-bed/1.0-bath units multifamily listed at $210k.
Deal economics
- At list price, monthly cash flow is $1k ($14k/yr) — positive. Per door: $589/mo.
- The deal already cash-flows at list — no discount required.
- Meets the 1% rule at list price ($3k rent vs $210k).
- Recommended offer: $197k (6.0% below list) — sets the bar for market timing.
- Cap rate 13.0% vs local median 8.2% in Syracuse — top-decile yield for the area; either an underpriced asset or a hidden risk that comps aren't pricing in. Stress-test before assuming the spread holds.
Location & tenants
- Location reads 77/100 on livability (#187 in NY, #2,869 nationally) — a middle-class / working-renter tenant base. Strengths: amenities A+, commute A+, cost of living A+; Watch: schools D+, crime F, employment D-.
- Syracuse City School District (urban): math 18% / reading 26% proficiency, ranked #590 of 590 in NY (top 100%) — low school quality limits family demand, transient renter base, plan for 1-2y turnover; 74% free/reduced lunch — lower-income household profile, screen leases tightly.
- Market conditions: Rents rising fast (+8.4%/yr); 55 active listings in the ZIP; 2 comparable units currently listed for rent nearby; 616 units permitted in Onondaga County in 2024 (256 in 5+ unit buildings).
- At $3,151/mo this rent would consume 80% of the median local household income ($47k/yr) (locally 1566% of renters already pay >50% of income on rent) — very limited rent-growth headroom before tenants either downsize or default.
Forward outlook
- Local home prices are declining (-3.0%/yr); year-one equity from $1k of loan paydown is wiped out by about $6k of value loss. Plan a longer hold.
- Onondaga County population projected to shrink 9% by 2050 — rents likely to lag national; underwrite the cash flow, not the appreciation.
- At projected returns (-3.0% appreciation + 8.0% rent growth), your $59k cash investment doubles in ~5 years — after that, you're playing with house money.
Negotiation context
- It's been on market 80 days — a 6% lower offer ($197k) is reasonable based on typical stale-listing flexibility.
Risks & watch-outs
- Watch-outs: built in 1920 — expect roof / HVAC / electrical / plumbing capex.
Questions for the listing agent
- It's been on market 80 days. Have you received any prior offers? Is the seller open to a 6% concession, seller financing, or rate buy-down credit?
- Can we see the unit-by-unit rent roll, current vacancy, and any below-market leases? What's the average tenancy length?
- What capital expenditures (roof, boiler, parking lot, exteriors) have been made in the last 5 years, and what's planned in the next 2?
- Built in 1920 — when were the roof, HVAC, electrical panel, plumbing, and water heater last replaced?
- Why hasn't it sold? Are there any deal-killer items the seller is aware of (foundation, flood, title, zoning, code violations)?
- Is there a deadline driving the sale (1031 exchange, divorce, estate, relocation)? That informs how much negotiation room exists.
- Schools are D-rated, which usually means shorter tenancies and higher turnover. Who's the typical renter profile here, and what's been the actual vacancy rate?
- Crime grade is F in this area — have there been break-ins, vandalism, or insurance claims at this property in the last 3 years? What carrier currently insures it and at what premium?
- What's the average days-on-market for RENTAL listings here right now (not sales)? A rising rental-DOM trend means longer vacancies and softer asking-rent achievability than the comps imply.
- What's the recent tenant-quality profile in this submarket — average credit score on applications, eviction rate, late-payment / NSF rate, and stable-employment percentage? A property-management company in the area should have these aggregated.
- How much new apartment / multifamily construction is in the pipeline within 1–3 miles? Heavy new supply (>2% of stock underway) typically softens rents 12–24 months out; light construction supports rent growth.
Investment metrics
- 1% rule
- 1.50% ✓
- Cap rate
- 13.02%
- Cash-on-cash
- 24.04%
- DSCR
- 2.07
- GRM
- 5.6
CMA / ARV
- ARV (on-the-fly)
- $178,416
- Comps found
- 12
Show comp detail 12 sales within ~0.75 mi
| Address | Dist | Beds/Ba | Sqft | Sold | Price | $/sf | Match |
|---|---|---|---|---|---|---|---|
| 300 Helen St | 0.21mi | 5/2.0 | 2,098 (-1%) | 4mo | $165,000 | $79 | 84 |
| 932-934 Oak St | 0.23mi | 5/2.0 | 2,050 (-4%) | 2mo | $105,000 | $51 | 81 |
| 501-503 Dewitt St | 0.22mi | 4/2.0 (-1) | 2,370 (+12%) | 2mo | $198,000 | $84 | 64 |
| 1417 Butternut St | 0.41mi | 5/3.0 | 2,005 (-6%) | 8mo | $79,900 | $40 | 61 |
| 129 Spring St | 0.51mi | 6/3.0 (+1) | 2,112 (-1%) | 6mo | $211,000 | $100 | 61 |
| 1107 Butternut St | 0.43mi | 4/2.0 (-1) | 2,002 (-6%) | 9mo | $34,900 | $17 | 58 |
| 113 Grumbach Ave | 0.40mi | 4/2.0 (-1) | 1,888 (-11%) | 0mo | $183,000 | $97 | 57 |
| 613-615 Highland St | 0.54mi | 6/2.0 (+1) | 2,316 (+9%) | 2mo | $140,000 | $60 | 53 |
| 1607 Grant Blvd | 0.26mi | 4/2.0 (-1) | 1,816 (-14%) | 10mo | $200,000 | $110 | 50 |
| 143 Highland Ave | 0.64mi | 5/2.5 | 1,850 (-13%) | 7mo | $215,000 | $116 | 40 |
| 124 Dorothy St | 0.68mi | 5/2.0 | 1,884 (-11%) | 12mo | $162,000 | $86 | 40 |
| 218 Seward St | 0.68mi | 6/2.0 (+1) | 2,442 (+15%) | 12mo | $55,000 | $23 | 28 |
Match score weights: distance 35% · size 25% · config 20% · recency 20%. Top-matched comps best support the ARV.
Projected returns pro-forma
-3.0% appreciation · 8.0% rent growth · sell at horizon
- IRR
- 22.5%
- Equity multiple
- 1.98×
- Total profit
- $57,577
- Equity at exit
- $31,297
- IRR
- 33.5%
- Equity multiple
- 4.78×
- Total profit
- $222,317
- Equity at exit
- $18,148
Cash invested: $58,772 (down + closing). Projections, not guarantees.
Landlord ↔ Tenant lean methodology
- Overall (STATE)
- 15 Strongly Tenant-Friendly
- State New York
- 15 Strongly Tenant-Friendly · D+10
- County
- — inherits STATE
- City
- — inherits STATE
ZIP-level market 13203
- Home prices YoY
- -11.9%
- Rents YoY
- 8.4%
- Active inventory
- 55
- Price-to-rent
- 11.1×
Monthly cashflow live
- Estimated rent
- $3,151 high interval (Pro) →
- Mortgage (P&I)
- −$1,101
- Tax from tax record
- −$124 /mo · $1,487/yr
- Insurance
- −$87
- HOA
- −$0
- Vacancy / Maint / Mgmt
- −$662
- Net cashflow
- $1,177
Break-even live
2-unit breakdown (identical units grouped — click to expand)
| Units | Beds | Baths | Est. rent |
|---|---|---|---|
| 2× units | 2 | 1 | $3,150 |
| #1 | 2 | 1 | $1,575 |
| #2 | 2 | 1 | $1,575 |
| Total (2 units) | $3,151 | ||
UW: 25.0% down · 7.5% · 30yr · 1.5% tax · 5.0% vac · 8.0% maint · 8.0% mgmt
Financing live
Cash to close
- Down payment
- $52,475
- Closing costs
- $6,297
- Reserves months
- —
- Total cash needed
- —
Loan-product check · same deal, 3 products live
Conventional
25% down · 7.5% · 30yr
- Down + closing
- —
- Monthly P&I
- —
- Monthly cashflow
- —
- DSCR
- —
- Eligible?
- —
Personal DTI + credit; lowest rate.
DSCR
20% down · 8.5% · 30yr
- Down + closing
- —
- Monthly P&I
- —
- Monthly cashflow
- —
- DSCR
- —
- Eligible?
- —
No personal income docs; deal must DSCR.
Hard money
10% down · 12.0% · 12mo
- Down + closing
- —
- Monthly P&I
- —
- Monthly cashflow
- —
- DSCR
- —
- Eligible?
- —
Short-term bridge; refi at stabilization.
Rent comps 2 comps
| Address | Beds | Baths | Sqft | Rent | $/sqft | DOM | Units | Dist |
|---|---|---|---|---|---|---|---|---|
| 746 E Laurel St Unit 1 Syracuse, NY | 4.0 | 2.0 | 1400 | $1,500 | $1.07 | 43d | 1 | 0.67mi |
| 365 Green St Syracuse, NY | 5.0 | 3.5 | 2263 | $3,300 | $1.46 | 21d | 1 | 0.80mi |
Listing history 3 events
-
2026-03-30status Pending
-
2026-03-16price $209,900
-
2026-01-09$219,900 Active
ⓘ Source: listings_history table (triggers on properties + properties_extension) + one-shot
backfill from property_details.listing_events for pre-trigger history.
Tax reassessment forecast NY · Partial reset (capped growth)
- Current annual tax
- $1,487 · $124/mo
- Projected year-2 tax
- $2,517 · $210/mo
- Expected delta
- +$1,030/yr (+$86/mo · 69.3%)
ⓘ Screening estimate from a state-policy table — verify with the county assessor before closing.
Climate risk First Street
- Flood 1/10 Low FEMA zone X (unshaded) · 0% chance over 30 yrs
- Wildfire 1/10 Low
- Heat 3/10 Moderate 7 d/yr ≥95°F today · 16 d/yr by 30 yrs out
- Wind 1/10 Low 100% chance of damaging wind over 30 yrs
- Air quality 2/10 Low 0 unhealthy d/yr today · 1 by 30 yrs out
Nearby sold comps map
Loading sold comps map…
Walkable amenities ~0.75 mi
Loading nearby amenities…
Taxation est. · year 1
- Rental income
- $37,812
- − Mortgage interest
- −$11,758
- − Property taxes
- −$1,487
- − Insurance
- −$1,050
- − Repairs & maintenance
- −$3,025
- − Management
- −$3,025
- − Depreciation
- −$6,106
- Taxable income
- $11,362
- Est. tax owed @ 24.0%
- −$2,727
- After-tax cash flow
- $11,399/yr
For passive investors: Depreciation is non-cash, so a rental often shows a tax loss while cash-flowing — sheltering income. Rental losses are passive: they offset passive income freely, and up to $25,000/yr can offset ordinary (W-2) income if you actively participate and your MAGI is under $100k (phasing out to $0 by $150k); unused losses carry forward. On sale, claimed depreciation is recaptured at up to 25%, and gains may owe capital-gains tax (a 1031 exchange can defer both). Figures are a year-1 estimate at your 24.0% rate — not tax advice; consult a CPA.
Schools (NCES district)
- District
- Syracuse City School District
- NCES district ID
- 3628590
- Math proficiency
- 18% ▼ -5.00%
- Reading proficiency
- 26% ▬ 0.00%
- Median HH income
- $32,097
- Composite
- 17.83/100
- National rank
- #9007
- State rank
- #590 of 590 in NY
Livability — Syracuse
- Score
- 77/100
- State rank
- #187
- US rank
- #2869
Category grades
Schools grade is shown separately in the Schools card above.
Census & demographics
- Census place
- Syracuse, NY
- County
- Onondaga County · 247,257 people
- City population
- 152,627
- Metro
- Syracuse, NY
- Population (ZIP)
- 16,180
- Household income
- $46,997
- Rent vs Own
- Severe rent burden
- 1566.0
Population outlook (Onondaga County) Hauer SSP2
- Today (2025)
- 467,894 people
- By 2030
- 463,381 · -1.0%
- By 2040
- 447,697 · -4.3%
- By 2050
- 426,399 · -8.9%
- By 2075
- 373,661 · -20.1%
- By 2100
- 307,967 · -34.2%
Race, ethnicity, and origin ACS 2023
- Neighborhood character
- Diverse neighborhood (Simpson 0.67)
- Race & ethnicity
- White 52% Black 22% Hispanic / Latino 11% Two or more races 9% Asian 7%
- Hispanic origin (detail)
- Puerto Rican 6% Cuban 2%
- Common ancestry
- Romanian 3% Lithuanian 2% Iranian 2%
- Foreign-born
- 13% · Canada, India, Philippines
- Languages at home
- 81% English-only · Spanish 6% Other Indo-European 3% Other Asian/Pacific 3%
Political lean MEDSL · Onondaga
- 2024 margin
- D (+17.3) · D 58.6% · R 41.4%
- 2008→2024 swing
- -3.0pp toward R · 2008: 20.3pp · 2024: 17.3pp
- All cycles
- 2024: D+17.3 2020: D+20.6 2016: D+12.8 2012: D+21.1 2008: D+20.3
Not yet ingested
- Civics
- —
Market trends
- HPI YoY
- ▼ -35.69%
- Current HPI
- 263.2588
- Rent YoY
- ▲ 8.39%
- Metro
- Syracuse, NY
- State GDP YoY
- ▲ 2.60%
- F500 in state
- 92
Industry mix (Fortune 500 HQ in NY)
| Industry | F500 HQs | Revenue |
|---|---|---|
| Financial Services | 10 | $950B |
|
||
| Consumer Goods | 9 | $162B |
|
||
| Insurance | 4 | $225B |
|
||
| Telecommunications | 2 | $144B |
|
||
| Pharmaceuticals | 2 | $112B |
|
||
| Media / Entertainment | 2 | $69B |
|
||
Price history
-4.5% since first listed3 events — show timeline
- 2026-03-30 Pending — CNYIS
- 2026-03-16 Price Changed $209,900 CNYIS
- 2026-01-09 Listed $219,900 CNYIS
Property tax history
-0.3%/yrLatest (2025): $1,487 · +0.0% YoY. Source: county tax records.
Cash-flow waterfall
monthlySold comps — $/sqft
last 12 mo · ≤1 miLoading sold comps…