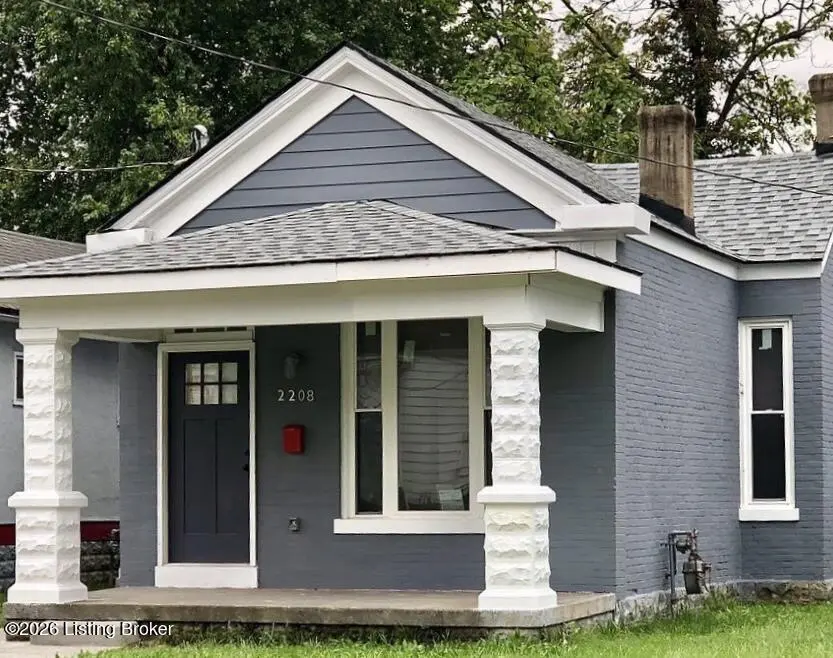
2208 Dumesnil St · Louisville, KY
Flood risk 6/10 · Moderate
- FEMA flood zone
- X (shaded)
- Chance of flooding over 30 yrs
- 0.72%
- Est. flood insurance / yr
- $507 – $1,088
Fire risk 1/10 · Minimal
- Est. fire insurance / yr
- $839 – $1,559
Heat risk 5/10 · Moderate
- Hot days now (above 105°F)
- 7 days/yr
- Hot days in 30 yrs
- 20 days/yr
Wind risk 2/10 · Minimal
- Chance of severe wind over 30 yrs
- 1.0%
Air-quality risk 2/10 · Minimal
- Unhealthy air days now
- 1 days/yr
- Unhealthy air days in 30 yrs
- 3 days/yr
Risk factors via First Street. Map © Google.
Why this score? — see what drove the B grade
The composite is a weighted blend of 9 inputs, each scored 0–100. Each bar is that input's sub-score; the figure is the points it added to the 100-point composite (weight × sub-score).
- Cash flow +27.7/30.0
- Appreciation +10.0/10.0
- DSCR +9.7/10.0
- 1% rule +6.6/10.0
- Rent growth +4.5/5.0
- ARV discount +3.7/15.0
- Livability +3.2/5.0
- Condition / age +2.5/5.0
- Schools +2.3/10.0
$95,000
🖨 Deal sheet (PDF) 📄 Offer letter ✓ Due diligence
Listing remarks
Investor opportunity! This well-maintained 2-bedroom home is currently tenant occupied with rental income of $1,025/m, (which is currently below market rents of $1,289/m). Tenant is on a yearly lease and has resided in the property for the past five years, offering stability and consistent occupancy. The home underwent a complete renovation in 2019, taken down to the studs with major updates completed at that time, making everything new throughout the property. This property has been utilized as a rental and would make a great addition to an investment portfolio or a turnkey opportunity for an investor seeking immediate cash flow. Please allow 48/hr notice for showings due to tenant occupan
Key facts
- Complete renovation
- Major updates
- Rental income
Tags
Property features AI
Finance
- Other: Subdivision: Merriwether & Davison
- HOA & community: No association fee
Exterior
- Utilities: Electricity connected; Natural gas
- Home design: Single-family ranch/shotgun-style home; One above-grade finished level; Built in 1900
- Construction: Wood frame and brick construction; Shingle roof; Crawl space foundation
- Exterior features: Cleared lot; Privacy wood fencing (full)
Interior
- Kitchen: Kitchen on the first floor
- Bedrooms: Two bedrooms on the first floor; Primary bedroom on the first floor
- Bathrooms: One full bathroom on the first floor
- Heating & cooling: Natural gas heating; Central air conditioning; One HVAC unit
- Interior features: Five total rooms; Basement with cellar, finished space and outside entry
- Laundry & utility: First-floor laundry
Neighborhood map
What this means for you Summary
Snapshot
- This is a 2-bed/1.0-bath single-family listed at $95k.
Deal economics
- At list price, monthly cash flow is $286 ($3k/yr) — positive.
- The deal already cash-flows at list — no discount required.
- Meets the 1% rule at list price ($1k rent vs $95k).
- Recommended offer: $94k (1.5% below list) — sets the bar for market timing.
Location & tenants
- Location reads 63/100 on livability (#333 in KY) — a middle-class / working-renter tenant base. Strengths: cost of living A+, housing A+; Watch: employment C-, health & safety D+, crime F.
- Jefferson County (urban): math 19% / reading 35% proficiency, ranked #121 of 165 in KY (top 73%) — low school quality limits family demand, transient renter base, plan for 1-2y turnover.
- Zoned schools: Wheatley Elementary (math 2% / reading 8%, grade F, #670 of 676 statewide, top 100%, 318 students, 84% FRL); Western Middle School For The Arts (math 9% / reading 41%, grade F, #184 of 217 statewide, top 87%, 650 students, 60% FRL); Seneca High (math 8% / reading 17%, grade F, #228 of 254 statewide, top 91%, 1,309 students, 64% FRL).
- Zoned-school proficiency averages 14% at this address vs 27% district-wide (-13 pts) — the specific schools serving this property underperform the Jefferson County average; the district grade overstates school quality for this exact location.
- Market conditions: Rents rising fast (+8.1%/yr); 93 active listings in the ZIP; 40 comparable units currently listed for rent nearby; rentals at typical pace (median 25d on market — plan ~3-4 weeks tenant-placement turnaround); lower-income renter base — watch delinquency; 2,836 units permitted in Jefferson County in 2024 (1,558 in 5+ unit buildings).
Forward outlook
- In year one you build about $10k of equity ($657 loan paydown + $10k appreciation (10.0% local appreciation)).
- Jefferson County population projected at +13% by 2050 — modest demand growth; plan on rents tracking national, not racing it.
- At projected returns (10.0% appreciation + 8.0% rent growth), your $27k cash investment doubles in ~2 years — after that, you're playing with house money.
- By year 4, paydown + projected appreciation supports a ~$36k cash-out refi (75% LTV) — recoverable capital for the next deal without selling this one.
Negotiation context
- It's been on market 23 days — a 2% lower offer ($94k) is reasonable based on typical stale-listing flexibility.
- 4 sale attempts since 7y ago with the ask held roughly flat each time — persistent listings suggest the price (not the market) is what's stuck; bring a comps-based counter.
Risks & watch-outs
- Watch-outs: built in 1900 — expect roof / HVAC / electrical / plumbing capex.
- Climate carrying-cost: major flood risk; extreme-heat days projected 7→20/yr by 2055 (HVAC capex compounding) — expect insurance premiums to compound above CPI over the hold.
Questions for the listing agent
- Built in 1900 — when were the roof, HVAC, electrical panel, plumbing, and water heater last replaced?
- Is there a deadline driving the sale (1031 exchange, divorce, estate, relocation)? That informs how much negotiation room exists.
- Schools are D-rated, which usually means shorter tenancies and higher turnover. Who's the typical renter profile here, and what's been the actual vacancy rate?
- Crime grade is F in this area — have there been break-ins, vandalism, or insurance claims at this property in the last 3 years? What carrier currently insures it and at what premium?
- What's the average days-on-market for RENTAL listings here right now (not sales)? A rising rental-DOM trend means longer vacancies and softer asking-rent achievability than the comps imply.
- What's the recent tenant-quality profile in this submarket — average credit score on applications, eviction rate, late-payment / NSF rate, and stable-employment percentage? A property-management company in the area should have these aggregated.
- How much new for-sale + rental construction is in the pipeline within 1–3 miles? Heavy new supply typically softens prices + rents 12–24 months out; constrained supply supports both.
Investment metrics
- 1% rule
- 1.16% ✓
- Cap rate
- 9.91%
- Cash-on-cash
- 12.91%
- DSCR
- 1.57
- GRM
- 7.2
CMA / ARV
- ARV (on-the-fly)
- $87,620
- Comps found
- 12
Show comp detail 12 sales within ~0.75 mi
| Address | Dist | Beds/Ba | Sqft | Sold | Price | $/sf | Match |
|---|---|---|---|---|---|---|---|
| 1812 Wilson Ave | 0.22mi | 3/1.5 (+1) | 1,248 (-7%) | 1mo | $135,000 | $108 | 70 |
| 2316 Greenwood Ave | 0.34mi | 2/1.0 | 1,228 (-9%) | 3mo | $80,000 | $65 | 67 |
| 2104 W Burnett Ave | 0.41mi | 3/1.0 (+1) | 1,282 (-5%) | 6mo | $67,000 | $52 | 63 |
| 2008 W Burnett Ave | 0.42mi | 3/1.5 (+1) | 1,396 (+4%) | 7mo | $115,900 | $83 | 62 |
| 1415 S 28th St | 0.51mi | 3/2.0 (+1) | 1,384 (+3%) | 2mo | $190,000 | $137 | 61 |
| 865 S 26th St | 0.63mi | 3/1.0 (+1) | 1,371 (+2%) | 3mo | $51,999 | $38 | 60 |
| 1705 1/2 Hale Ave | 0.44mi | 3/2.0 (+1) | 1,257 (-7%) | 4mo | $58,000 | $46 | 56 |
| 1736 W Gaulbert Ave | 0.70mi | 3/1.0 (+1) | 1,326 (-2%) | 4mo | $53,600 | $40 | 56 |
| 1334 Cypress St | 0.35mi | 3/2.0 (+1) | 1,491 (+11%) | 2mo | $195,000 | $131 | 55 |
| 1458 Olive St | 0.56mi | 2/2.0 | 1,460 (+8%) | 2mo | $90,000 | $62 | 54 |
| 1331 S 28th St | 0.46mi | 3/1.5 (+1) | 1,152 (-14%) | 6mo | $60,000 | $52 | 43 |
| 101 Saunders | 0.65mi | 2/2.0 | 1,148 (-15%) | 5mo | $145,000 | $126 | 37 |
Match score weights: distance 35% · size 25% · config 20% · recency 20%. Top-matched comps best support the ARV.
Projected returns pro-forma
10.0% appreciation · 8.0% rent growth · sell at horizon
- IRR
- 36.0%
- Equity multiple
- 3.85×
- Total profit
- $75,759
- Equity at exit
- $85,584
- IRR
- 32.7%
- Equity multiple
- 9.39×
- Total profit
- $223,138
- Equity at exit
- $184,564
Cash invested: $26,600 (down + closing). Projections, not guarantees.
Landlord ↔ Tenant lean methodology
- Overall (STATE)
- 83 Strongly Landlord-Friendly
- State Kentucky
- 83 Strongly Landlord-Friendly · R+16
- County
- — inherits STATE
- City
- — inherits STATE
ZIP-level market 40210
- Home prices YoY
- 12.1%
- Rents YoY
- 8.1%
- Active inventory
- 93
- Price-to-rent
- 7.2×
Monthly cashflow live
- Estimated rent
- $1,102 high interval (Pro) →
- Mortgage (P&I)
- −$498
- Tax from tax record
- −$47 /mo · $560/yr
- Insurance
- −$40
- HOA
- −$0
- Vacancy / Maint / Mgmt
- −$231
- Net cashflow
- $286
Break-even live
Sensitivity live
| Price | -10% $340 | -5% $313 | +0% $286 | +5% $259 | +10% $232 |
|---|---|---|---|---|---|
| Rent | -10% $199 | -5% $243 | +0% $286 | +5% $330 | +10% $373 |
| Rate | -1.0pp $334 | -0.5pp $310 | base $286 | +0.5pp $262 | +1.0pp $236 |
UW: 25.0% down · 7.5% · 30yr · 1.5% tax · 5.0% vac · 8.0% maint · 8.0% mgmt
Financing live
Cash to close
- Down payment
- $23,750
- Closing costs
- $2,850
- Reserves months
- —
- Total cash needed
- —
Loan-product check · same deal, 3 products live
Conventional
25% down · 7.5% · 30yr
- Down + closing
- —
- Monthly P&I
- —
- Monthly cashflow
- —
- DSCR
- —
- Eligible?
- —
Personal DTI + credit; lowest rate.
DSCR
20% down · 8.5% · 30yr
- Down + closing
- —
- Monthly P&I
- —
- Monthly cashflow
- —
- DSCR
- —
- Eligible?
- —
No personal income docs; deal must DSCR.
Hard money
10% down · 12.0% · 12mo
- Down + closing
- —
- Monthly P&I
- —
- Monthly cashflow
- —
- DSCR
- —
- Eligible?
- —
Short-term bridge; refi at stabilization.
Rent comps 40 comps
| Address | Beds | Baths | Sqft | Rent | $/sqft | DOM | Units | Dist |
|---|---|---|---|---|---|---|---|---|
| 1854 W Ormsby Ave Louisville, KY | 2.0 | 2.0 | 1094 | $800 | $0.73 | 17d | 1 | 0.11mi |
| 2223 Saint Louis Ave Louisville, KY | 3.0 | 1.5 | 1152 | $1,175 | $1.02 | 25d | 1 | 0.12mi |
| 1410 Standard Village Cir Louisville, KY | 3.0 | 2.0 | 1200 | $900 | $0.75 | 25d | 1 | 0.26mi |
| 2614 Virginia Ave Louisville, KY | 2.0 | 1.0 | 975 | $925 | $0.95 | 25d | 1 | 0.29mi |
| 2706 Hale Ave Unit 1 Louisville, KY | 3.0 | 1.0 | 1100 | $1,400 | $1.27 | 25d | 1 | 0.40mi |
| 2706 Hale Ave Unit 2 Louisville, KY | 2.0 | 1.0 | 900 | $1,250 | $1.39 | 25d | 1 | 0.40mi |
| 1842 Bolling Ave Louisville, KY | 1.0 | 1.0 | 900 | $895 | $0.99 | 16d | 1 | 0.45mi |
| 1339 S 28th St Unit 3 Louisville, KY | 3.0 | 1.0 | 1125 | $1,175 | $1.04 | 21d | 1 | 0.45mi |
| 1705 1/2 Hale Ave Louisville, KY | 3.0 | 2.0 | 1257 | $1,400 | $1.11 | 12d | 1 | 0.46mi |
| 1148 S 17th St Unit 2 Louisville, KY | 3.0 | 1.0 | 1000 | $895 | $0.90 | 25d | 1 | 0.47mi |
| 1847 W Kentucky St Louisville, KY | 2.0 | 1.0 | 1368 | $895 | $0.65 | 5d | 1 | 0.49mi |
| 1774 Bolling Ave Louisville, KY | 3.0 | 2.0 | 1611 | $1,300 | $0.81 | 12d | 1 | 0.52mi |
| 2708 Greenwood Ave Apt 1 Louisville, KY | 3.0 | 1.0 | 1100 | $1,300 | $1.18 | 25d | 1 | 0.53mi |
| 2416 Garland Ave Louisville, KY | 3.0 | 2.0 | 1172 | $1,600 | $1.37 | 25d | 1 | 0.57mi |
| 2913 Dumesnil St Apt 3 Louisville, KY | 3.0 | 1.0 | 1112 | $740 | $0.67 | 12d | 1 | 0.57mi |
| 1616 Gallagher St Louisville, KY | 3.0 | 1.5 | 1056 | $1,400 | $1.33 | 25d | 1 | 0.59mi |
| 2710 W Kentucky St Apt 2 Louisville, KY | 3.0 | 1.0 | 1015 | $1,300 | $1.28 | 25d | 1 | 0.60mi |
| 1792 W Gaulbert Ave Louisville, KY | 2.0 | 1.0 | 915 | $950 | $1.04 | 25d | 1 | 0.61mi |
| 2711 W Kentucky St Louisville, KY | 3.0 | 1.0 | 1155 | $1,100 | $0.95 | 25d | 1 | 0.63mi |
| 848 S 23rd St Louisville, KY | 3.0 | 1.5 | 1050 | $1,450 | $1.38 | 25d | 1 | 0.64mi |
| 1723 W Kentucky St Unit 3 Louisville, KY | 3.0 | 1.0 | 1200 | $1,300 | $1.08 | 25d | 1 | 0.65mi |
| 2821 Greenwood Ave #1 Louisville, KY | 3.0 | 1.0 | 1113 | $1,300 | $1.17 | 25d | 1 | 0.65mi |
| 2634 Garland Ave Unit A Louisville, KY | 3.0 | 1.0 | 1152 | $940 | $0.82 | 25d | 1 | 0.65mi |
| 2634 Garland Ave Unit B Louisville, KY | 3.0 | 1.0 | 1152 | $895 | $0.78 | 21d | 1 | 0.65mi |
| 1644 W Kentucky St Unit 3 Louisville, KY | 3.0 | 1.0 | 900 | $950 | $1.06 | 25d | 1 | 0.65mi |
| 2825 Greenwood Ave #2 Louisville, KY | 2.0 | 1.0 | 1300 | $995 | $0.77 | 25d | 1 | 0.66mi |
| 2825 Greenwood Ave #4 Louisville, KY | 3.0 | 1.0 | 1440 | $1,250 | $0.87 | 25d | 1 | 0.66mi |
| 1714 W Hill St Louisville, KY | 3.0 | 1.0 | 1050 | $1,045 | $1.00 | 25d | 1 | 0.66mi |
| 2912 Greenwood Ave Louisville, KY | 3.0 | 2.0 | 1362 | $1,150 | $0.84 | 17d | 1 | 0.69mi |
| 2400 Burwell Ave Louisville, KY | 2.0 | 1.0 | 972 | $895 | $0.92 | 17d | 1 | 0.69mi |
| 2724 Garland Ave Unit 202 Louisville, KY | 2.0 | 1.0 | 950 | $745 | $0.78 | 5d | 1 | 0.69mi |
| 1708 W Gaulbert Ave Louisville, KY | 3.0 | 1.0 | 936 | $975 | $1.04 | 25d | 1 | 0.71mi |
| 1439 Beech St Apt 1 Louisville, KY | 3.0 | 1.5 | 1000 | $820 | $0.82 | 25d | 1 | 0.72mi |
| 1418 Beech St Unit 2 Louisville, KY | 2.0 | 1.0 | 1000 | $980 | $0.98 | 22d | 1 | 0.73mi |
| 1115 S 32nd St Louisville, KY | 3.0 | 1.0 | 1393 | $1,275 | $0.92 | 25d | 1 | 0.85mi |
| 1115 S 32nd St Louisville, KY | 3.0 | 1.0 | 1393 | $1,275 | $0.92 | 22d | 1 | 0.85mi |
| 3215 Virginia Ave Louisville, KY | 3.0 | 1.0 | 975 | $924 | $0.95 | 25d | 1 | 0.89mi |
| 3122 W Kentucky St Louisville, KY | 3.0 | 1.0 | 1030 | $1,150 | $1.12 | 25d | 1 | 0.90mi |
| 2310 W Broadway Unit 1 Louisville, KY | 1.0 | 1.0 | 1100 | $975 | $0.89 | 4d | 1 | 0.90mi |
| 2411 Elliott Ave Louisville, KY | 2.0 | 1.0 | 892 | $895 | $1.00 | 25d | 1 | 1.00mi |
Listing history 14 events
-
2026-06-21days on market $95,000 Active 23 DOM
-
2026-06-18days on market $95,000 Active 20 DOM
-
2026-06-17days on market $95,000 Active 19 DOM
-
2026-06-16days on market $95,000 Active 18 DOM
-
2026-06-15days on market $95,000 Active 17 DOM
-
2026-06-13days on market $95,000 Active 15 DOM
-
2026-06-10days on market $95,000 Active 12 DOM
-
2026-06-09days on market $95,000 Active 11 DOM
-
2026-06-08days on market $95,000 Active 10 DOM
-
2026-06-07days on market $95,000 Active 9 DOM
-
2026-06-03days on market $95,000 Active 5 DOM
-
2026-06-02days on market $95,000 Active 4 DOM
-
2026-06-01days on market $95,000 Active 3 DOM
-
2026-05-31days on market $95,000 Active 2 DOM
ⓘ Source: listings_history table (triggers on properties + properties_extension) + one-shot
backfill from property_details.listing_events for pre-trigger history.
Tax reassessment forecast KY · Resets to sale price
- Current annual tax
- $560 · $47/mo
- Projected year-2 tax
- $817 · $68/mo
- Expected delta
- +$257/yr (+$21/mo · 45.9%)
ⓘ Screening estimate from a state-policy table — verify with the county assessor before closing.
Climate risk First Street
- Flood 6/10 Major FEMA zone X (shaded) · 72% chance over 30 yrs
- Wildfire 1/10 Low
- Heat 5/10 Major 7 d/yr ≥105°F today · 20 d/yr by 30 yrs out
- Wind 2/10 Low 100% chance of damaging wind over 30 yrs
- Air quality 2/10 Low 1 unhealthy d/yr today · 3 by 30 yrs out
Nearby sold comps map
Loading sold comps map…
Walkable amenities ~0.75 mi
Loading nearby amenities…
Taxation est. · year 1
- Rental income
- $13,224
- − Mortgage interest
- −$5,321
- − Property taxes
- −$560
- − Insurance
- −$475
- − Repairs & maintenance
- −$1,058
- − Management
- −$1,058
- − Depreciation
- −$2,764
- Taxable income
- $1,988
- Est. tax owed @ 24.0%
- −$477
- After-tax cash flow
- $2,956/yr
For passive investors: Depreciation is non-cash, so a rental often shows a tax loss while cash-flowing — sheltering income. Rental losses are passive: they offset passive income freely, and up to $25,000/yr can offset ordinary (W-2) income if you actively participate and your MAGI is under $100k (phasing out to $0 by $150k); unused losses carry forward. On sale, claimed depreciation is recaptured at up to 25%, and gains may owe capital-gains tax (a 1031 exchange can defer both). Figures are a year-1 estimate at your 24.0% rate — not tax advice; consult a CPA.
Schools (NCES district)
- District
- Jefferson County
- NCES district ID
- 2102990
- Math proficiency
- 19% ▼ -17.00%
- Reading proficiency
- 35% ▼ -11.00%
- Median HH income
- $47,885
- Composite
- 23.45/100
- National rank
- #7884
- State rank
- #121 of 165 in KY
Livability — Louisville
- Score
- 63/100
- State rank
- #333
- US rank
- #15887
Category grades
Schools grade is shown separately in the Schools card above.
Census & demographics
- Census place
- Louisville, KY
- County
- Jefferson County · 790,184 people
- City population
- 769,292
- Metro
- Louisville/Jefferson County, KY-IN
- Population (ZIP)
- 13,518
- Household income
- $35,347
- Rent vs Own
- Severe rent burden
- 815.0
Population outlook (Jefferson County) Hauer SSP2
- Today (2025)
- 823,112 people
- By 2030
- 849,343 · +3.2%
- By 2040
- 895,696 · +8.8%
- By 2050
- 933,630 · +13.4%
- By 2075
- 1,028,262 · +24.9%
- By 2100
- 1,072,675 · +30.3%
Race, ethnicity, and origin ACS 2023
- Neighborhood character
- Predominantly Black (84%)
- Race & ethnicity
- Black 84% White 8% Two or more races 5% Hispanic / Latino 3%
- Common ancestry
- Iranian 1%
- Foreign-born
- 4% · Canada
- Languages at home
- 93% English-only · Spanish 3%
Political lean MEDSL · Jefferson
- 2024 margin
- D (+16.6) · D 57.4% · R 40.9% · Other 1.7%
- 2008→2024 swing
- +4.5pp toward D · 2008: 12.0pp · 2024: 16.6pp
- All cycles
- 2024: D+16.6 2020: D+20.1 2016: D+13.3 2012: D+11.1 2008: D+12.0
Not yet ingested
- Civics
- —
Market trends
- HPI YoY
- ▲ 28.45%
- Current HPI
- 264.0146
- Rent YoY
- ▲ 8.05%
- Metro
- Louisville/Jefferson County, KY-IN
- State GDP YoY
- ▲ 1.81%
- F500 in state
- 4
Industry mix (Fortune 500 HQ in KY)
| Industry | F500 HQs | Revenue |
|---|---|---|
| Healthcare | 1 | $118B |
|
||
| Food / Beverage | 1 | $7B |
|
||
Price history
+46.2% since first listed9 events — show timeline
- 2026-05-30 Listed $95,000 Metro Search MLS
- 2019-12-09 Listing Removed — Metro Search MLS
- 2019-11-20 Listed $95,000 Metro Search MLS
- 2019-11-20 Price Changed $92,000 Metro Search MLS
- 2019-11-19 Listing Removed — Metro Search MLS
- 2019-11-12 Relisted — Metro Search MLS
- 2019-11-12 Price Changed $95,000 Metro Search MLS
- 2019-09-19 Listing Removed — Metro Search MLS
- 2019-08-30 Listed $65,000 Metro Search MLS
Property tax history
+3.1%/yrLatest (2025): $560 · -1.9% YoY. Source: county tax records.
Cash-flow waterfall
monthlySold comps — $/sqft
last 12 mo · ≤1 miLoading sold comps…