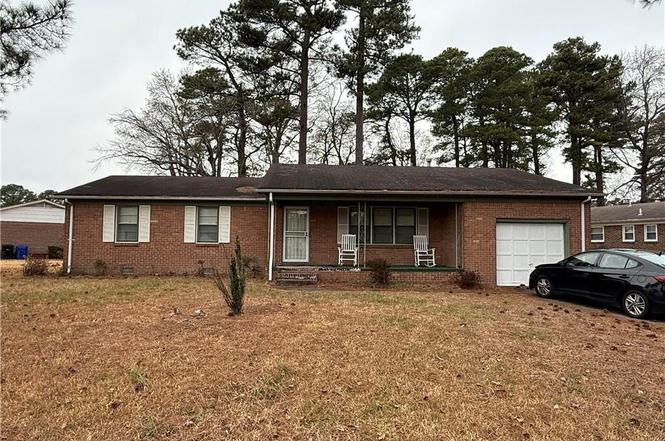
1109 Lakeview Dr · Portsmouth, VA
Flood risk 1/10 · Minimal
- FEMA flood zone
- X (unshaded)
- Chance of flooding over 30 yrs
- 0.0%
- Est. flood insurance / yr
- $507 – $1,088
Fire risk 2/10 · Minimal
- Est. fire insurance / yr
- $666 – $1,236
Heat risk 9/10 · Severe
- Hot days now (above 106°F)
- 7 days/yr
- Hot days in 30 yrs
- 16 days/yr
Wind risk 8/10 · Major
- Chance of severe wind over 30 yrs
- 80.0%
Air-quality risk 2/10 · Minimal
- Unhealthy air days now
- 2 days/yr
- Unhealthy air days in 30 yrs
- 2 days/yr
Risk factors via First Street. Map © Google.
Why this score? — see what drove the B+ grade
The composite is a weighted blend of 9 inputs, each scored 0–100. Each bar is that input's sub-score; the figure is the points it added to the 100-point composite (weight × sub-score).
- Cash flow +30.0/30.0
- ARV discount +15.0/15.0
- DSCR +10.0/10.0
- 1% rule +8.9/10.0
- Rent growth +5.0/5.0
- Schools +3.9/10.0
- Livability +3.7/5.0
- Condition / age +2.5/5.0
- Appreciation +0.0/10.0
$165,000
🖨 Deal sheet 📄 Offer letter ✓ Due diligence
Listing remarks
Sale is contingent upon seller’s lien holder accepting seller’s short sale proposition w/ o deficiency Judgement. WILL NOT PASS TRADITIONAL FINANCING. Property sold as-is.
Key facts
- 0.27 acre lot
- Garage
- Built 1974
Neighborhood map
What this means for you Summary
Snapshot
- This is a 3-bed/1.5-bath single-family listed at $165k.
Deal economics
- At list price, monthly cash flow is $615 ($7k/yr) — positive.
- The deal already cash-flows at list — no discount required.
- Meets the 1% rule at list price ($2k rent vs $165k).
- Cap rate 10.8% vs local median 4.6% in Portsmouth — top-decile yield for the area; either an underpriced asset or a hidden risk that comps aren't pricing in. Stress-test before assuming the spread holds.
Location & tenants
- Location reads 73/100 on livability (#172 in VA) — a middle-class / working-renter tenant base. Strengths: amenities A+, cost of living A+, housing A+; Watch: employment C-, crime F, commute F.
- Portsmouth City Public School District (urban): math 34% / reading 58% proficiency, ranked #107 of 131 in VA (top 82%) — families likely to look elsewhere, expect single-tenant / working-renter base with shorter leases.
- Zoned schools: Lakeview Elementary (math 22% / reading 47%, grade F, #966 of 1,108 statewide, top 89%, 419 students, 100% FRL); I.C. Norcom High (math 39% / reading 58%, grade D, #301 of 319 statewide, top 95%, 1,043 students, 100% FRL) — zoned schools average 100% FRL vs 60% district-wide (40 pts higher); higher-poverty schools than district average — tighter screening recommended.
- Market conditions: Rents rising fast (+11.9%/yr); 167 active listings in the ZIP; 8 comparable units currently listed for rent nearby; rentals at typical pace (median 24d on market — plan ~3-4 weeks tenant-placement turnaround); 300 units permitted in Portsmouth city in 2024 (112 in 5+ unit buildings).
- This rent runs 44% of the median local income ($62k/yr) — at the standard rent-burdened threshold; future hikes will face affordability resistance.
Forward outlook
- Local home prices are declining (-3.0%/yr); year-one equity from $1k of loan paydown is wiped out by about $5k of value loss. Plan a longer hold.
- At projected returns (-3.0% appreciation + 8.0% rent growth), your $46k cash investment doubles in ~6 years — after that, you're playing with house money.
Negotiation context
- Only 3 days on market — expect competitive offers; lowballing is unlikely to land.
- 5 sale attempts with the ask held roughly flat each time — persistent listings suggest the price (not the market) is what's stuck; bring a comps-based counter.
Risks & watch-outs
- Climate carrying-cost: severe wind risk, 80% chance of damaging wind over 30y; extreme-heat days projected 7→16/yr by 2055 (HVAC capex compounding) — expect insurance premiums to compound above CPI over the hold.
Questions for the listing agent
- Built in 1974 — when were the roof, HVAC, electrical panel, plumbing, and water heater last replaced?
- Is there a deadline driving the sale (1031 exchange, divorce, estate, relocation)? That informs how much negotiation room exists.
- Schools are B-rated — typically a magnet for longer-tenancy family renters. What's the average tenant stay here, and is there a school-zone premium baked into asking?
- Crime grade is F in this area — have there been break-ins, vandalism, or insurance claims at this property in the last 3 years? What carrier currently insures it and at what premium?
- What's the average days-on-market for RENTAL listings here right now (not sales)? A rising rental-DOM trend means longer vacancies and softer asking-rent achievability than the comps imply.
- What's the recent tenant-quality profile in this submarket — average credit score on applications, eviction rate, late-payment / NSF rate, and stable-employment percentage? A property-management company in the area should have these aggregated.
- How much new for-sale + rental construction is in the pipeline within 1–3 miles? Heavy new supply typically softens prices + rents 12–24 months out; constrained supply supports both.
Investment metrics
- 1% rule
- 1.39% ✓
- Cap rate
- 10.77%
- Cash-on-cash
- 15.98%
- DSCR
- 1.71
- GRM
- 6.0
CMA / ARV
- ARV (on-the-fly)
- $274,142
- Comps found
- 12
Show comp detail 12 sales within ~0.75 mi
| Address | Dist | Beds/Ba | Sqft | Sold | Price | $/sf | Match |
|---|---|---|---|---|---|---|---|
| 1109 Lakeview Dr | 0.00mi | 3/1.5 | 1,466 (0%) | 1mo | $166,000 | $113 | 99 |
| 1405 Quiet Ct | 0.20mi | 3/2.0 | 1,540 (+5%) | 2mo | $280,000 | $182 | 79 |
| 1417 Holt Dr | 0.25mi | 3/1.0 | 1,431 (-2%) | 6mo | $241,000 | $168 | 77 |
| 1400 Roosevelt Blvd | 0.06mi | 4/1.5 (+1) | 1,593 (+9%) | 4mo | $255,000 | $160 | 74 |
| 1122 Carrington Cres S | 0.49mi | 3/1.0 | 1,425 (-3%) | 5mo | $137,750 | $97 | 66 |
| 6 Jamal Ct | 0.60mi | 3/2.0 | 1,542 (+5%) | 1mo | $313,500 | $203 | 61 |
| 1414 Loren Cres | 0.57mi | 3/1.5 | 1,593 (+9%) | 1mo | $195,000 | $122 | 58 |
| 1502 Basie Cres | 0.75mi | 3/2.0 | 1,500 (+2%) | 4mo | $300,000 | $200 | 56 |
| 1404 Cole Rd | 0.50mi | 3/2.0 | 1,600 (+9%) | 5mo | $322,900 | $202 | 55 |
| 1013 Warfield Dr | 0.68mi | 4/2.0 (+1) | 1,415 (-4%) | 4mo | $315,000 | $223 | 53 |
| 2 Ross Ct | 0.41mi | 3/2.0 | 1,684 (+15%) | 4mo | $315,000 | $187 | 51 |
| 1009 Liston Ln | 0.72mi | 3/1.5 | 1,600 (+9%) | 3mo | $310,000 | $194 | 49 |
Match score weights: distance 35% · size 25% · config 20% · recency 20%. Top-matched comps best support the ARV.
Projected returns pro-forma
-3.0% appreciation · 8.0% rent growth · sell at horizon
- IRR
- 12.6%
- Equity multiple
- 1.53×
- Total profit
- $24,636
- Equity at exit
- $24,602
- IRR
- 25.3%
- Equity multiple
- 3.76×
- Total profit
- $127,332
- Equity at exit
- $14,266
Cash invested: $46,200 (down + closing). Projections, not guarantees.
Landlord ↔ Tenant lean methodology
- Overall (STATE)
- 55 Moderately Landlord-Leaning
- State Virginia
- 55 Moderately Landlord-Leaning · D+2
- County
- — inherits STATE
- City
- — inherits STATE
ZIP-level market 23701
- Rents YoY
- 11.9%
- Active inventory
- 167
- Price-to-rent
- 6.0×
Monthly cashflow live
- Estimated rent
- $2,292 high interval (Pro) →
- Mortgage (P&I)
- −$865
- Tax from tax record
- −$262 /mo · $3,139/yr
- Insurance
- −$69
- HOA
- −$0
- Vacancy / Maint / Mgmt
- −$481
- Net cashflow
- $615
Break-even live
UW: 25.0% down · 7.5% · 30yr · 1.5% tax · 5.0% vac · 8.0% maint · 8.0% mgmt
Financing live
Cash to close
- Down payment
- $41,250
- Closing costs
- $4,950
- Reserves months
- —
- Total cash needed
- —
Loan-product check · same deal, 3 products live
Conventional
25% down · 7.5% · 30yr
- Down + closing
- —
- Monthly P&I
- —
- Monthly cashflow
- —
- DSCR
- —
- Eligible?
- —
Personal DTI + credit; lowest rate.
DSCR
20% down · 8.5% · 30yr
- Down + closing
- —
- Monthly P&I
- —
- Monthly cashflow
- —
- DSCR
- —
- Eligible?
- —
No personal income docs; deal must DSCR.
Hard money
10% down · 12.0% · 12mo
- Down + closing
- —
- Monthly P&I
- —
- Monthly cashflow
- —
- DSCR
- —
- Eligible?
- —
Short-term bridge; refi at stabilization.
Rent comps 8 comps
| Address | Beds | Baths | Sqft | Rent | $/sqft | DOM | Units | Dist |
|---|---|---|---|---|---|---|---|---|
| 1217 Lakeview Dr Portsmouth, VA | 4.0 | 2.0 | 1425 | $2,550 | $1.79 | 7d | 1 | 0.10mi |
| 4642 Greenwood Dr Portsmouth, VA | 2.0 | 1.0 | 946 | $1,550 | $1.64 | 43d | 1 | 0.82mi |
| 902 Liston Ln Portsmouth, VA | 3.0 | 1.0 | 1039 | $1,785 | $1.72 | 23d | 1 | 0.86mi |
| 705 Warfield Dr Portsmouth, VA | 3.0 | 1.5 | 1269 | $2,100 | $1.65 | 17d | 1 | 1.00mi |
| 840 Lancer Dr Unit 694 Portsmouth, VA | 3.0 | 1.5 | 1202 | $1,480 | $1.23 | 17d | 1 | 1.27mi |
| 840 Lancer Dr Unit 615 Portsmouth, VA | 2.0 | 1.5 | 1002 | $1,288 | $1.29 | 23d | 1 | 1.27mi |
| 3208 Sir Meliot Dr Chesapeake, VA | 3.0 | 2.0 | 1400 | $2,295 | $1.64 | 23d | 1 | 1.42mi |
| 846 Drawbridge Dr Chesapeake, VA | 3.0 | 2.0 | 1400 | $2,600 | $1.86 | 23d | 1 | 1.47mi |
Listing history 9 events
-
2026-01-09status Under Contract
-
2026-01-06$165,000 Active
-
2025-12-30status Active
-
2025-12-30historical
-
2025-12-17status Under Contract
-
2025-08-29status Active Under Contract
-
2025-08-29historical
-
2025-08-25Active Under Contract
-
2025-08-22$165,000
ⓘ Source: listings_history table (triggers on properties + properties_extension) + one-shot
backfill from property_details.listing_events for pre-trigger history.
Tax reassessment forecast VA · Resets to sale price
- Current annual tax
- $3,139 · $262/mo
- Projected year-2 tax
- $3,139 · $262/mo
- Expected delta
- $0/yr ($0/mo · 0.0%)
ⓘ Screening estimate from a state-policy table — verify with the county assessor before closing.
Climate risk First Street
- Flood 1/10 Low FEMA zone X (unshaded) · 0% chance over 30 yrs
- Wildfire 2/10 Low
- Heat 9/10 Extreme 7 d/yr ≥106°F today · 16 d/yr by 30 yrs out
- Wind 8/10 Severe 80% chance of damaging wind over 30 yrs
- Air quality 2/10 Low 2 unhealthy d/yr today · 2 by 30 yrs out
Nearby sold comps map
Loading sold comps map…
Walkable amenities ~0.75 mi
Loading nearby amenities…
Taxation est. · year 1
- Rental income
- $27,508
- − Mortgage interest
- −$9,243
- − Property taxes
- −$3,139
- − Insurance
- −$825
- − Repairs & maintenance
- −$2,201
- − Management
- −$2,201
- − Depreciation
- −$4,800
- Taxable income
- $5,100
- Est. tax owed @ 24.0%
- −$1,224
- After-tax cash flow
- $6,160/yr
For passive investors: Depreciation is non-cash, so a rental often shows a tax loss while cash-flowing — sheltering income. Rental losses are passive: they offset passive income freely, and up to $25,000/yr can offset ordinary (W-2) income if you actively participate and your MAGI is under $100k (phasing out to $0 by $150k); unused losses carry forward. On sale, claimed depreciation is recaptured at up to 25%, and gains may owe capital-gains tax (a 1031 exchange can defer both). Figures are a year-1 estimate at your 24.0% rate — not tax advice; consult a CPA.
Schools (NCES district)
- District
- Portsmouth City Public School District
- NCES district ID
- 5103000
- Math proficiency
- 34% ▼ -40.00%
- Reading proficiency
- 58% ▼ -12.00%
- Median HH income
- $46,152
- Composite
- 39.01/100
- National rank
- #4071
- State rank
- #107 of 131 in VA
Livability — Portsmouth
- Score
- 73/100
- State rank
- #172
- US rank
- #5381
Category grades
Schools grade is shown separately in the Schools card above.
Census & demographics
- Census place
- Portsmouth, VA
- County
- Portsmouth City · 96,366 people
- City population
- 96,366
- Metro
- Virginia Beach-Norfolk-Newport News, VA-NC
- Population (ZIP)
- 24,298
- Household income
- $62,349
- Rent vs Own
- Severe rent burden
- 580.0
Population outlook (Portsmouth County) Hauer SSP2
- Today (2025)
- 96,730 people
- By 2030
- 96,760 · +0.0%
- By 2040
- 96,573 · -0.2%
- By 2050
- 95,606 · -1.2%
- By 2075
- 93,579 · -3.3%
- By 2100
- 83,756 · -13.4%
Race, ethnicity, and origin ACS 2023
- Neighborhood character
- Diverse neighborhood (Simpson 0.58)
- Race & ethnicity
- Black 52% White 39% Two or more races 6% Hispanic / Latino 3%
- Common ancestry
- Italian 1% Romanian 1% Slovak 1%
- Foreign-born
- 2% · Canada
- Languages at home
- 96% English-only · Spanish 2%
Political lean MEDSL · Portsmouth
- 2024 margin
- Solid D (+38.6) · D 68.6% · R 30.0% · Other 1.4%
- 2008→2024 swing
- -0.7pp no change · 2008: 39.3pp · 2024: 38.6pp
- All cycles
- 2024: D+38.6 2020: D+40.8 2016: D+36.5 2012: D+39.6 2008: D+39.3
Not yet ingested
- Civics
- —
Market trends
- HPI YoY
- ▼ -218.96%
- Current HPI
- 310.8218
- Rent YoY
- ▲ 11.92%
- Metro
- Virginia Beach-Norfolk-Newport News, VA-NC
- State GDP YoY
- ▲ 2.40%
- F500 in state
- 50
Industry mix (Fortune 500 HQ in VA)
| Industry | F500 HQs | Revenue |
|---|---|---|
| Aerospace / Defense | 4 | $236B |
|
||
| Technology / Defense | 3 | $32B |
|
||
| Financial Services | 2 | $176B |
|
||
| Utilities | 2 | $27B |
|
||
| Insurance | 2 | $25B |
|
||
| Technology | 2 | $15B |
|
||
Price history
+0.0% since first listed9 events — show timeline
- 2026-01-09 Pending — REINMLS
- 2026-01-06 Listed $165,000 REINMLS
- 2025-12-30 Relisted — REINMLS
- 2025-12-30 Listing Removed — REINMLS
- 2025-12-17 Pending — REINMLS
- 2025-08-29 Relisted — REINMLS
- 2025-08-29 Listing Removed — REINMLS
- 2025-08-25 Listed — REINMLS
- 2025-08-22 Listed $165,000 REINMLS
Property tax history
+2.1%/yrLatest (2025): $3,139 · +2.0% YoY. Source: county tax records.
Cash-flow waterfall
monthlySold comps — $/sqft
last 12 mo · ≤1 miLoading sold comps…