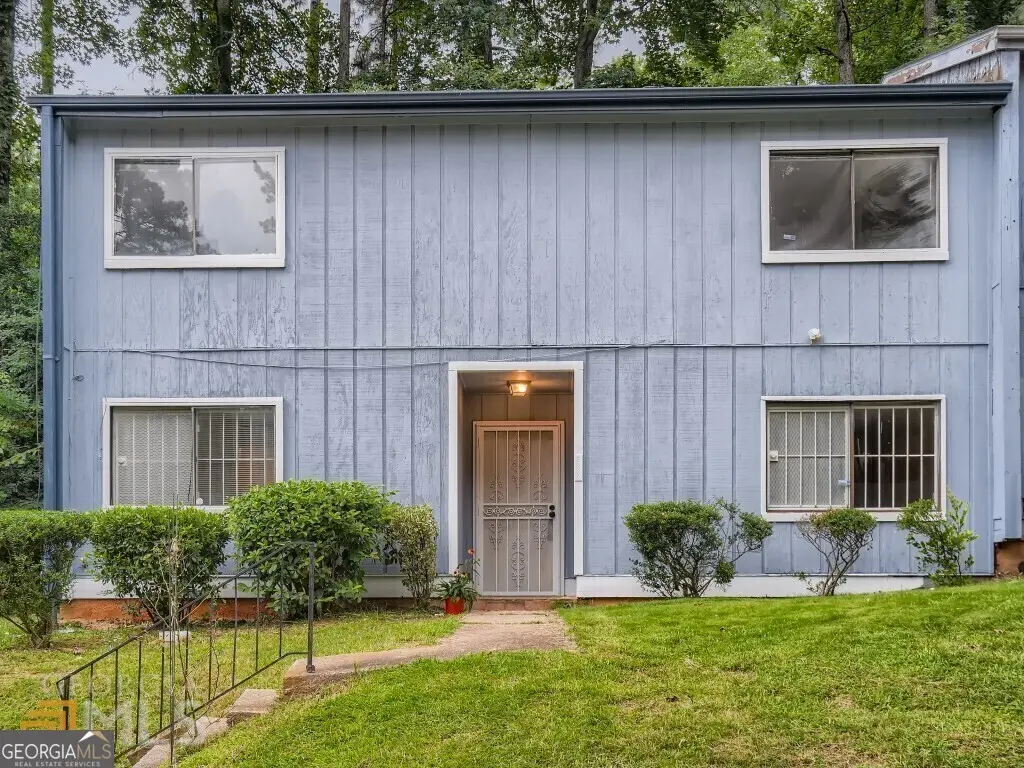
967 Pine Hollow Rd · Mableton, GA
Flood risk 1/10 · Minimal
- FEMA flood zone
- X (unshaded)
- Chance of flooding over 30 yrs
- 0.0%
- Est. flood insurance / yr
- $507 – $1,088
Fire risk 1/10 · Minimal
- Est. fire insurance / yr
- $963 – $1,789
Heat risk 5/10 · Moderate
- Hot days now (above 103°F)
- 7 days/yr
- Hot days in 30 yrs
- 16 days/yr
Wind risk 4/10 · Minor
- Chance of severe wind over 30 yrs
- 21.0%
Air-quality risk 4/10 · Minor
- Unhealthy air days now
- 4 days/yr
- Unhealthy air days in 30 yrs
- 5 days/yr
Risk factors via First Street. Map © Google.
Why this score? — see what drove the C+ grade
The composite is a weighted blend of 9 inputs, each scored 0–100. Each bar is that input's sub-score; the figure is the points it added to the 100-point composite (weight × sub-score).
- Cash flow +25.0/30.0
- DSCR +8.1/10.0
- 1% rule +7.9/10.0
- ARV discount +7.5/15.0
- Schools +3.8/10.0
- Livability +3.5/5.0
- Rent growth +2.7/5.0
- Condition / age +2.5/5.0
- Appreciation +0.0/10.0
$155,000
🖨 Deal sheet (PDF) 📄 Offer letter ✓ Due diligence
Listing remarks
Outstanding rental income opportunity! This property was fully renovated in 2022, featuring an updated kitchen with new appliances, refreshed bathrooms, fresh paint, and new carpet. Located just minutes from shopping, dining options, Six Flags Over Georgia, the Aquatic & Recreation Center, and easy freeway access. This professionally managed home will be sold with tenant in place. Interior photos were taken prior to the tenant's move-in. Home is currently occupied, kindly refrain from approaching or lingering around the property until an appointment is scheduled and confirmed. Photos taken prior to current occupancy.
Key facts
- Fully renovated
- Fresh paint
- New appliances
Tags
Property features AI
Finance
- Other: Lot approximately 0.02 acres (871.2 sq ft)
- HOA & community: Has an association; Association covers grounds maintenance and other items; Street lights in the community
Exterior
- Parking: Assigned parking
- Utilities: Private water; Public sewer; Electricity on individual meters; Water on individual meters; Sewer connected
- Home design: Residential income property; Multi-family townhouse; Townhouse structure type
- Construction: Built in 1974
- Exterior features: Wood siding
Interior
- Heating & cooling: Central heating; Central air conditioning; Ceiling fans
- Interior features: Two levels; No basement; No fireplaces
Neighborhood map
What this means for you Summary
Snapshot
- This is a 3-bed/2.5-bath condo listed at $155k.
Deal economics
- At list price, monthly cash flow is $336 ($4k/yr) — positive.
- The deal already cash-flows at list — no discount required.
- Meets the 1% rule at list price ($2k rent vs $155k).
- Recommended offer: $150k (3.0% below list) — sets the bar for market timing.
- Cap rate 8.9% vs local median 4.0% in Mableton — top-decile yield for the area; either an underpriced asset or a hidden risk that comps aren't pricing in. Stress-test before assuming the spread holds.
Location & tenants
- Location reads 70/100 on livability (#94 in GA) — a middle-class / working-renter tenant base. Strengths: housing A+, cost of living A-, crime B+; Watch: amenities F, commute D-.
- Cobb County (suburban): math 39% / reading 45% proficiency, ranked #25 of 174 in GA (top 14%) — families likely to look elsewhere, expect single-tenant / working-renter base with shorter leases.
- Zoned schools: Bryant Elementary School (math 13% / reading 17%, grade F, #981 of 1,228 statewide, top 80%, 865 students, 86% FRL); Lindley Middle School (math 15% / reading 22%, grade F, #372 of 470 statewide, top 80%, 1,096 students, 82% FRL); Pebblebrook High School (math 23% / reading 30%, grade F, #171 of 424 statewide, top 41%, 2,511 students, 70% FRL) — zoned schools average 80% FRL vs 39% district-wide (41 pts higher); higher-poverty schools than district average — tighter screening recommended.
- Zoned-school proficiency averages 20% at this address vs 42% district-wide (-22 pts) — the specific schools serving this property underperform the Cobb County average; the district grade overstates school quality for this exact location.
- Market conditions: Rents flat; 129 active listings in the ZIP; 27 comparable units currently listed for rent nearby; rentals at typical pace (median 22d on market — plan ~3-4 weeks tenant-placement turnaround); 41% of comp listings sitting > 30 days — soft ceiling on asking rent; 1,625 units permitted in Cobb County in 2024 (389 in 5+ unit buildings).
- This rent runs 37% of the median local income ($64k/yr) — at the standard rent-burdened threshold; future hikes will face affordability resistance.
Forward outlook
- Local home prices are declining (-3.0%/yr); year-one equity from $1k of loan paydown is wiped out by about $5k of value loss. Plan a longer hold.
- Cobb County population projected at +33% by 2050 — long-run rental-demand tailwind backs the buy-and-hold thesis.
Negotiation context
- It's been on market 59 days — a 3% lower offer ($150k) is reasonable based on typical stale-listing flexibility.
- 11 sale attempts since 7y ago with the ask held roughly flat each time — persistent listings suggest the price (not the market) is what's stuck; bring a comps-based counter.
- Current owner paid $120k; 29% above their basis — modest negotiation headroom, anchor on the comps not their cost.
Risks & watch-outs
- Climate carrying-cost: extreme-heat days projected 7→16/yr by 2055 (HVAC capex compounding) — expect insurance premiums to compound above CPI over the hold.
Questions for the listing agent
- It's been on market 59 days. Have you received any prior offers? Is the seller open to a 3% concession, seller financing, or rate buy-down credit?
- Built in 1974 — when were the roof, HVAC, electrical panel, plumbing, and water heater last replaced?
- What does the HOA fee cover, when was the last increase, and are there any pending special assessments or reserve-fund shortfalls?
- Any open or pending special assessments — roof, HVAC, plumbing, elevator, façade? What's the per-unit balance and payoff schedule, and is the seller paying it off at close or rolling it to the buyer?
- Is there a deadline driving the sale (1031 exchange, divorce, estate, relocation)? That informs how much negotiation room exists.
- Schools are F-rated, which usually means shorter tenancies and higher turnover. Who's the typical renter profile here, and what's been the actual vacancy rate?
- What's the average days-on-market for RENTAL listings here right now (not sales)? A rising rental-DOM trend means longer vacancies and softer asking-rent achievability than the comps imply.
- What's the recent tenant-quality profile in this submarket — average credit score on applications, eviction rate, late-payment / NSF rate, and stable-employment percentage? A property-management company in the area should have these aggregated.
- How much new apartment / multifamily construction is in the pipeline within 1–3 miles? Heavy new supply (>2% of stock underway) typically softens rents 12–24 months out; light construction supports rent growth.
Investment metrics
- 1% rule
- 1.29% ✓
- Cap rate
- 8.89%
- Cash-on-cash
- 9.29%
- DSCR
- 1.41
- GRM
- 6.5
CMA / ARV
No comps found within radius.
Projected returns pro-forma
-3.0% appreciation · 0.77% rent growth · sell at horizon
- IRR
- -5.1%
- Equity multiple
- 0.82×
- Total profit
- $-7,968
- Equity at exit
- $23,111
- IRR
- 1.5%
- Equity multiple
- 1.09×
- Total profit
- $3,963
- Equity at exit
- $13,402
Cash invested: $43,400 (down + closing). Projections, not guarantees.
Landlord ↔ Tenant lean methodology
- Overall (STATE)
- 90 Strongly Landlord-Friendly
- State Georgia
- 90 Strongly Landlord-Friendly · R+3
- County
- — inherits STATE
- City
- — inherits STATE
ZIP-level market 30168
- Home prices YoY
- -25.5%
- Rents YoY
- 0.8%
- Active inventory
- 129
- Price-to-rent
- 6.5×
Monthly cashflow live
- Estimated rent
- $1,997 high interval (Pro) →
- Mortgage (P&I)
- −$813
- Tax from tax record
- −$139 /mo · $1,670/yr
- Insurance
- −$65
- HOA est. from 1 same-building comp
- −$225
- Vacancy / Maint / Mgmt
- −$419
- Net cashflow
- $336
Break-even live
Sensitivity live
| Price | -10% $424 | -5% $380 | +0% $336 | +5% $292 | +10% $248 |
|---|---|---|---|---|---|
| Rent | -10% $178 | -5% $257 | +0% $336 | +5% $415 | +10% $494 |
| Rate | -1.0pp $414 | -0.5pp $375 | base $336 | +0.5pp $296 | +1.0pp $255 |
UW: 25.0% down · 7.5% · 30yr · 1.5% tax · 5.0% vac · 8.0% maint · 8.0% mgmt
Financing live
Cash to close
- Down payment
- $38,750
- Closing costs
- $4,650
- Reserves months
- —
- Total cash needed
- —
Loan-product check · same deal, 3 products live
Conventional
25% down · 7.5% · 30yr
- Down + closing
- —
- Monthly P&I
- —
- Monthly cashflow
- —
- DSCR
- —
- Eligible?
- —
Personal DTI + credit; lowest rate.
DSCR
20% down · 8.5% · 30yr
- Down + closing
- —
- Monthly P&I
- —
- Monthly cashflow
- —
- DSCR
- —
- Eligible?
- —
No personal income docs; deal must DSCR.
Hard money
10% down · 12.0% · 12mo
- Down + closing
- —
- Monthly P&I
- —
- Monthly cashflow
- —
- DSCR
- —
- Eligible?
- —
Short-term bridge; refi at stabilization.
Rent comps 27 comps
| Address | Beds | Baths | Sqft | Rent | $/sqft | DOM | Units | Dist |
|---|---|---|---|---|---|---|---|---|
| 1138 Summerstone Trce Austell, GA | 3.0 | 2.5 | 1500 | $1,736 | $1.16 | 3d | 1 | 0.22mi |
| 1032 Winterglen Way Austell, GA | 3.0 | 2.5 | 1506 | $2,075 | $1.38 | 44d | 1 | 0.24mi |
| 1047 Winterglen Way Austell, GA | 3.0 | 2.0 | 1390 | $1,879 | $1.35 | 3d | 1 | 0.27mi |
| 859 Springchase Dr Austell, GA | 3.0 | 2.0 | 1530 | $5,800 | $3.79 | 44d | 1 | 0.36mi |
| 595 Riverside Pkwy Austell, GA | 1.0–2.0 | 1.0 | 973 | $1,059 | $1.09 | 6d | 7 | 0.55mi |
| 1334 Ambercrest Way Austell, GA | 3.0 | 2.5 | 1902 | $2,350 | $1.24 | 23d | 1 | 0.82mi |
| 1330 Ling Dr Austell, GA | 3.0 | 2.0 | 2124 | $1,999 | $0.94 | 3d | 1 | 0.84mi |
| 1350 Ambercrest Way Austell, GA | 3.0 | 2.5 | 1390 | $2,061 | $1.48 | 21d | 1 | 0.86mi |
| 7262 Bridgeport Ct Austell, GA | 3.0 | 2.5 | 1390 | $2,020 | $1.45 | 20d | 1 | 0.97mi |
| 7063 Grinder Ct Austell, GA | 4.0 | 2.0 | 1856 | $2,100 | $1.13 | 44d | 1 | 0.97mi |
| 325 Riverside Pkwy SW Austell, GA | 1.0–3.0 | 1.0–2.0 | 1029 | $1,630 | $1.58 | 44d | 9 | 0.97mi |
| 836 Revena Dr Austell, GA | 4.0 | 2.5 | 1702 | $2,105 | $1.24 | 6d | 1 | 1.00mi |
| 1357 Ling Dr Austell, GA | 3.0 | 2.0 | 1176 | $1,805 | $1.53 | 44d | 1 | 1.01mi |
| 597 S Gordon Rd SW Mableton, GA | 3.0 | 1.0 | 1118 | $4,500 | $4.03 | 44d | 1 | 1.04mi |
| 1076 Timber Trl Austell, GA | 4.0 | 3.5 | 2235 | $2,540 | $1.14 | 4d | 1 | 1.09mi |
| 6607 Ivy Log Dr Austell, GA | 2.0 | 2.0 | 1425 | $1,728 | $1.21 | 44d | 1 | 1.13mi |
| 7072 Shenandoah Trl Austell, GA | 4.0 | 3.0 | 1928 | $1,861 | $0.97 | 16d | 1 | 1.13mi |
| 7076 Shenandoah Trl Austell, GA | 4.0 | 2.5 | 1928 | $2,165 | $1.12 | 44d | 1 | 1.14mi |
| 6619 Ivy Log Dr Austell, GA | 2.0 | 2.5 | 1160 | $1,595 | $1.38 | 25d | 1 | 1.15mi |
| 7440 Riverside Pkwy SW Austell, GA | 2.0–3.0 | 2.0 | 1145 | $1,645 | $1.44 | 3d | 4 | 1.16mi |
| 6623 Ivy Log Dr Austell, GA | 2.0 | 2.5 | 1160 | $1,600 | $1.38 | 19d | 1 | 1.16mi |
| 6702 Songwood Dr Austell, GA | 3.0 | 2.0 | 1527 | $3,200 | $2.10 | 44d | 1 | 1.29mi |
| 6712 Ivy Log Dr Austell, GA | 3.0 | 2.0 | 1500 | $1,750 | $1.17 | 44d | 1 | 1.31mi |
| 7036 Ivy Pointe Row Austell, GA | 3.0 | 2.0 | 1629 | $2,000 | $1.23 | 44d | 1 | 1.31mi |
| 879 Howard Ct SW Mableton, GA | 3.0 | 2.0 | 1435 | $1,250 | $0.87 | 20d | 1 | 1.36mi |
| 848 Howard Ct SW Mableton, GA | 3.0 | 2.0 | 1435 | $1,045 | $0.73 | 6d | 1 | 1.38mi |
| 7069 Silver Bend Overlook Austell, GA | 3.0 | 2.5 | 1888 | $2,140 | $1.13 | 6d | 1 | 1.47mi |
HOA detail condo
- Monthly dues
- $0 · $0/yr
- Assessments
- None detected in remarks — confirm with the listing agent.
Listing history 50 events
-
2026-06-21days on market $155,000 Active 59 DOM
-
2026-06-18days on market $155,000 Active 56 DOM
-
2026-06-17days on market $155,000 Active 55 DOM
-
2026-06-16days on market $155,000 Active 54 DOM
-
2026-06-15days on market $155,000 Active 53 DOM
-
2026-06-13days on market $155,000 Active 51 DOM
-
2026-06-13days on market $155,000 Active 50 DOM
-
2026-06-09days on market $155,000 Active 47 DOM
-
2026-06-08days on market $155,000 Active 46 DOM
-
2026-06-07days on market $155,000 Active 45 DOM
-
2026-06-04days on market $155,000 Active 42 DOM
-
2026-06-03days on market $155,000 Active 41 DOM
-
2026-06-02days on market $155,000 Active 40 DOM
-
2026-06-01days on market $155,000 Active 39 DOM
-
2026-05-31days on market $155,000 Active 38 DOM
-
2026-04-21$155,000 New 628-char remark
-
2025-12-31historical
-
2025-10-27$159,900 New
-
2024-12-20historical
-
2024-12-20historical
-
2024-12-03price $160,000
-
2024-12-03price $160,000
-
2024-11-01$165,000 Active
-
2024-11-01$165,000 New
-
2022-12-22soldstatus $120,000
-
2022-11-21soldstatus $120,000 Sold
-
2022-11-21soldstatus $120,000 Closed
-
2022-10-25status Under Contract
-
2022-10-25status Pending
-
2022-10-22status Price Change
-
2022-10-22price $134,900
-
2022-10-22price $134,900
-
2022-10-14status Active
-
2022-10-10status Under Contract
-
2022-10-10status Pending
-
2022-10-09status Back On Market
-
2022-10-09status Active
-
2022-09-28status Pending
-
2022-09-28status Under Contract
-
2022-09-26price $144,900
-
2022-09-26price $144,900
-
2022-09-11price $149,900
-
2022-09-11price $149,900
-
2022-08-31$154,900 New
-
2022-08-31$154,900 Active
-
2019-07-25soldstatus $48,000
-
2019-07-17soldstatus $48,000 Sold
-
2019-07-15status Under Contract
-
2019-06-26price $58,998
-
2019-06-01price $58,999
ⓘ Source: listings_history table (triggers on properties + properties_extension) + one-shot
backfill from property_details.listing_events for pre-trigger history.
Tax reassessment forecast GA · Resets to sale price
- Current annual tax
- $1,670 · $139/mo
- Projected year-2 tax
- $1,670 · $139/mo
- Expected delta
- $0/yr ($0/mo · 0.0%)
ⓘ Screening estimate from a state-policy table — verify with the county assessor before closing.
Climate risk First Street
- Flood 1/10 Low FEMA zone X (unshaded) · 0% chance over 30 yrs
- Wildfire 1/10 Low
- Heat 5/10 Major 7 d/yr ≥103°F today · 16 d/yr by 30 yrs out
- Wind 4/10 Moderate 21% chance of damaging wind over 30 yrs
- Air quality 4/10 Moderate 4 unhealthy d/yr today · 5 by 30 yrs out
Nearby sold comps map
Loading sold comps map…
Walkable amenities ~0.75 mi
Loading nearby amenities…
Taxation est. · year 1
- Rental income
- $23,963
- − Mortgage interest
- −$8,682
- − Property taxes
- −$1,670
- − Insurance
- −$775
- − Repairs & maintenance
- −$1,917
- − Management
- −$1,917
- − HOA
- −$2,700
- − Depreciation
- −$4,509
- Taxable income
- $1,792
- Est. tax owed @ 24.0%
- −$430
- After-tax cash flow
- $3,601/yr
For passive investors: Depreciation is non-cash, so a rental often shows a tax loss while cash-flowing — sheltering income. Rental losses are passive: they offset passive income freely, and up to $25,000/yr can offset ordinary (W-2) income if you actively participate and your MAGI is under $100k (phasing out to $0 by $150k); unused losses carry forward. On sale, claimed depreciation is recaptured at up to 25%, and gains may owe capital-gains tax (a 1031 exchange can defer both). Figures are a year-1 estimate at your 24.0% rate — not tax advice; consult a CPA.
Schools (NCES district)
- District
- Cobb County
- NCES district ID
- 1301290
- Math proficiency
- 39% ▼ -15.00%
- Reading proficiency
- 45% ▼ -10.00%
- Median HH income
- $68,845
- Composite
- 37.93/100
- National rank
- #4308
- State rank
- #25 of 174 in GA
Livability — Mableton
- Score
- 70/100
- State rank
- #94
- US rank
- #7534
Category grades
Schools grade is shown separately in the Schools card above.
Census & demographics
- County
- Cobb County · 777,758 people
- City population
- 41,829
- Metro
- Atlanta-Sandy Springs-Alpharetta, GA
- Population (ZIP)
- 26,612
- Household income
- $64,059
- Rent vs Own
- Severe rent burden
- 993.0
Population outlook (Cobb County) Hauer SSP2
- Today (2025)
- 868,385 people
- By 2030
- 929,614 · +7.1%
- By 2040
- 1,047,533 · +20.6%
- By 2050
- 1,155,537 · +33.1%
- By 2075
- 1,405,030 · +61.8%
- By 2100
- 1,555,058 · +79.1%
Race, ethnicity, and origin ACS 2023
- Neighborhood character
- Diverse neighborhood (Simpson 0.55)
- Race & ethnicity
- Black 63% Hispanic / Latino 21% White 10% Two or more races 9% Asian 1%
- Hispanic origin (detail)
- Mexican 13%
- Common ancestry
- Italian 4% Hispanic 1%
- Foreign-born
- 19% · Canada
- Languages at home
- 74% English-only · Spanish 20% French/Haitian/Cajun 1% Other Indo-European 1%
Political lean MEDSL · Cobb
- 2024 margin
- D (+14.9) · D 56.9% · R 42.0% · Other 1.1%
- 2008→2024 swing
- +24.3pp toward D · 2008: -9.4pp · 2024: 14.9pp
- All cycles
- 2024: D+14.9 2020: D+14.3 2016: D+2.1 2012: R+12.6 2008: R+9.4
Not yet ingested
- Civics
- —
Market trends
- HPI YoY
- ▼ -84.55%
- Current HPI
- 246.7995
- Rent YoY
- ▲ 0.77%
- Metro
- Atlanta-Sandy Springs-Alpharetta, GA
- State GDP YoY
- ▲ 2.66%
- F500 in state
- 28
Industry mix (Fortune 500 HQ in GA)
| Industry | F500 HQs | Revenue |
|---|---|---|
| Paper / Packaging | 2 | $29B |
|
||
| Retail | 1 | $160B |
|
||
| Transportation / Logistics | 1 | $91B |
|
||
| Airlines | 1 | $62B |
|
||
| Consumer Goods | 1 | $47B |
|
||
| Utilities | 1 | $25B |
|
||
Price history
+264.7% since first listed39 events — show timeline
- 2026-04-21 Listed $155,000 GAMLS
- 2025-12-31 Listing Removed — GAMLS
- 2025-10-27 Listed $159,900 GAMLS
- 2024-12-20 Listing Removed — GAMLS
- 2024-12-20 Listing Removed — FMLS
- 2024-12-03 Price Changed $160,000 GAMLS
- 2024-12-03 Price Changed $160,000 FMLS
- 2024-11-01 Listed $165,000 GAMLS
- 2024-11-01 Listed $165,000 FMLS
- 2022-12-22 Sold (Public Records) $120,000 Public Records
- 2022-11-21 Sold (MLS) $120,000 FMLS
- 2022-11-21 Sold (MLS) $120,000 GAMLS
- 2022-10-25 Pending — GAMLS
- 2022-10-25 Pending — FMLS
- 2022-10-22 Relisted — GAMLS
- 2022-10-22 Price Changed $134,900 GAMLS
- 2022-10-22 Price Changed $134,900 FMLS
- 2022-10-14 Relisted — FMLS
- 2022-10-10 Pending — GAMLS
- 2022-10-10 Pending — FMLS
- 2022-10-09 Relisted — GAMLS
- 2022-10-09 Relisted — FMLS
- 2022-09-28 Pending — FMLS
- 2022-09-28 Pending — GAMLS
- 2022-09-26 Price Changed $144,900 GAMLS
- 2022-09-26 Price Changed $144,900 FMLS
- 2022-09-11 Price Changed $149,900 GAMLS
- 2022-09-11 Price Changed $149,900 FMLS
- 2022-08-31 Listed $154,900 FMLS
- 2022-08-31 Listed $154,900 GAMLS
- 2019-07-25 Sold (Public Records) $48,000 Public Records
- 2019-07-17 Sold (MLS) $48,000 GAMLS
- 2019-07-15 Pending — GAMLS
- 2019-06-26 Price Changed $58,998 GAMLS
- 2019-06-01 Price Changed $58,999 GAMLS
- 2019-02-15 Listed $64,900 GAMLS
- 1994-07-07 Sold (Public Records) $27,800 Public Records
- 1991-06-14 Sold (Public Records) $36,200 Public Records
- 1981-11-30 Sold (Public Records) $42,500 Public Records
Property tax history
+19.1%/yrLatest (2025): $1,670 · -0.1% YoY. Source: county tax records.
Cash-flow waterfall
monthlySold comps — $/sqft
last 12 mo · ≤1 miLoading sold comps…