 🏗️ New Construction
Anatolia Plan · Cleburne, TX
Flood risk 1/10 · Minimal
- FEMA flood zone
- X (unshaded)
- Chance of flooding over 30 yrs
- 0.0%
- Est. flood insurance / yr
- $507 – $1,088
Fire risk 6/10 · Moderate
- Est. fire insurance / yr
- $1,222 – $2,270
Heat risk 7/10 · Major
- Hot days now (above 110°F)
- 7 days/yr
- Hot days in 30 yrs
- 24 days/yr
Wind risk 6/10 · Moderate
- Chance of severe wind over 30 yrs
- 27.0%
Air-quality risk 2/10 · Minimal
- Unhealthy air days now
- 1 days/yr
- Unhealthy air days in 30 yrs
- 2 days/yr
Risk factors via First Street. Map © Google.
Why this score? — see what drove the B grade
The composite is a weighted blend of 9 inputs, each scored 0–100. Each bar is that input's sub-score; the figure is the points it added to the 100-point composite (weight × sub-score).
- Cash flow +30.0/30.0
- 1% rule +10.0/10.0
- DSCR +10.0/10.0
- ARV discount +7.5/15.0
- Condition / age +4.0/5.0
- Livability +3.4/5.0
- Schools +2.9/10.0
- Rent growth +2.3/5.0
- Appreciation +0.0/10.0
$109,995
🖨 Deal sheet 📄 Offer letter ✓ Due diligence
Listing remarks MLS
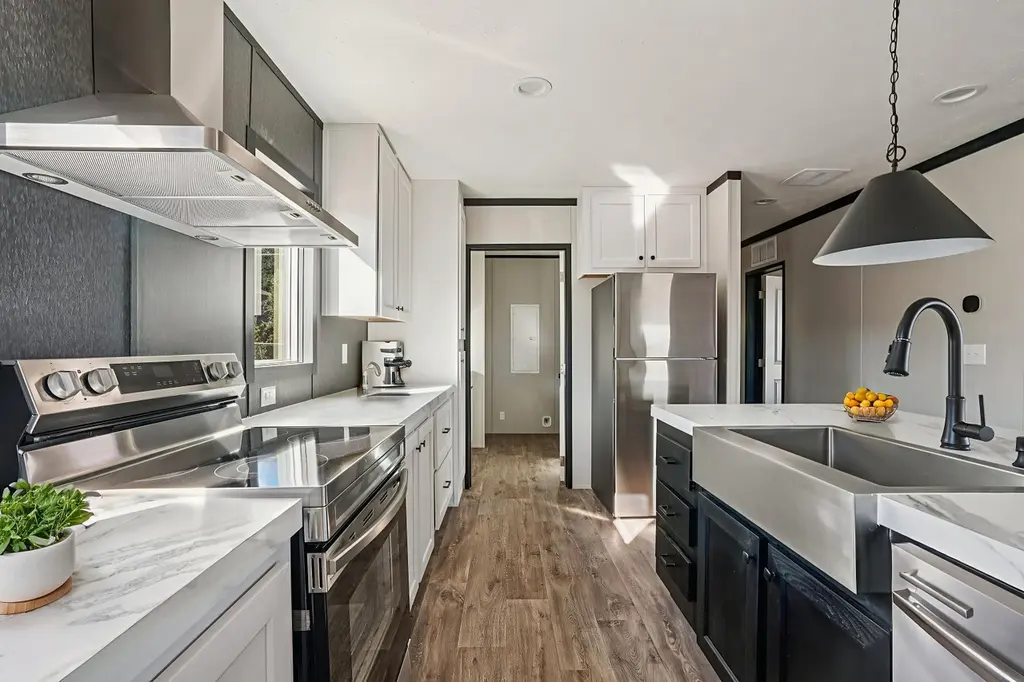
Beautiful open-concept home with an island kitchen and split-bedroom layout in Princeton's newest amenity-rich community, thoughtfully upgraded with Samsung appliances, Shaw carpeting, an Ecobee smart thermostat, and a hybrid heat pump water heater.
Key facts
- Listed 83 days
Neighborhood map
What this means for you Summary
Snapshot
- This is a 3-bed/2.0-bath manufactured listed at $110k. Condition is rated good.
Deal economics
- At list price, monthly cash flow is $702 ($8k/yr) — positive.
- The deal already cash-flows at list — no discount required.
- Meets the 1% rule at list price ($2k rent vs $110k).
- Recommended offer: $103k (6.0% below list) — sets the bar for market timing.
- Cap rate 14.0% vs local median 3.6% in Cleburne — top-decile yield for the area; either an underpriced asset or a hidden risk that comps aren't pricing in. Stress-test before assuming the spread holds.
Location & tenants
- Location reads 68/100 on livability (#460 in TX) — a middle-class / working-renter tenant base. Strengths: cost of living A+, housing A+, health & safety A+; Watch: employment C-, schools F, amenities F.
- Cleburne ISD (town): math 34% / reading 33% proficiency, ranked #537 of 826 in TX (top 65%) — families likely to look elsewhere, expect single-tenant / working-renter base with shorter leases.
- Market conditions: Rents soft (-0.8%/yr); 660 active listings in the ZIP; 7 comparable units currently listed for rent nearby; rentals leasing fast (median 1d on market — plan ~1-2 weeks tenant-placement turnaround); solid renter incomes; 2,152 units permitted in Johnson County in 2024 (76 in 5+ unit buildings).
Forward outlook
- Local home prices are declining (-3.0%/yr); year-one equity from $760 of loan paydown is wiped out by about $3k of value loss. Plan a longer hold.
- Johnson County population projected at +24% by 2050 — long-run rental-demand tailwind backs the buy-and-hold thesis.
- At projected returns (-3.0% appreciation + 0.0% rent growth), your $31k cash investment doubles in ~6 years — after that, you're playing with house money.
Negotiation context
- It's been on market 84 days — a 6% lower offer ($103k) is reasonable based on typical stale-listing flexibility.
Risks & watch-outs
- Climate carrying-cost: major wind risk, 27% chance of damaging wind over 30y; major wildfire risk; extreme-heat days projected 7→24/yr by 2055 (HVAC capex compounding) — expect insurance premiums to compound above CPI over the hold.
Questions for the listing agent
- It's been on market 84 days. Have you received any prior offers? Is the seller open to a 6% concession, seller financing, or rate buy-down credit?
- Why hasn't it sold? Are there any deal-killer items the seller is aware of (foundation, flood, title, zoning, code violations)?
- Is there a deadline driving the sale (1031 exchange, divorce, estate, relocation)? That informs how much negotiation room exists.
- Schools are F-rated, which usually means shorter tenancies and higher turnover. Who's the typical renter profile here, and what's been the actual vacancy rate?
- What's the average days-on-market for RENTAL listings here right now (not sales)? A rising rental-DOM trend means longer vacancies and softer asking-rent achievability than the comps imply.
- What's the recent tenant-quality profile in this submarket — average credit score on applications, eviction rate, late-payment / NSF rate, and stable-employment percentage? A property-management company in the area should have these aggregated.
- How much new for-sale + rental construction is in the pipeline within 1–3 miles? Heavy new supply typically softens prices + rents 12–24 months out; constrained supply supports both.
Investment metrics
- 1% rule
- 1.68% ✓
- Cap rate
- 13.95%
- Cash-on-cash
- 27.36%
- DSCR
- 2.22
- GRM
- 5.0
CMA / ARV
No comps found within radius.
Projected returns pro-forma
-3.0% appreciation · 0.0% rent growth · sell at horizon
- IRR
- 17.9%
- Equity multiple
- 1.70×
- Total profit
- $21,500
- Equity at exit
- $16,401
- IRR
- 24.2%
- Equity multiple
- 2.80×
- Total profit
- $55,455
- Equity at exit
- $9,510
Cash invested: $30,799 (down + closing). Projections, not guarantees.
Landlord ↔ Tenant lean methodology
- Overall (STATE)
- 87 Strongly Landlord-Friendly
- State Texas
- 87 Strongly Landlord-Friendly · R+5
- County
- — inherits STATE
- City
- — inherits STATE
ZIP-level market 76033
- Rents YoY
- -0.8%
- Active inventory
- 660
- Price-to-rent
- 5.0×
Monthly cashflow live
- Estimated rent
- $1,851 high interval (Pro) →
- Mortgage (P&I)
- −$577
- Tax est. 1.5%
- −$137 /mo · $1,650/yr
- Insurance
- −$46
- HOA
- −$0
- Vacancy / Maint / Mgmt
- −$389
- Net cashflow
- $702
Break-even live
UW: 25.0% down · 7.5% · 30yr · 1.5% tax · 5.0% vac · 8.0% maint · 8.0% mgmt
Financing live
Cash to close
- Down payment
- $27,499
- Closing costs
- $3,300
- Reserves months
- —
- Total cash needed
- —
Loan-product check · same deal, 3 products live
Conventional
25% down · 7.5% · 30yr
- Down + closing
- —
- Monthly P&I
- —
- Monthly cashflow
- —
- DSCR
- —
- Eligible?
- —
Personal DTI + credit; lowest rate.
DSCR
20% down · 8.5% · 30yr
- Down + closing
- —
- Monthly P&I
- —
- Monthly cashflow
- —
- DSCR
- —
- Eligible?
- —
No personal income docs; deal must DSCR.
Hard money
10% down · 12.0% · 12mo
- Down + closing
- —
- Monthly P&I
- —
- Monthly cashflow
- —
- DSCR
- —
- Eligible?
- —
Short-term bridge; refi at stabilization.
Rent comps 7 comps
| Address | Beds | Baths | Sqft | Rent | $/sqft | DOM | Units | Dist |
|---|---|---|---|---|---|---|---|---|
| 1501 Park Blvd Cleburne, TX | 3.0–4.0 | 2.0–3.0 | 1456 | $1,795 | $1.23 | 1d | 22 | 0.22mi |
| 1410 Hyde Park Blvd Cleburne, TX | 3.0 | 2.0 | 1528 | $2,111 | $1.38 | 1d | 1 | 0.60mi |
| 1404 Chaucer Dr Cleburne, TX | 4.0 | 2.0 | 1797 | $2,895 | $1.61 | 1d | 1 | 0.76mi |
| 1502 Sharron Ct Unit A Cleburne, TX | 2.0 | 2.0 | 1100 | $1,400 | $1.27 | 24d | 1 | 0.81mi |
| 1502 Sharron Ct Unit A Cleburne, TX | 2.0 | 2.0 | 1095 | $1,400 | $1.28 | 22d | 1 | 0.81mi |
| 1203 Stonelake Dr Cleburne, TX | 3.0 | 2.0 | 1550 | $2,000 | $1.29 | 4d | 1 | 0.83mi |
| 1211 Larkspur Ln Cleburne, TX | 3.0 | 2.0 | 1797 | $2,250 | $1.25 | 1d | 1 | 0.95mi |
Listing history 14 events
-
2026-06-18days on market $109,995 Active 84 DOM
-
2026-06-17days on market $109,995 Active 83 DOM
-
2026-06-16days on market $109,995 Active 82 DOM
-
2026-06-15days on market $109,995 Active 81 DOM
-
2026-06-13days on market $109,995 Active 79 DOM
-
2026-06-09days on market $109,995 Active 75 DOM
-
2026-06-08days on market $109,995 Active 74 DOM
-
2026-06-07days on market $109,995 Active 73 DOM
-
2026-06-04days on market $109,995 Active 70 DOM
-
2026-06-03days on market $109,995 Active 69 DOM
-
2026-06-02days on market $109,995 Active 68 DOM
-
2026-06-01days on market $109,995 Active 67 DOM
-
2026-05-31days on market $109,995 Active 66 DOM
-
2026-03-27$109,995 Active 249-char remark
Show marketing remark (249 chars)
Beautiful open-concept home with an island kitchen and split-bedroom layout in Princeton's newest amenity-rich community, thoughtfully upgraded with Samsung appliances, Shaw carpeting, an Ecobee smart thermostat, and a hybrid heat pump water heater.
ⓘ Source: listings_history table (triggers on properties + properties_extension) + one-shot
backfill from property_details.listing_events for pre-trigger history.
Climate risk First Street
- Flood 1/10 Low FEMA zone X (unshaded) · 0% chance over 30 yrs
- Wildfire 6/10 Major
- Heat 7/10 Severe 7 d/yr ≥110°F today · 24 d/yr by 30 yrs out
- Wind 6/10 Major 27% chance of damaging wind over 30 yrs
- Air quality 2/10 Low 1 unhealthy d/yr today · 2 by 30 yrs out
Nearby sold comps map
Loading sold comps map…
Walkable amenities ~0.75 mi
Loading nearby amenities…
Taxation est. · year 1
- Rental income
- $22,212
- − Mortgage interest
- −$6,161
- − Property taxes
- −$1,650
- − Insurance
- −$550
- − Repairs & maintenance
- −$1,777
- − Management
- −$1,777
- − Depreciation
- −$3,200
- Taxable income
- $7,097
- Est. tax owed @ 24.0%
- −$1,703
- After-tax cash flow
- $6,722/yr
For passive investors: Depreciation is non-cash, so a rental often shows a tax loss while cash-flowing — sheltering income. Rental losses are passive: they offset passive income freely, and up to $25,000/yr can offset ordinary (W-2) income if you actively participate and your MAGI is under $100k (phasing out to $0 by $150k); unused losses carry forward. On sale, claimed depreciation is recaptured at up to 25%, and gains may owe capital-gains tax (a 1031 exchange can defer both). Figures are a year-1 estimate at your 24.0% rate — not tax advice; consult a CPA.
Condition & rehab AI · 1 photo
This home is in excellent condition with modern finishes and a good layout. It is ready for a fresh coat of paint and some landscaping to enhance its curb appeal and value.
Value-add opportunities
- Both Painting exterior and interior walls — Fresh paint enhances curb appeal and interior aesthetics.
- Both Landscaping and curb appeal improvements — Enhances curb appeal and can attract more buyers/renters.
- Both Add smart home features — Enhances home's modern appeal and can be a selling point for buyers.
- Both Upgrade flooring in bathrooms — Modernizes the space and can be a selling point for buyers.
- Both Add smart lighting — Enhances home's modern appeal and can be a selling point for buyers.
Renovation cost estimate screening
Value-add ROI direction
- Both Painting exterior and interior walls — Fresh paint enhances curb appeal and interior aesthetics. ↑
- Both Landscaping and curb appeal improvements — Enhances curb appeal and can attract more buyers/renters. ↑
- Both Add smart home features — Enhances home's modern appeal and can be a selling point for buyers. ↑
- Both Upgrade flooring in bathrooms — Modernizes the space and can be a selling point for buyers. ↑
- Both Add smart lighting — Enhances home's modern appeal and can be a selling point for buyers. ↑
ⓘ Cost ranges are severity-bucket heuristics (US national rule-of-thumb). Get contractor quotes + a written scope before underwriting a rehab budget.
Schools (NCES district)
- District
- Cleburne ISD
- NCES district ID
- 4814310
- Math proficiency
- 34% ▼ -2.00%
- Reading proficiency
- 33% ▼ -2.00%
- Median HH income
- $48,788
- Composite
- 29.0/100
- National rank
- #6618
- State rank
- #537 of 826 in TX
Livability — Cleburne
- Score
- 68/100
- State rank
- #460
- US rank
- #9292
Category grades
Schools grade is shown separately in the Schools card above.
Census & demographics
- County
- Johnson County · 147,987 people
- City population
- 29,538
- Metro
- Dallas-Fort Worth-Arlington, TX
- Population (ZIP)
- 29,538
- Household income
- $76,292
- Rent vs Own
- Severe rent burden
- 927.0
Population outlook (Johnson County) Hauer SSP2
- Today (2025)
- 179,678 people
- By 2030
- 189,208 · +5.3%
- By 2040
- 207,261 · +15.4%
- By 2050
- 223,064 · +24.1%
- By 2075
- 259,979 · +44.7%
- By 2100
- 275,395 · +53.3%
Race, ethnicity, and origin ACS 2023
- Neighborhood character
- Majority White (64%)
- Race & ethnicity
- White 64% Hispanic / Latino 26% Two or more races 15% Black 4% Native American 1%
- Hispanic origin (detail)
- Mexican 23%
- Common ancestry
- Slovak 2% Italian 2% Portuguese 1%
- Foreign-born
- 8% · Canada, Guatemala, Vietnam
- Languages at home
- 81% English-only · Spanish 17% Other Asian/Pacific 2%
Political lean MEDSL · Johnson
- 2024 margin
- Solid R (+51.4) · D 23.9% · R 75.3%
- 2008→2024 swing
- -3.9pp toward R · 2008: -47.5pp · 2024: -51.4pp
- All cycles
- 2024: R+51.4 2020: R+53.0 2016: R+58.3 2012: R+55.6 2008: R+47.5
Not yet ingested
- Civics
- —
Market trends
- HPI YoY
- ▼ -202.75%
- Current HPI
- 246.0029
- Rent YoY
- ▼ -0.83%
- Metro
- Dallas-Fort Worth-Arlington, TX
- State GDP YoY
- ▲ 3.95%
- F500 in state
- 110
Industry mix (Fortune 500 HQ in TX)
| Industry | F500 HQs | Revenue |
|---|---|---|
| Energy | 16 | $1,198B |
|
||
| Technology | 5 | $198B |
|
||
| Engineering / Construction | 4 | $72B |
|
||
| Energy Services | 3 | $60B |
|
||
| Utilities | 3 | $41B |
|
||
| Healthcare | 2 | $330B |
|
||
Price history
1 event — show timeline
- 2026-03-27 Listed $109,995 Zillow
Cash-flow waterfall
monthlySold comps — $/sqft
last 12 mo · ≤1 miLoading sold comps…