 Multi-family
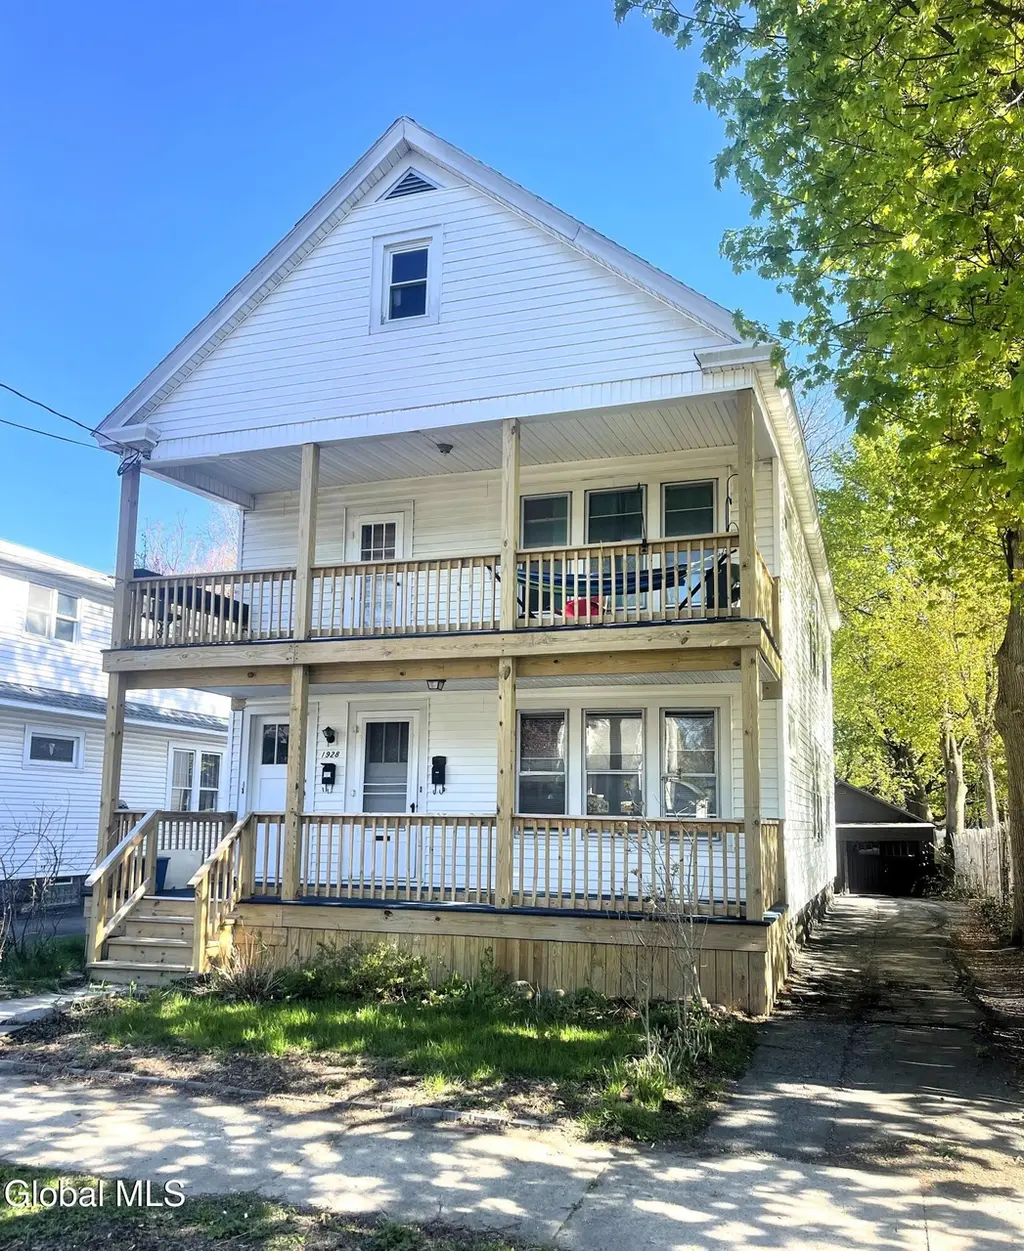
1928 Broad St · Schenectady, NY
Flood risk 1/10 · Minimal
- FEMA flood zone
- X (unshaded)
- Chance of flooding over 30 yrs
- 0.0%
- Est. flood insurance / yr
- $473 – $860
Fire risk 3/10 · Minor
- Est. fire insurance / yr
- $691 – $1,283
Heat risk 4/10 · Minor
- Hot days now (above 96°F)
- 7 days/yr
- Hot days in 30 yrs
- 16 days/yr
Wind risk 3/10 · Minor
- Chance of severe wind over 30 yrs
- 5.0%
Air-quality risk 1/10 · Minimal
- Unhealthy air days now
- 0 days/yr
- Unhealthy air days in 30 yrs
- 0 days/yr
Risk factors via First Street. Map © Google.
Why this score? — see what drove the B- grade
The composite is a weighted blend of 9 inputs, each scored 0–100. Each bar is that input's sub-score; the figure is the points it added to the 100-point composite (weight × sub-score).
- Cash flow +24.4/30.0
- ARV discount +15.0/15.0
- DSCR +7.9/10.0
- 1% rule +7.2/10.0
- Livability +3.9/5.0
- Schools +3.0/10.0
- Rent growth +2.5/5.0
- Condition / age +2.5/5.0
- Appreciation +0.0/10.0
$259,900
🖨 Deal sheet 📄 Offer letter ✓ Due diligence
Multi-family units
County records classify this as Multi-Family (2-4 Unit). Listing-text estimate: 1 unit. estimate disagrees with records
Listing remarks
Attention investors, owner-occupants, and those just beginning to build their real estate portfolio. Welcome to 1928 Broad Street, ideally located on the Schenectady/Rotterdam border in the Bellevue neighborhood. This well maintained two-unit property offers a total of 4 bedrooms and 2 full baths, along with a private driveway, 2-car garage, carport, and ample off-street parking an exceptional feature for tenants and owners alike. Enjoy a prime location just minutes from a variety of shopping, grocery stores, and restaurants, making everyday living convenient and enjoyable. With easy access to major roadways and a quick commute throughout the Capital Region, including Schenectady, Albany,
Key facts
- Near cdta bus line
- Private driveway
- 7,405 sq ft lot
Tags
Property features AI
Finance
- Financial info: Multi-family property with 2 units; Tenants pay cable, electricity, and gas
Exterior
- Parking: Detached garage; Carport; Paved off-street parking; Total of 6 parking spaces, including 2 garage spaces
- Security: Smoke detector(s); Carbon monoxide detector(s)
- Utilities: Public water; Public sewer; Cable available
- Home design: Duplex; Block foundation; Vinyl siding; Asphalt roof
- Construction: Vinyl siding construction; Block foundation; Asphalt roof
- Exterior features: Front porch; Rear porch; Back yard fencing; Cleared lot
Interior
- Kitchen: Each unit has a kitchen
- Bedrooms: Unit 1: two bedrooms (both on the 1st floor); Unit 2: two bedrooms (both on the 2nd floor)
- Flooring: Vinyl flooring; Hardwood flooring
- Bathrooms: Two full bathrooms total; Unit 1: one full bathroom (1st floor); Unit 2: one full bathroom (2nd floor)
- Heating & cooling: Forced air heating (natural gas); Central air conditioning
- Interior features: Full unfinished basement; Vinyl and hardwood flooring; Smoke and carbon monoxide detectors
- Laundry & utility: Tenant(s) responsible for electricity, gas, and cable
Neighborhood map
What this means for you Summary
Snapshot
- This is a 4-bed/2.0-bath multifamily listed at $260k.
Deal economics
- At list price, monthly cash flow is $530 ($6k/yr) — positive.
- The deal already cash-flows at list — no discount required.
- Meets the 1% rule at list price ($3k rent vs $260k).
- Cap rate 8.7% vs local median 6.3% in Schenectady — top-decile yield for the area; either an underpriced asset or a hidden risk that comps aren't pricing in. Stress-test before assuming the spread holds.
Location & tenants
- Location reads 78/100 on livability (#167 in NY, #2,597 nationally) — a middle-class / working-renter tenant base. Strengths: commute A+, health & safety A+, cost of living A; Watch: employment D+, crime F.
- Schenectady City School District (urban): math 38% / reading 34% proficiency, ranked #556 of 590 in NY (top 94%) — families likely to look elsewhere, expect single-tenant / working-renter base with shorter leases; 65% free/reduced lunch — lower-income household profile, screen leases tightly.
- Zoned schools: Schenectady High School (math 75% / reading 90%, grade A, #446 of 1,100 statewide, top 41%, 2,743 students, 71% FRL).
- Zoned-school proficiency averages 82% at this address vs 36% district-wide (+46 pts) — the actual schools serving this property are materially stronger than the Schenectady City School District average implies; a family-tenant draw the district grade alone would hide.
- Market conditions: 181 active listings in the ZIP; 4 comparable units currently listed for rent nearby; rentals at typical pace (median 14d on market — plan ~3-4 weeks tenant-placement turnaround); solid renter incomes; 154 units permitted in Schenectady County in 2024 (54 in 5+ unit buildings).
- At $3,175/mo this rent would consume 46% of the median local household income ($83k/yr) (locally 629% of renters already pay >50% of income on rent) — very limited rent-growth headroom before tenants either downsize or default.
Forward outlook
- Local home prices are declining (-3.0%/yr); year-one equity from $2k of loan paydown is wiped out by about $8k of value loss. Plan a longer hold.
- Schenectady County population projected to shrink 4% by 2050 — rents likely to lag national; underwrite the cash flow, not the appreciation.
Negotiation context
- Only 6 days on market — expect competitive offers; lowballing is unlikely to land.
Risks & watch-outs
- Watch-outs: built in 1928 — expect roof / HVAC / electrical / plumbing capex.
Questions for the listing agent
- Built in 1928 — when were the roof, HVAC, electrical panel, plumbing, and water heater last replaced?
- Is there a deadline driving the sale (1031 exchange, divorce, estate, relocation)? That informs how much negotiation room exists.
- Crime grade is F in this area — have there been break-ins, vandalism, or insurance claims at this property in the last 3 years? What carrier currently insures it and at what premium?
- What's the average days-on-market for RENTAL listings here right now (not sales)? A rising rental-DOM trend means longer vacancies and softer asking-rent achievability than the comps imply.
- What's the recent tenant-quality profile in this submarket — average credit score on applications, eviction rate, late-payment / NSF rate, and stable-employment percentage? A property-management company in the area should have these aggregated.
- How much new apartment / multifamily construction is in the pipeline within 1–3 miles? Heavy new supply (>2% of stock underway) typically softens rents 12–24 months out; light construction supports rent growth.
Investment metrics
- 1% rule
- 1.22% ✓
- Cap rate
- 8.74%
- Cash-on-cash
- 8.73%
- DSCR
- 1.39
- GRM
- 6.8
CMA / ARV
- ARV (median comp)
- $402,873
- List price
- $259,900
- Delta
- -35.49%
- Verdict
- UNDERPRICED
- Comps
- 20 within 1.0 mi
Show comp detail 12 sales within ~0.75 mi
| Address | Dist | Beds/Ba | Sqft | Sold | Price | $/sf | Match |
|---|---|---|---|---|---|---|---|
| 2026 Wabash Ave | 0.29mi | 4/2.0 | 2,068 (+8%) | 8mo | $273,000 | $132 | 67 |
| 1108 Cutler St | 0.41mi | 4/2.0 | 1,848 (-4%) | 10mo | $278,000 | $150 | 66 |
| 935 Davis Ter | 0.42mi | 4/2.0 | 2,000 (+4%) | 12mo | $36,000 | $18 | 64 |
| 417 Shannon St | 0.59mi | 4/2.0 | 1,900 (-1%) | 9mo | $244,000 | $128 | 63 |
| 1087 Davis Ter | 0.36mi | 4/2.0 | 2,208 (+15%) | 1mo | $150,000 | $68 | 58 |
| 2336 Turner Ave | 0.73mi | 4/3.0 | 1,932 (+1%) | 7mo | $190,000 | $98 | 55 |
| 2332 Turner Ave | 0.72mi | 5/3.0 (+1) | 1,932 (+1%) | 1mo | $255,000 | $132 | 55 |
| 1909 Euclid Ave | 0.38mi | 4/2.0 | 1,650 (-14%) | 12mo | $231,500 | $140 | 49 |
| 2119 Broadway | 0.45mi | 4/3.0 | 2,183 (+14%) | 5mo | $167,500 | $77 | 48 |
| 1267 Webster St | 0.62mi | 4/2.0 | 1,685 (-12%) | 10mo | $153,000 | $91 | 42 |
| 1226 2nd Ave | 0.75mi | 4/2.0 | 1,660 (-14%) | 10mo | $115,000 | $69 | 34 |
| 2330 Fairlee St | 0.74mi | 5/2.0 (+1) | 1,656 (-14%) | 6mo | $300,000 | $181 | 33 |
Match score weights: distance 35% · size 25% · config 20% · recency 20%. Top-matched comps best support the ARV.
Projected returns pro-forma
-3.0% appreciation · 3.0% rent growth · sell at horizon
- IRR
- -3.0%
- Equity multiple
- 0.89×
- Total profit
- $-8,230
- Equity at exit
- $38,752
- IRR
- 6.7%
- Equity multiple
- 1.51×
- Total profit
- $36,911
- Equity at exit
- $22,471
Cash invested: $72,772 (down + closing). Projections, not guarantees.
Landlord ↔ Tenant lean methodology
- Overall (STATE)
- 15 Strongly Tenant-Friendly
- State New York
- 15 Strongly Tenant-Friendly · D+10
- County
- — inherits STATE
- City
- — inherits STATE
ZIP-level market 12306
- Home prices YoY
- -23.8%
- Active inventory
- 181
- Price-to-rent
- 13.6×
Monthly cashflow live
- Estimated rent
- $3,175 high interval (Pro) →
- Mortgage (P&I)
- −$1,363
- Tax from tax record
- −$507 /mo · $6,090/yr
- Insurance
- −$108
- HOA
- −$0
- Vacancy / Maint / Mgmt
- −$667
- Net cashflow
- $530
Break-even live
2-unit breakdown (identical units grouped — click to expand)
| Units | Beds | Baths | Est. rent |
|---|---|---|---|
| 2× units | 2 | 1 | $3,174 |
| #1 | 2 | 1 | $1,587 |
| #2 | 2 | 1 | $1,587 |
| Total (2 units) | $3,175 | ||
UW: 25.0% down · 7.5% · 30yr · 1.5% tax · 5.0% vac · 8.0% maint · 8.0% mgmt
Financing live
Cash to close
- Down payment
- $64,975
- Closing costs
- $7,797
- Reserves months
- —
- Total cash needed
- —
Loan-product check · same deal, 3 products live
Conventional
25% down · 7.5% · 30yr
- Down + closing
- —
- Monthly P&I
- —
- Monthly cashflow
- —
- DSCR
- —
- Eligible?
- —
Personal DTI + credit; lowest rate.
DSCR
20% down · 8.5% · 30yr
- Down + closing
- —
- Monthly P&I
- —
- Monthly cashflow
- —
- DSCR
- —
- Eligible?
- —
No personal income docs; deal must DSCR.
Hard money
10% down · 12.0% · 12mo
- Down + closing
- —
- Monthly P&I
- —
- Monthly cashflow
- —
- DSCR
- —
- Eligible?
- —
Short-term bridge; refi at stabilization.
Rent comps 4 comps
| Address | Beds | Baths | Sqft | Rent | $/sqft | DOM | Units | Dist |
|---|---|---|---|---|---|---|---|---|
| 2030 Euclid Ave Schenectady, NY | 3.0 | 1.0 | 1300 | $2,000 | $1.54 | 19d | 1 | 0.35mi |
| 909 Vischer Ave Schenectady, NY | 3.0 | 1.5 | 1512 | $1,995 | $1.32 | 14d | 1 | 0.54mi |
| 1346 10th Ave Schenectady, NY | 4.0 | 2.0 | 2350 | $2,499 | $1.06 | 14d | 1 | 0.55mi |
| 2007 Campbell Ave Schenectady, NY | 3.0 | 1.0 | 1272 | $1,600 | $1.26 | 14d | 1 | 0.61mi |
Listing history 2 events
-
2026-05-06status Pending 956-char remark
-
2026-04-30$259,900 Active 956-char remark
ⓘ Source: listings_history table (triggers on properties + properties_extension) + one-shot
backfill from property_details.listing_events for pre-trigger history.
Tax reassessment forecast NY · Partial reset (capped growth)
- Current annual tax
- $6,090 · $507/mo
- Projected year-2 tax
- $6,090 · $507/mo
- Expected delta
- $0/yr ($0/mo · 0.0%)
ⓘ Screening estimate from a state-policy table — verify with the county assessor before closing.
Climate risk First Street
- Flood 1/10 Low FEMA zone X (unshaded) · 0% chance over 30 yrs
- Wildfire 3/10 Moderate
- Heat 4/10 Moderate 7 d/yr ≥96°F today · 16 d/yr by 30 yrs out
- Wind 3/10 Moderate 5% chance of damaging wind over 30 yrs
- Air quality 1/10 Low 0 unhealthy d/yr today · 0 by 30 yrs out
Nearby sold comps map
Loading sold comps map…
Walkable amenities ~0.75 mi
Loading nearby amenities…
Taxation est. · year 1
- Rental income
- $38,100
- − Mortgage interest
- −$14,558
- − Property taxes
- −$6,090
- − Insurance
- −$1,300
- − Repairs & maintenance
- −$3,048
- − Management
- −$3,048
- − Depreciation
- −$7,561
- Taxable income
- $2,495
- Est. tax owed @ 24.0%
- −$599
- After-tax cash flow
- $5,755/yr
For passive investors: Depreciation is non-cash, so a rental often shows a tax loss while cash-flowing — sheltering income. Rental losses are passive: they offset passive income freely, and up to $25,000/yr can offset ordinary (W-2) income if you actively participate and your MAGI is under $100k (phasing out to $0 by $150k); unused losses carry forward. On sale, claimed depreciation is recaptured at up to 25%, and gains may owe capital-gains tax (a 1031 exchange can defer both). Figures are a year-1 estimate at your 24.0% rate — not tax advice; consult a CPA.
Schools (NCES district)
- District
- Schenectady City School District
- NCES district ID
- 3626010
- Math proficiency
- 38% ▲ 12.00%
- Reading proficiency
- 34% ▲ 2.00%
- Median HH income
- $39,453
- Composite
- 30.2/100
- National rank
- #6309
- State rank
- #556 of 590 in NY
Livability — Schenectady
- Score
- 78/100
- State rank
- #167
- US rank
- #2597
Category grades
Schools grade is shown separately in the Schools card above.
Census & demographics
- Census place
- Schenectady, NY
- County
- Schenectady County · 141,369 people
- City population
- 141,369
- Metro
- Albany-Schenectady-Troy, NY
- Population (ZIP)
- 27,865
- Household income
- $83,202
- Rent vs Own
- Severe rent burden
- 629.0
Population outlook (Schenectady County) Hauer SSP2
- Today (2025)
- 155,046 people
- By 2030
- 154,322 · -0.5%
- By 2040
- 151,796 · -2.1%
- By 2050
- 148,621 · -4.1%
- By 2075
- 141,229 · -8.9%
- By 2100
- 126,014 · -18.7%
Race, ethnicity, and origin ACS 2023
- Neighborhood character
- Predominantly White (78%)
- Race & ethnicity
- White 78% Two or more races 8% Black 7% Hispanic / Latino 7% Asian 3%
- Hispanic origin (detail)
- Puerto Rican 4% Dominican 1%
- Common ancestry
- Romanian 7% Lithuanian 5% Iranian 3%
- Foreign-born
- 6% · Canada
- Languages at home
- 94% English-only · Spanish 3% Other Indo-European 1% Other Asian/Pacific 1%
Political lean MEDSL · Schenectady
- 2024 margin
- D (+10.8) · D 55.4% · R 44.6%
- 2008→2024 swing
- -1.8pp toward R · 2008: 12.7pp · 2024: 10.8pp
- All cycles
- 2024: D+10.8 2020: D+15.7 2016: D+5.8 2012: D+15.4 2008: D+12.7
Not yet ingested
- Civics
- —
Market trends
- HPI YoY
- ▼ -91.35%
- Current HPI
- 292.1229
- Rent YoY
- —
- Metro
- Albany-Schenectady-Troy, NY
- State GDP YoY
- ▲ 2.60%
- F500 in state
- 92
Industry mix (Fortune 500 HQ in NY)
| Industry | F500 HQs | Revenue |
|---|---|---|
| Financial Services | 10 | $950B |
|
||
| Consumer Goods | 9 | $162B |
|
||
| Insurance | 4 | $225B |
|
||
| Telecommunications | 2 | $144B |
|
||
| Pharmaceuticals | 2 | $112B |
|
||
| Media / Entertainment | 2 | $69B |
|
||
Price history
2 events — show timeline
- 2026-05-06 Pending — Global MLS
- 2026-04-30 Listed $259,900 Global MLS
Property tax history
+1.0%/yrLatest (2025): $6,090 · +4.3% YoY. Source: county tax records.
Cash-flow waterfall
monthlySold comps — $/sqft
last 12 mo · ≤1 miLoading sold comps…