 Multi-family
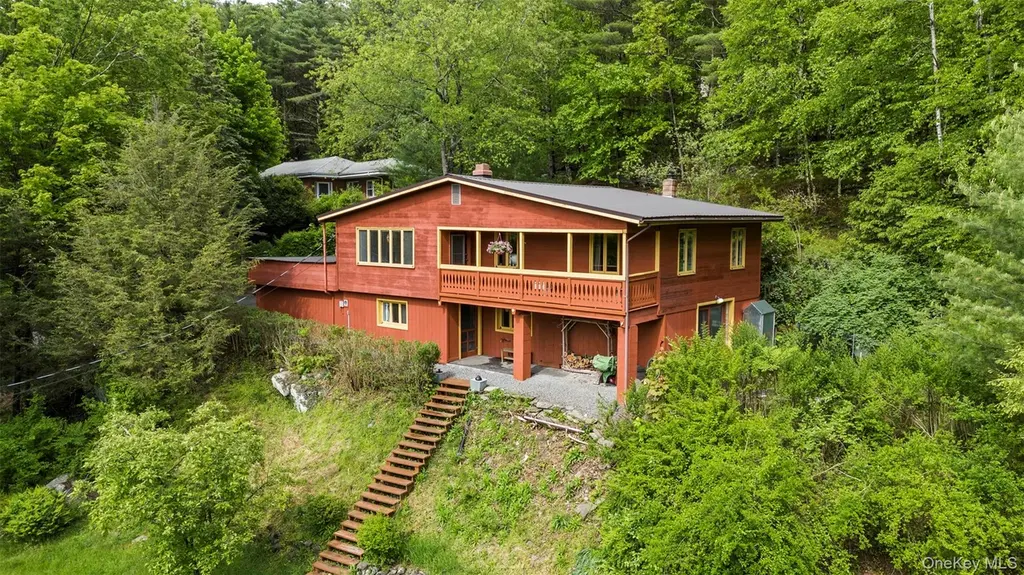
568 High Rd · Eldred, NY
Flood risk 1/10 · Minimal
- FEMA flood zone
- X (unshaded)
- Chance of flooding over 30 yrs
- 0.0%
- Est. flood insurance / yr
- $473 – $860
Fire risk 3/10 · Minor
- Est. fire insurance / yr
- $691 – $1,283
Heat risk 2/10 · Minimal
- Hot days now (above 94°F)
- 6 days/yr
- Hot days in 30 yrs
- 11 days/yr
Wind risk 3/10 · Minor
- Chance of severe wind over 30 yrs
- 5.0%
Air-quality risk 2/10 · Minimal
- Unhealthy air days now
- 1 days/yr
- Unhealthy air days in 30 yrs
- 1 days/yr
Risk factors via First Street. Map © Google.
Why this score? — see what drove the D grade
The composite is a weighted blend of 9 inputs, each scored 0–100. Each bar is that input's sub-score; the figure is the points it added to the 100-point composite (weight × sub-score).
- ARV discount +15.0/15.0
- Appreciation +10.0/10.0
- Cash flow +5.0/30.0
- Schools +3.6/10.0
- Rent growth +2.5/5.0
- Livability +2.5/5.0
- Condition / age +2.5/5.0
- 1% rule +0.0/10.0
- DSCR +0.0/10.0
$399,000
🖨 Deal sheet 📄 Offer letter ✓ Due diligence
Multi-family units
County records classify this as Multi-Family (2-4 Unit). Listing-text estimate: 1 unit. estimate disagrees with records
Listing remarks
This beautiful country home invites you to slow down, breathe deeply, and reconnect with the quiet magic of nature. Modern upgrades, major vibes, and endless charm await in the serene and storied hamlet of Glen Spey, NY. This beautifully maintained 2,600 sq ft home offers the perfect blend of rustic warmth and modern comfort. Set on a peaceful 2-acre parcel backed by solid bluestone bedrock, this two-story, five-bedroom, two full-bath residence is just 2 hours from NYC and only 15 minutes to Metro-North--making weekend escapes or full-time living equally effortless. Located within a well-regarded school district known for its strong community feel and excellent educational opportunities, th
Key facts
- 2.01 acre lot
- Garage
- Built 1968
Property features AI
Exterior
- Parking: Attached garage; One garage space; No carport
- Utilities: Electric service by Orange & Rockland; Septic tank; Private trash collection
- Home design: Single family residence
- Construction: Frame construction
- Exterior features: Frame construction; Not waterfront
Interior
- Kitchen: Oven; Range; Refrigerator
- Bedrooms: Bedroom on the first floor
- Bathrooms: Two full bathrooms
- Heating & cooling: Hot water heating; Steam heating; No central air
- Interior features: First-floor bedroom; First-floor full bathroom; Open kitchen layout; Full basement; 8 total rooms; One fireplace
- Laundry & utility: Washer
Neighborhood map
What this means for you Summary
Snapshot
- This is a 5-bed/2.0-bath multifamily listed at $399k.
Deal economics
- At list price, monthly cash flow is $-935 ($-11k/yr) — negative.
- To cash-flow at today's rent, offer at most $234k (41.4% below list).
- To meet the 1% rule (rent ≥ 1% of price), the offer needs to be $200k (49.8% below list).
- Recommended offer: $200k (49.8% below list) — sets the bar for 1% rule.
- Cap rate 3.5% vs local median 2.2% in Eldred — top-decile yield for the area; either an underpriced asset or a hidden risk that comps aren't pricing in. Stress-test before assuming the spread holds.
Location & tenants
- Location reads: area grade D — affects rentability + tenant quality, not the cash-flow math above.
- Eldred Central School District (rural): math 33% / reading 50% proficiency, ranked #495 of 590 in NY (top 84%) — families likely to look elsewhere, expect single-tenant / working-renter base with shorter leases.
- Zoned schools: George Ross Mackenzie Elementary School (math 22% / reading 47%, grade F, #1,577 of 2,108 statewide, top 77%, 242 students, 38% FRL); Eldred Junior-Senior High School (math 47% / reading 57%, grade D+, #946 of 1,100 statewide, top 88%, 230 students, 46% FRL).
- Market conditions: 66 active listings in the ZIP; 739 units permitted in Sullivan County in 2024 (5 in 5+ unit buildings).
Forward outlook
- In year one you build about $43k of equity ($3k loan paydown + $40k appreciation (10.0% local appreciation)).
- Sullivan County population projected at -24% by 2050 — secular population decline; favor cash flow + early exit over multi-decade hold.
- By year 2, paydown + projected appreciation supports a ~$69k cash-out refi (75% LTV) — recoverable capital for the next deal without selling this one.
Negotiation context
- It's been on market 45 days — a 3% lower offer ($387k) is reasonable based on typical stale-listing flexibility.
- 2 sale attempts with the ask held roughly flat each time — persistent listings suggest the price (not the market) is what's stuck; bring a comps-based counter.
Questions for the listing agent
- What do current leases actually rent for vs. the listed asking? Can we see a recent rent roll and the last 12 months of T-12 income?
- It's been on market 45 days. Have you received any prior offers? Is the seller open to a 50% concession, seller financing, or rate buy-down credit?
- Built in 1968 — when were the roof, HVAC, electrical panel, plumbing, and water heater last replaced?
- Is there a deadline driving the sale (1031 exchange, divorce, estate, relocation)? That informs how much negotiation room exists.
- The area grade is low — what's the realistic commute time and amenity access for the typical tenant pool here? Any planned neighborhood developments (good or bad) we should know about?
- What's the average days-on-market for RENTAL listings here right now (not sales)? A rising rental-DOM trend means longer vacancies and softer asking-rent achievability than the comps imply.
- What's the recent tenant-quality profile in this submarket — average credit score on applications, eviction rate, late-payment / NSF rate, and stable-employment percentage? A property-management company in the area should have these aggregated.
- How much new apartment / multifamily construction is in the pipeline within 1–3 miles? Heavy new supply (>2% of stock underway) typically softens rents 12–24 months out; light construction supports rent growth.
Investment metrics
- 1% rule
- 0.50% ✗
- Cap rate
- 3.48%
- Cash-on-cash
- -10.05%
- DSCR
- 0.55
- GRM
- 16.6
CMA / ARV
- ARV (median comp)
- $562,075
- List price
- $399,000
- Delta
- -29.01%
- Verdict
- UNDERPRICED
- Comps
- 2 within 1.0 mi
Projected returns pro-forma
10.0% appreciation · 3.0% rent growth · sell at horizon
- IRR
- 17.2%
- Equity multiple
- 2.41×
- Total profit
- $157,615
- Equity at exit
- $359,451
- IRR
- 16.3%
- Equity multiple
- 5.57×
- Total profit
- $510,768
- Equity at exit
- $775,169
Cash invested: $111,720 (down + closing). Projections, not guarantees.
Landlord ↔ Tenant lean methodology
- Overall (STATE)
- 15 Strongly Tenant-Friendly
- State New York
- 15 Strongly Tenant-Friendly · D+10
- County
- — inherits STATE
- City
- — inherits STATE
ZIP-level market 12737
- Active inventory
- 66
- Price-to-rent
- 16.6×
Monthly cashflow live
- Estimated rent
- $2,005 medium interval (Pro) →
- Mortgage (P&I)
- −$2,092
- Tax from tax record
- −$260 /mo · $3,124/yr
- Insurance
- −$166
- HOA
- −$0
- Vacancy / Maint / Mgmt
- −$421
- Net cashflow
- $-935
Break-even live
UW: 25.0% down · 7.5% · 30yr · 1.5% tax · 5.0% vac · 8.0% maint · 8.0% mgmt
Financing live
Cash to close
- Down payment
- $99,750
- Closing costs
- $11,970
- Reserves months
- —
- Total cash needed
- —
Loan-product check · same deal, 3 products live
Conventional
25% down · 7.5% · 30yr
- Down + closing
- —
- Monthly P&I
- —
- Monthly cashflow
- —
- DSCR
- —
- Eligible?
- —
Personal DTI + credit; lowest rate.
DSCR
20% down · 8.5% · 30yr
- Down + closing
- —
- Monthly P&I
- —
- Monthly cashflow
- —
- DSCR
- —
- Eligible?
- —
No personal income docs; deal must DSCR.
Hard money
10% down · 12.0% · 12mo
- Down + closing
- —
- Monthly P&I
- —
- Monthly cashflow
- —
- DSCR
- —
- Eligible?
- —
Short-term bridge; refi at stabilization.
Listing history 16 events
-
2026-06-18days on market $399,000 Active 45 DOM
-
2026-06-17days on market $399,000 Active 44 DOM
-
2026-06-16days on market $399,000 Active 43 DOM
-
2026-06-15days on market $399,000 Active 42 DOM
-
2026-06-13days on market $399,000 Active 40 DOM
-
2026-06-12days on market $399,000 Active 39 DOM
-
2026-06-09days on market $399,000 Active 36 DOM
-
2026-06-08days on market $399,000 Active 35 DOM
-
2026-06-07days on market $399,000 Active 34 DOM
-
2026-06-07days on market $399,000 Active 33 DOM
-
2026-06-04days on market $399,000 Active 30 DOM
-
2026-06-02days on market $399,000 Active 29 DOM
-
2026-06-01days on market $399,000 Active 28 DOM
-
2026-05-31days on market $399,000 Active 27 DOM
-
2026-05-04$399,000 Active 2059-char remark
-
2025-06-06$399,000 Active
ⓘ Source: listings_history table (triggers on properties + properties_extension) + one-shot
backfill from property_details.listing_events for pre-trigger history.
Tax reassessment forecast NY · Partial reset (capped growth)
- Current annual tax
- $3,124 · $260/mo
- Projected year-2 tax
- $4,933 · $411/mo
- Expected delta
- +$1,810/yr (+$151/mo · 57.9%)
ⓘ Screening estimate from a state-policy table — verify with the county assessor before closing.
Climate risk First Street
- Flood 1/10 Low FEMA zone X (unshaded) · 0% chance over 30 yrs
- Wildfire 3/10 Moderate
- Heat 2/10 Low 6 d/yr ≥94°F today · 11 d/yr by 30 yrs out
- Wind 3/10 Moderate 5% chance of damaging wind over 30 yrs
- Air quality 2/10 Low 1 unhealthy d/yr today · 1 by 30 yrs out
Nearby sold comps map
Loading sold comps map…
Walkable amenities ~0.75 mi
Loading nearby amenities…
Taxation est. · year 1
- Rental income
- $24,054
- − Mortgage interest
- −$22,350
- − Property taxes
- −$3,124
- − Insurance
- −$1,995
- − Repairs & maintenance
- −$1,924
- − Management
- −$1,924
- − Depreciation
- −$11,607
- Taxable loss
- −$18,871
- Est. tax savings @ 24.0%
- +$4,529
- After-tax cash flow
- $-6,696/yr
For passive investors: Depreciation is non-cash, so a rental often shows a tax loss while cash-flowing — sheltering income. Rental losses are passive: they offset passive income freely, and up to $25,000/yr can offset ordinary (W-2) income if you actively participate and your MAGI is under $100k (phasing out to $0 by $150k); unused losses carry forward. On sale, claimed depreciation is recaptured at up to 25%, and gains may owe capital-gains tax (a 1031 exchange can defer both). Figures are a year-1 estimate at your 24.0% rate — not tax advice; consult a CPA.
Schools (NCES district)
- District
- Eldred Central School District
- NCES district ID
- 3610410
- Math proficiency
- 33% ▼ -15.00%
- Reading proficiency
- 50% ▲ 11.00%
- Median HH income
- $52,775
- Composite
- 35.94/100
- National rank
- #4800
- State rank
- #495 of 590 in NY
Livability — Eldred
No livability data for this city. (Only ~50 U.S. cities are tracked.)
Census & demographics
- Population (ZIP)
- 1,817
Population outlook (Sullivan County) Hauer SSP2
- Today (2025)
- 68,974 people
- By 2030
- 65,609 · -4.9%
- By 2040
- 58,878 · -14.6%
- By 2050
- 52,500 · -23.9%
- By 2075
- 39,941 · -42.1%
- By 2100
- 28,880 · -58.1%
Race, ethnicity, and origin ACS 2023
- Neighborhood character
- Predominantly White (82%)
- Race & ethnicity
- White 82% Hispanic / Latino 13% Two or more races 12%
- Hispanic origin (detail)
- Puerto Rican 9% Cuban 1%
- Common ancestry
- Romanian 7% Slovak 5% Lithuanian 4%
- Foreign-born
- 5% · South Korea
- Languages at home
- 92% English-only · Russian/Polish/Slavic 3% Other Indo-European 3% Spanish 2%
Political lean MEDSL · Sullivan
- 2024 margin
- R (+16.7) · D 41.6% · R 58.4%
- 2008→2024 swing
- -26.2pp toward R · 2008: 9.5pp · 2024: -16.7pp
- All cycles
- 2024: R+16.7 2020: R+9.2 2016: R+13.7 2012: D+10.4 2008: D+9.5
Not yet ingested
- Civics
- —
Market trends
- HPI YoY
- ▲ 132.02%
- Current HPI
- 443.8248
- Rent YoY
- —
- Metro
- —
- State GDP YoY
- ▲ 2.60%
- F500 in state
- 92
Industry mix (Fortune 500 HQ in NY)
| Industry | F500 HQs | Revenue |
|---|---|---|
| Financial Services | 10 | $950B |
|
||
| Consumer Goods | 9 | $162B |
|
||
| Insurance | 4 | $225B |
|
||
| Telecommunications | 2 | $144B |
|
||
| Pharmaceuticals | 2 | $112B |
|
||
| Media / Entertainment | 2 | $69B |
|
||
Price history
+0.0% since first listed2 events — show timeline
- 2026-05-04 Listed $399,000 OneKey® MLS as Distributed by MLS Grid
- 2025-06-06 Listed $399,000 OneKey® MLS as Distributed by MLS Grid
Property tax history
+0.6%/yrLatest (2025): $3,124 · +1.6% YoY. Source: county tax records.
Cash-flow waterfall
monthlySold comps — $/sqft
last 12 mo · ≤1 miLoading sold comps…