 Duplex
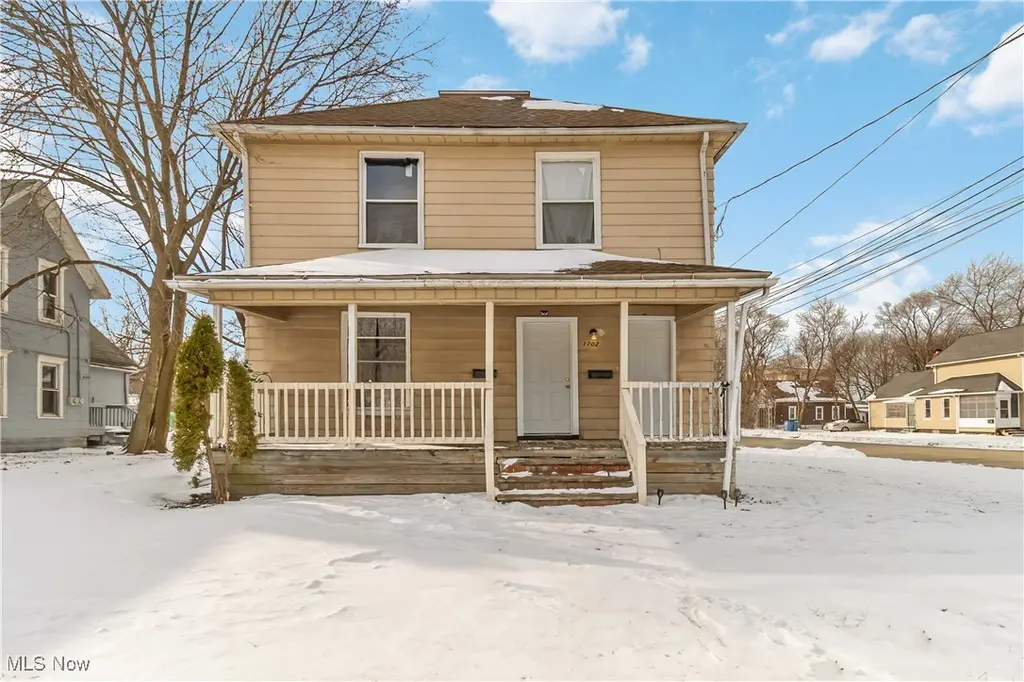
1702 Lexington Ave · Lorain, OH
Flood risk 5/10 · Moderate
- FEMA flood zone
- X (unshaded)
- Chance of flooding over 30 yrs
- 0.49%
- Est. flood insurance / yr
- $473 – $860
Fire risk 1/10 · Minimal
- Est. fire insurance / yr
- $713 – $1,323
Heat risk 3/10 · Minor
- Hot days now (above 97°F)
- 7 days/yr
- Hot days in 30 yrs
- 17 days/yr
Wind risk 1/10 · Minimal
- Chance of severe wind over 30 yrs
- —
Air-quality risk 2/10 · Minimal
- Unhealthy air days now
- 2 days/yr
- Unhealthy air days in 30 yrs
- 2 days/yr
Risk factors via First Street. Map © Google.
Why this score? — see what drove the B grade
The composite is a weighted blend of 9 inputs, each scored 0–100. Each bar is that input's sub-score; the figure is the points it added to the 100-point composite (weight × sub-score).
- Cash flow +30.0/30.0
- ARV discount +10.4/15.0
- 1% rule +10.0/10.0
- DSCR +10.0/10.0
- Rent growth +3.5/5.0
- Livability +3.4/5.0
- Condition / age +2.5/5.0
- Schools +1.6/10.0
- Appreciation +0.0/10.0
$115,000
🖨 Deal sheet 📄 Offer letter ✓ Due diligence
Multi-family units
County records classify this as Multi-Family (2-4 Unit). Listing-text estimate: 2 units. confirmed
Listing remarks MLS
Welcome to 1702 Lexington Ave in Lorain, Ohio—a fully occupied duplex that delivers immediate income from day one. Both units are leased at $850 per month, creating strong, predictable cash flow with built-in upside. The upper unit is locked in through August 2026, providing long-term stability, while the lower unit is month-to-month, giving you flexibility to adjust rents or reposition the asset. This is the kind of property investors want: stable, performing, and easy to step into. Whether you’re scaling a portfolio or securing a solid standalone investment, this duplex checks the boxes—tenants in place, income on the books, and zero downtime. Opportunities like this don’t wait. Neither should you.
Key facts
- 3,920 sq ft lot
- Built 1900
- Listed 146 days
Neighborhood map
What this means for you Summary
Snapshot
- This is a 2 × 2-bed/1.0-bath units multifamily listed at $115k.
Deal economics
- At list price, monthly cash flow is $926 ($11k/yr) — positive. Per door: $463/mo.
- The deal already cash-flows at list — no discount required.
- Meets the 1% rule at list price ($2k rent vs $115k).
- Recommended offer: $101k (12.0% below list) — sets the bar for market timing.
- Cap rate 16.0% vs local median 5.9% in Lorain — top-decile yield for the area; either an underpriced asset or a hidden risk that comps aren't pricing in. Stress-test before assuming the spread holds.
Location & tenants
- Location reads 67/100 on livability (#595 in OH) — a middle-class / working-renter tenant base. Strengths: cost of living A+, housing A+; Watch: schools C-, amenities D, health & safety D.
- Lorain City (suburban): math 13% / reading 26% proficiency, ranked #633 of 656 in OH (top 96%) — low school quality limits family demand, transient renter base, plan for 1-2y turnover; 80% free/reduced lunch — lower-income household profile, screen leases tightly.
- Market conditions: Rents rising fast (+4.1%/yr); 129 active listings in the ZIP; 28 comparable units currently listed for rent nearby; rentals at typical pace (median 24d on market — plan ~3-4 weeks tenant-placement turnaround); 46% of comp listings sitting > 30 days — soft ceiling on asking rent; 1,098 units permitted in Lorain County in 2024 (20 in 5+ unit buildings).
- At $2,103/mo this rent would consume 56% of the median local household income ($45k/yr) (locally 1423% of renters already pay >50% of income on rent) — very limited rent-growth headroom before tenants either downsize or default.
Forward outlook
- Local home prices are declining (-3.0%/yr); year-one equity from $795 of loan paydown is wiped out by about $3k of value loss. Plan a longer hold.
- At projected returns (-3.0% appreciation + 4.1% rent growth), your $32k cash investment doubles in ~4 years — after that, you're playing with house money.
Negotiation context
- It's been on market 147 days — a 12% lower offer ($101k) is reasonable based on typical stale-listing flexibility.
- 9 sale attempts since 35y ago; this cycle's ask has dropped $15k (12%) from the opening price — seller is motivated, your offer sets the floor, not the list.
- Current owner paid $65k; list at $115k implies a 77% gain — meaningful room to come down on a strong offer.
Risks & watch-outs
- Watch-outs: built in 1900 — expect roof / HVAC / electrical / plumbing capex.
- Climate carrying-cost: moderate flood risk — expect insurance premiums to compound above CPI over the hold.
Questions for the listing agent
- It's been on market 147 days. Have you received any prior offers? Is the seller open to a 12% concession, seller financing, or rate buy-down credit?
- Can we see the unit-by-unit rent roll, current vacancy, and any below-market leases? What's the average tenancy length?
- What capital expenditures (roof, boiler, parking lot, exteriors) have been made in the last 5 years, and what's planned in the next 2?
- Built in 1900 — when were the roof, HVAC, electrical panel, plumbing, and water heater last replaced?
- Why hasn't it sold? Are there any deal-killer items the seller is aware of (foundation, flood, title, zoning, code violations)?
- Is there a deadline driving the sale (1031 exchange, divorce, estate, relocation)? That informs how much negotiation room exists.
- Crime grade is F in this area — have there been break-ins, vandalism, or insurance claims at this property in the last 3 years? What carrier currently insures it and at what premium?
- What's the average days-on-market for RENTAL listings here right now (not sales)? A rising rental-DOM trend means longer vacancies and softer asking-rent achievability than the comps imply.
- What's the recent tenant-quality profile in this submarket — average credit score on applications, eviction rate, late-payment / NSF rate, and stable-employment percentage? A property-management company in the area should have these aggregated.
- How much new apartment / multifamily construction is in the pipeline within 1–3 miles? Heavy new supply (>2% of stock underway) typically softens rents 12–24 months out; light construction supports rent growth.
Investment metrics
- 1% rule
- 1.83% ✓
- Cap rate
- 15.95%
- Cash-on-cash
- 34.50%
- DSCR
- 2.54
- GRM
- 4.6
CMA / ARV
- ARV (median comp)
- $122,982
- List price
- $115,000
- Delta
- -6.49%
- Verdict
- FAIR
- Comps
- 15 within 1.0 mi
Show comp detail 1 sale within ~0.75 mi
| Address | Dist | Beds/Ba | Sqft | Sold | Price | $/sf | Match |
|---|---|---|---|---|---|---|---|
| 418 W 17th St | 0.06mi | 3/2.0 (-1) | 1,290 (-10%) | 7mo | $144,000 | $112 | 69 |
Match score weights: distance 35% · size 25% · config 20% · recency 20%. Top-matched comps best support the ARV.
Projected returns pro-forma
-3.0% appreciation · 4.09% rent growth · sell at horizon
- IRR
- 31.1%
- Equity multiple
- 2.32×
- Total profit
- $42,656
- Equity at exit
- $17,147
- IRR
- 38.9%
- Equity multiple
- 4.81×
- Total profit
- $122,833
- Equity at exit
- $9,943
Cash invested: $32,200 (down + closing). Projections, not guarantees.
Landlord ↔ Tenant lean methodology
- Overall (STATE)
- 73 Landlord-Friendly
- State Ohio
- 73 Landlord-Friendly · R+6
- County
- — inherits STATE
- City
- — inherits STATE
ZIP-level market 44052
- Home prices YoY
- -28.1%
- Rents YoY
- 4.1%
- Active inventory
- 129
- Price-to-rent
- 9.1×
Monthly cashflow live
- Estimated rent
- $2,103 high interval (Pro) →
- Mortgage (P&I)
- −$603
- Tax from tax record
- −$85 /mo · $1,015/yr
- Insurance
- −$48
- HOA
- −$0
- Vacancy / Maint / Mgmt
- −$442
- Net cashflow
- $926
Break-even live
2-unit breakdown (identical units grouped — click to expand)
| Units | Beds | Baths | Est. rent |
|---|---|---|---|
| 2× units | 2 | 1 | $2,104 |
| #1 | 2 | 1 | $1,052 |
| #2 | 2 | 1 | $1,052 |
| Total (2 units) | $2,103 | ||
UW: 25.0% down · 7.5% · 30yr · 1.5% tax · 5.0% vac · 8.0% maint · 8.0% mgmt
Financing live
Cash to close
- Down payment
- $28,750
- Closing costs
- $3,450
- Reserves months
- —
- Total cash needed
- —
Loan-product check · same deal, 3 products live
Conventional
25% down · 7.5% · 30yr
- Down + closing
- —
- Monthly P&I
- —
- Monthly cashflow
- —
- DSCR
- —
- Eligible?
- —
Personal DTI + credit; lowest rate.
DSCR
20% down · 8.5% · 30yr
- Down + closing
- —
- Monthly P&I
- —
- Monthly cashflow
- —
- DSCR
- —
- Eligible?
- —
No personal income docs; deal must DSCR.
Hard money
10% down · 12.0% · 12mo
- Down + closing
- —
- Monthly P&I
- —
- Monthly cashflow
- —
- DSCR
- —
- Eligible?
- —
Short-term bridge; refi at stabilization.
Rent comps 28 comps
| Address | Beds | Baths | Sqft | Rent | $/sqft | DOM | Units | Dist |
|---|---|---|---|---|---|---|---|---|
| 1724 Lexington Ave Lorain, OH | 3.0 | 1.0 | 1150 | $1,215 | $1.06 | 23d | 1 | 0.01mi |
| 1703 Oakdale Ave Lorain, OH | 3.0 | 1.0 | 1237 | $1,300 | $1.05 | 2d | 1 | 0.12mi |
| 521 W 14th St Lorain, OH | 3.0 | 1.0 | 968 | $950 | $0.98 | 43d | 1 | 0.15mi |
| 420 W 12th St Lorain, OH | 3.0 | 1.0 | 1204 | $1,650 | $1.37 | 4d | 1 | 0.32mi |
| 704 W 21st St Lorain, OH | 4.0 | 1.0 | 1410 | $1,450 | $1.03 | 23d | 1 | 0.32mi |
| 128 W 22nd St Lorain, OH | 3.0 | 1.0 | 1402 | $1,470 | $1.05 | 43d | 1 | 0.36mi |
| 930 W 18th St Lorain, OH | 4.0 | 1.0 | 1344 | $1,450 | $1.08 | 43d | 1 | 0.39mi |
| 1053 Washington Ave Unit 4 Lorain, OH | 3.0 | 1.0 | 1000 | $899 | $0.90 | 43d | 1 | 0.48mi |
| 1037 Washington Ave Lorain, OH | 4.0 | 2.0 | 1567 | $1,600 | $1.02 | 17d | 1 | 0.50mi |
| 939 W 22nd St Lorain, OH | 3.0 | 1.0 | 950 | $1,295 | $1.36 | 43d | 1 | 0.55mi |
| 1055 W 12th St Lorain, OH | 4.0 | 1.0 | 1206 | $1,750 | $1.45 | 23d | 1 | 0.59mi |
| 2307 Washington Ave Lorain, OH | 1.0–3.0 | 1.0 | 880 | $1,499 | $1.70 | 1d | 1 | 0.63mi |
| 944 S Central Dr Lorain, OH | 3.0 | 1.0 | 950 | $1,250 | $1.32 | 23d | 1 | 0.68mi |
| 2715 Apple Ave Lorain, OH | 3.0 | 1.0 | 1240 | $1,311 | $1.06 | 43d | 1 | 0.75mi |
| 336 W 29th St Lorain, OH | 3.0 | 1.0 | 1440 | $1,350 | $0.94 | 43d | 1 | 0.76mi |
| 1220 W 19th St Lorain, OH | 4.0 | 1.0 | 1492 | $1,550 | $1.04 | 23d | 1 | 0.80mi |
| 1322 Brownell Ave Lorain, OH | 4.0 | 1.0 | 1571 | $1,570 | $1.00 | 43d | 1 | 0.87mi |
| 1028 W 5th St Lorain, OH | 3.0 | 2.0 | 1250 | $1,650 | $1.32 | 43d | 1 | 0.90mi |
| 2909 Denver Ave Lorain, OH | 3.0 | 1.0 | 1597 | $1,400 | $0.88 | 43d | 1 | 0.95mi |
| 200 E 31st St Lorain, OH | 5.0 | 2.0 | 1562 | $1,550 | $0.99 | 1d | 1 | 0.97mi |
| 3132 Elyria Ave Lorain, OH | 3.0 | 1.5 | 1109 | $1,250 | $1.13 | 43d | 1 | 1.01mi |
| 1413 W 12th St Lorain, OH | 4.0 | 1.5 | 1725 | $1,700 | $0.99 | 43d | 1 | 1.03mi |
| 1223 W 5th St Lorain, OH | 3.0 | 2.0 | 1152 | $1,150 | $1.00 | 12d | 1 | 1.03mi |
| 1239 W 5th St Unit 1 Lorain, OH | 3.0 | 1.0 | 1200 | $1,100 | $0.92 | 23d | 1 | 1.06mi |
| 612 E 33rd St Lorain, OH | 3.0 | 1.0 | 960 | $995 | $1.04 | 43d | 1 | 1.20mi |
| 1712 W 12th St Lorain, OH | 3.0 | 1.0 | 996 | $1,295 | $1.30 | 23d | 1 | 1.20mi |
| 1510 Fillmore Ave Lorain, OH | 3.0 | 1.0 | 896 | $900 | $1.00 | 7d | 1 | 1.33mi |
| 1508 Fillmore Ave Unit 1510 Fillmore Ave: Left Unit Lorain, OH | 3.0 | 1.0 | 896 | $900 | $1.00 | 7d | 1 | 1.34mi |
Listing history 35 events
-
2026-06-18days on market $115,000 Active 147 DOM
-
2026-06-17days on market $115,000 Active 146 DOM
-
2026-06-16days on market $115,000 Active 145 DOM
-
2026-06-15days on market $115,000 Active 144 DOM
-
2026-06-13days on market $115,000 Active 142 DOM
-
2026-06-13days on market $115,000 Active 141 DOM
-
2026-06-09days on market $115,000 Active 138 DOM
-
2026-06-08days on market $115,000 Active 137 DOM
-
2026-06-07days on market $115,000 Active 136 DOM
-
2026-06-03days on market $115,000 Active 132 DOM
-
2026-06-02days on market $115,000 Active 131 DOM
-
2026-06-01days on market $115,000 Active 130 DOM
-
2026-05-31days on market $115,000 Active 129 DOM
-
2026-04-23price $125,000 733-char remark
Show marketing remark (733 chars)
Welcome to 1702 Lexington Ave in Lorain, Ohio—a fully occupied duplex that delivers immediate income from day one. Both units are leased at $850 per month, creating strong, predictable cash flow with built-in upside. The upper unit is locked in through August 2026, providing long-term stability, while the lower unit is month-to-month, giving you flexibility to adjust rents or reposition the asset. This is the kind of property investors want: stable, performing, and easy to step into. Whether you’re scaling a portfolio or securing a solid standalone investment, this duplex checks the boxes—tenants in place, income on the books, and zero downtime. Opportunities like this don’t wait. Neither should you.
-
2026-03-12status Active 733-char remark
Show marketing remark (733 chars)
Welcome to 1702 Lexington Ave in Lorain, Ohio—a fully occupied duplex that delivers immediate income from day one. Both units are leased at $850 per month, creating strong, predictable cash flow with built-in upside. The upper unit is locked in through August 2026, providing long-term stability, while the lower unit is month-to-month, giving you flexibility to adjust rents or reposition the asset. This is the kind of property investors want: stable, performing, and easy to step into. Whether you’re scaling a portfolio or securing a solid standalone investment, this duplex checks the boxes—tenants in place, income on the books, and zero downtime. Opportunities like this don’t wait. Neither should you.
-
2026-03-01historical Contingent 733-char remark
Show marketing remark (733 chars)
Welcome to 1702 Lexington Ave in Lorain, Ohio—a fully occupied duplex that delivers immediate income from day one. Both units are leased at $850 per month, creating strong, predictable cash flow with built-in upside. The upper unit is locked in through August 2026, providing long-term stability, while the lower unit is month-to-month, giving you flexibility to adjust rents or reposition the asset. This is the kind of property investors want: stable, performing, and easy to step into. Whether you’re scaling a portfolio or securing a solid standalone investment, this duplex checks the boxes—tenants in place, income on the books, and zero downtime. Opportunities like this don’t wait. Neither should you.
-
2026-02-20status Active 733-char remark
Show marketing remark (733 chars)
Welcome to 1702 Lexington Ave in Lorain, Ohio—a fully occupied duplex that delivers immediate income from day one. Both units are leased at $850 per month, creating strong, predictable cash flow with built-in upside. The upper unit is locked in through August 2026, providing long-term stability, while the lower unit is month-to-month, giving you flexibility to adjust rents or reposition the asset. This is the kind of property investors want: stable, performing, and easy to step into. Whether you’re scaling a portfolio or securing a solid standalone investment, this duplex checks the boxes—tenants in place, income on the books, and zero downtime. Opportunities like this don’t wait. Neither should you.
-
2026-01-29historical Contingent 733-char remark
Show marketing remark (733 chars)
Welcome to 1702 Lexington Ave in Lorain, Ohio—a fully occupied duplex that delivers immediate income from day one. Both units are leased at $850 per month, creating strong, predictable cash flow with built-in upside. The upper unit is locked in through August 2026, providing long-term stability, while the lower unit is month-to-month, giving you flexibility to adjust rents or reposition the asset. This is the kind of property investors want: stable, performing, and easy to step into. Whether you’re scaling a portfolio or securing a solid standalone investment, this duplex checks the boxes—tenants in place, income on the books, and zero downtime. Opportunities like this don’t wait. Neither should you.
-
2026-01-22$130,000 Active 733-char remark
Show marketing remark (733 chars)
Welcome to 1702 Lexington Ave in Lorain, Ohio—a fully occupied duplex that delivers immediate income from day one. Both units are leased at $850 per month, creating strong, predictable cash flow with built-in upside. The upper unit is locked in through August 2026, providing long-term stability, while the lower unit is month-to-month, giving you flexibility to adjust rents or reposition the asset. This is the kind of property investors want: stable, performing, and easy to step into. Whether you’re scaling a portfolio or securing a solid standalone investment, this duplex checks the boxes—tenants in place, income on the books, and zero downtime. Opportunities like this don’t wait. Neither should you.
-
2008-06-15historical
-
2007-12-31historical
-
2007-12-05$65,000
-
2007-06-11$65,000
-
2005-12-07soldstatus $65,000
-
2005-12-07soldstatus $65,000
-
2005-06-16$69,900
-
2005-04-12historical
-
2004-10-12$69,900
-
2002-04-15soldstatus $34,000
-
2002-02-13historical
-
2001-12-10$36,500
-
1999-04-01soldstatus $50,000
-
1991-09-23historical
-
1991-03-23$35,000
-
1987-10-15soldstatus $18,000
ⓘ Source: listings_history table (triggers on properties + properties_extension) + one-shot
backfill from property_details.listing_events for pre-trigger history.
Tax reassessment forecast OH · Partial reset (capped growth)
- Current annual tax
- $1,015 · $85/mo
- Projected year-2 tax
- $1,405 · $117/mo
- Expected delta
- +$389/yr (+$32/mo · 38.4%)
ⓘ Screening estimate from a state-policy table — verify with the county assessor before closing.
Climate risk First Street
- Flood 5/10 Major FEMA zone X (unshaded) · 49% chance over 30 yrs
- Wildfire 1/10 Low
- Heat 3/10 Moderate 7 d/yr ≥97°F today · 17 d/yr by 30 yrs out
- Wind 1/10 Low
- Air quality 2/10 Low 2 unhealthy d/yr today · 2 by 30 yrs out
Nearby sold comps map
Loading sold comps map…
Walkable amenities ~0.75 mi
Loading nearby amenities…
Taxation est. · year 1
- Rental income
- $25,236
- − Mortgage interest
- −$6,442
- − Property taxes
- −$1,015
- − Insurance
- −$575
- − Repairs & maintenance
- −$2,019
- − Management
- −$2,019
- − Depreciation
- −$3,345
- Taxable income
- $9,821
- Est. tax owed @ 24.0%
- −$2,357
- After-tax cash flow
- $8,753/yr
For passive investors: Depreciation is non-cash, so a rental often shows a tax loss while cash-flowing — sheltering income. Rental losses are passive: they offset passive income freely, and up to $25,000/yr can offset ordinary (W-2) income if you actively participate and your MAGI is under $100k (phasing out to $0 by $150k); unused losses carry forward. On sale, claimed depreciation is recaptured at up to 25%, and gains may owe capital-gains tax (a 1031 exchange can defer both). Figures are a year-1 estimate at your 24.0% rate — not tax advice; consult a CPA.
Schools (NCES district)
- District
- Lorain City
- NCES district ID
- 3904426
- Math proficiency
- 13% ▼ -24.00%
- Reading proficiency
- 26% ▼ -10.00%
- Median HH income
- $32,823
- Composite
- 15.81/100
- National rank
- #9266
- State rank
- #633 of 656 in OH
Livability — Lorain
- Score
- 67/100
- State rank
- #595
- US rank
- #10183
Category grades
Schools grade is shown separately in the Schools card above.
Census & demographics
- Census place
- Lorain, OH
- County
- Lorain County · 219,437 people
- City population
- 69,409
- Metro
- Cleveland-Elyria, OH
- Population (ZIP)
- 28,282
- Household income
- $45,023
- Rent vs Own
- Severe rent burden
- 1423.0
Population outlook (Lorain County) Hauer SSP2
- Today (2025)
- 314,924 people
- By 2030
- 317,546 · +0.8%
- By 2040
- 317,962 · +1.0%
- By 2050
- 312,872 · -0.7%
- By 2075
- 301,806 · -4.2%
- By 2100
- 278,271 · -11.6%
Race, ethnicity, and origin ACS 2023
- Neighborhood character
- Diverse neighborhood (Simpson 0.66)
- Race & ethnicity
- White 49% Hispanic / Latino 24% Black 21% Two or more races 16%
- Hispanic origin (detail)
- Mexican 5% Puerto Rican 17%
- Common ancestry
- Romanian 6% Lithuanian 1% Iranian 1%
- Foreign-born
- 3% · Canada, Vietnam
- Languages at home
- 84% English-only · Spanish 14%
Political lean MEDSL · Lorain
- 2024 margin
- Lean R (+5.7) · D 46.7% · R 52.4%
- 2008→2024 swing
- -23.6pp toward R · 2008: 17.9pp · 2024: -5.7pp
- All cycles
- 2024: R+5.7 2020: R+2.5 2016: R+0.3 2012: D+14.4 2008: D+17.9
Not yet ingested
- Civics
- —
Market trends
- HPI YoY
- ▼ -73.23%
- Current HPI
- 186.9657
- Rent YoY
- ▲ 4.09%
- Metro
- Cleveland-Elyria, OH
- State GDP YoY
- ▲ 1.98%
- F500 in state
- 48
Industry mix (Fortune 500 HQ in OH)
| Industry | F500 HQs | Revenue |
|---|---|---|
| Insurance | 3 | $145B |
|
||
| Industrial Machinery | 3 | $49B |
|
||
| Financial Services | 3 | $24B |
|
||
| Consumer Goods | 2 | $93B |
|
||
| Aerospace / Defense | 2 | $47B |
|
||
| Utilities | 2 | $33B |
|
||
Price history
+594.4% since first listed22 events — show timeline
- 2026-04-23 Price Changed $125,000 MLSNOW
- 2026-03-12 Relisted — MLSNOW
- 2026-03-01 Contingent — MLSNOW
- 2026-02-20 Relisted — MLSNOW
- 2026-01-29 Contingent — MLSNOW
- 2026-01-22 Listed $130,000 MLSNOW
- 2008-06-15 Listing Removed — MLSNOW
- 2007-12-31 Listing Removed — MLSNOW
- 2007-12-05 Listed $65,000 MLSNOW
- 2007-06-11 Listed $65,000 MLSNOW
- 2005-12-07 Sold (Public Records) $65,000 Public Records
- 2005-12-07 Sold (MLS) $65,000 MLSNOW
- 2005-06-16 Listed $69,900 MLSNOW
- 2005-04-12 Listing Removed — MLSNOW
- 2004-10-12 Listed $69,900 MLSNOW
- 2002-04-15 Sold (MLS) $34,000 MLSNOW
- 2002-02-13 Listing Removed — MLSNOW
- 2001-12-10 Listed $36,500 MLSNOW
- 1999-04-01 Sold (Public Records) $50,000 Public Records
- 1991-09-23 Listing Removed — MLSNOW
- 1991-03-23 Listed $35,000 MLSNOW
- 1987-10-15 Sold (Public Records) $18,000 Public Records
Property tax history
+4.5%/yrLatest (2025): $1,015 · -4.9% YoY. Source: county tax records.
Cash-flow waterfall
monthlySold comps — $/sqft
last 12 mo · ≤1 miLoading sold comps…