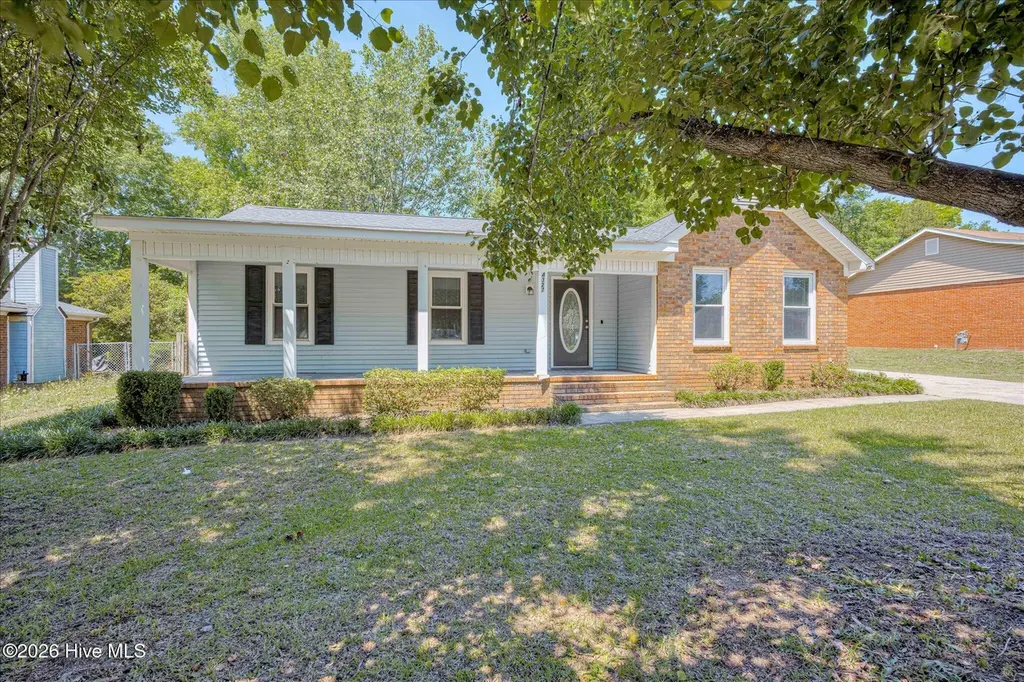
4327 Parkwood Dr · Augusta-Richmond County consolidated government (balance), GA
Flood risk 1/10 · Minimal
- FEMA flood zone
- X (unshaded)
- Chance of flooding over 30 yrs
- 0.0%
- Est. flood insurance / yr
- $507 – $1,088
Fire risk 4/10 · Minor
- Est. fire insurance / yr
- $963 – $1,789
Heat risk 7/10 · Major
- Hot days now (above 106°F)
- 7 days/yr
- Hot days in 30 yrs
- 17 days/yr
Wind risk 6/10 · Moderate
- Chance of severe wind over 30 yrs
- 70.0%
Air-quality risk 3/10 · Minor
- Unhealthy air days now
- 3 days/yr
- Unhealthy air days in 30 yrs
- 3 days/yr
Risk factors via First Street. Map © Google.
Why this score? — see what drove the C grade
The composite is a weighted blend of 9 inputs, each scored 0–100. Each bar is that input's sub-score; the figure is the points it added to the 100-point composite (weight × sub-score).
- Cash flow +21.4/30.0
- ARV discount +15.0/15.0
- DSCR +6.8/10.0
- 1% rule +5.6/10.0
- Livability +2.5/5.0
- Condition / age +2.5/5.0
- Rent growth +2.4/5.0
- Schools +1.3/10.0
- Appreciation +0.0/10.0
$154,900
🖨 Deal sheet (PDF) 📄 Offer letter ✓ Due diligence
Listing remarks MLS
3 bedroom 2 bath Brick ranch with fully fenced rear yard. Interior features and eat-in kitchen, formal dinning room and living room with brick fireplace. Owners suite with private bath and large closet. Kitchen walks out to back deck.
Key facts
- Covered front porch
- Rear deck
- Fenced backyard
Tags
Property features AI
Finance
- HOA & community: Street lights in the community; Subdivision: Woodvalley Estates
Exterior
- Parking: 2 parking spaces total; 2-car garage; Concrete parking pad
- Utilities: Public water; Public sewer; Sewer and water connected
- Home design: Single-family residence; One story; Entry level: 1
- Construction: Block, concrete and brick construction; Composition roof; Slab foundation; Built as single-family residence
- Exterior features: Covered patio/porch areas including front and rear porch; Deck; Fenced yard; Landscaped lot; Has a view
Interior
- Kitchen: Refrigerator; Dishwasher; Electric range; Vented exhaust fan
- Flooring: Carpet; Vinyl
- Bathrooms: 2 full bathrooms
- Heating & cooling: Central air conditioning; Electric heating; Forced air; Natural gas heating
- Interior features: Eat-in kitchen; 6 total rooms
Neighborhood map
What this means for you Summary
Snapshot
- This is a 3-bed/2.0-bath single-family listed at $155k.
Deal economics
- At list price, monthly cash flow is $231 ($3k/yr) — positive.
- The deal already cash-flows at list — no discount required.
- Meets the 1% rule at list price ($2k rent vs $155k).
- Cap rate 8.1% vs local median 5.3% in Augusta-Richmond County consolidated government (balance) — top-decile yield for the area; either an underpriced asset or a hidden risk that comps aren't pricing in. Stress-test before assuming the spread holds.
Location & tenants
- Location reads: area grade C — affects rentability + tenant quality, not the cash-flow math above.
- Richmond County (urban): math 12% / reading 20% proficiency, ranked #154 of 174 in GA (top 88%) — low school quality limits family demand, transient renter base, plan for 1-2y turnover; 72% free/reduced lunch — lower-income household profile, screen leases tightly.
- Zoned schools: Hephzibah Elementary School (math 12% / reading 17%, grade F, #996 of 1,228 statewide, top 83%, 375 students, 98% FRL); Hephzibah Middle School (math 12% / reading 21%, grade F, #388 of 470 statewide, top 83%, 517 students, 98% FRL) — zoned schools average 98% FRL vs 72% district-wide (26 pts higher); higher-poverty schools than district average — tighter screening recommended.
- Market conditions: Rents soft (-0.2%/yr); 367 active listings in the ZIP; 6 comparable units currently listed for rent nearby; rentals lingering (median 45d on market — plan ~5-8 weeks vacancy on turnover, expect pricing pressure); 67% of comp listings sitting > 30 days — soft ceiling on asking rent; 561 units permitted in Richmond County in 2024 (0 in 5+ unit buildings).
- This rent runs 43% of the median local income ($46k/yr) — at the standard rent-burdened threshold; future hikes will face affordability resistance.
Forward outlook
- Local home prices are declining (-3.0%/yr); year-one equity from $1k of loan paydown is wiped out by about $5k of value loss. Plan a longer hold.
- Richmond County population projected to shrink 5% by 2050 — rents likely to lag national; underwrite the cash flow, not the appreciation.
Negotiation context
- Only 1 days on market — expect competitive offers; lowballing is unlikely to land.
- 5 sale attempts since 10y ago with the ask held roughly flat each time — persistent listings suggest the price (not the market) is what's stuck; bring a comps-based counter.
Risks & watch-outs
- Climate carrying-cost: major wind risk, 70% chance of damaging wind over 30y; extreme-heat days projected 7→17/yr by 2055 (HVAC capex compounding) — expect insurance premiums to compound above CPI over the hold.
Questions for the listing agent
- Is there a deadline driving the sale (1031 exchange, divorce, estate, relocation)? That informs how much negotiation room exists.
- What's the average days-on-market for RENTAL listings here right now (not sales)? A rising rental-DOM trend means longer vacancies and softer asking-rent achievability than the comps imply.
- What's the recent tenant-quality profile in this submarket — average credit score on applications, eviction rate, late-payment / NSF rate, and stable-employment percentage? A property-management company in the area should have these aggregated.
- How much new for-sale + rental construction is in the pipeline within 1–3 miles? Heavy new supply typically softens prices + rents 12–24 months out; constrained supply supports both.
Investment metrics
- 1% rule
- 1.06% ✓
- Cap rate
- 8.08%
- Cash-on-cash
- 6.39%
- DSCR
- 1.28
- GRM
- 7.9
CMA / ARV
- ARV (on-the-fly)
- $223,380
- Comps found
- 12
Show comp detail 12 sales within ~0.75 mi
| Address | Dist | Beds/Ba | Sqft | Sold | Price | $/sf | Match |
|---|---|---|---|---|---|---|---|
| 2348 Fieldcrest Rd | 0.26mi | 3/2.0 | 1,450 (-5%) | 3mo | $224,000 | $154 | 77 |
| 4004 Crest Ct | 0.23mi | 3/2.0 | 1,473 (-4%) | 13mo | $205,000 | $139 | 72 |
| 4204 Field Ct | 0.10mi | 4/2.0 (+1) | 1,410 (-8%) | 8mo | $195,000 | $138 | 70 |
| 4220 Beckmont Dr | 0.47mi | 3/2.0 | 1,514 (-1%) | 9mo | $215,000 | $142 | 69 |
| 4304 Parkwood Dr | 0.18mi | 4/2.0 (+1) | 1,699 (+11%) | 3mo | $199,900 | $118 | 66 |
| 3808 Southfield Dr | 0.40mi | 4/2.0 (+1) | 1,559 (+2%) | 12mo | $215,000 | $138 | 63 |
| 2339 Basswood Dr | 0.28mi | 3/2.0 | 1,350 (-12%) | 6mo | $199,900 | $148 | 62 |
| 2373 Richwood Dr | 0.25mi | 3/2.0 | 1,318 (-14%) | 9mo | $205,000 | $156 | 58 |
| 4211 Beckmont Dr | 0.54mi | 3/2.0 | 1,428 (-7%) | 11mo | $235,000 | $165 | 55 |
| 2325 Moncrieff St | 0.64mi | 3/2.0 | 1,436 (-6%) | 7mo | $209,900 | $146 | 54 |
| 2403 W Quail Court Ct | 0.59mi | 3/1.5 | 1,440 (-6%) | 13mo | $85,000 | $59 | 50 |
| 4310 Sanderling Dr | 0.70mi | 3/2.0 | 1,637 (+7%) | 7mo | $239,900 | $147 | 50 |
Match score weights: distance 35% · size 25% · config 20% · recency 20%. Top-matched comps best support the ARV.
Projected returns pro-forma
-3.0% appreciation · 0.0% rent growth · sell at horizon
- IRR
- -9.9%
- Equity multiple
- 0.65×
- Total profit
- $-15,170
- Equity at exit
- $23,096
- IRR
- -5.2%
- Equity multiple
- 0.71×
- Total profit
- $-12,741
- Equity at exit
- $13,393
Cash invested: $43,372 (down + closing). Projections, not guarantees.
Landlord ↔ Tenant lean methodology
- Overall (STATE)
- 90 Strongly Landlord-Friendly
- State Georgia
- 90 Strongly Landlord-Friendly · R+3
- County
- — inherits STATE
- City
- — inherits STATE
ZIP-level market 30906
- Home prices YoY
- -21.6%
- Rents YoY
- -0.2%
- Active inventory
- 367
- Price-to-rent
- 7.9×
Monthly cashflow live
- Estimated rent
- $1,639 high interval (Pro) →
- Mortgage (P&I)
- −$812
- Tax from tax record
- −$187 /mo · $2,241/yr
- Insurance
- −$65
- HOA
- −$0
- Vacancy / Maint / Mgmt
- −$344
- Net cashflow
- $231
Break-even live
Sensitivity live
| Price | -10% $319 | -5% $275 | +0% $231 | +5% $187 | +10% $143 |
|---|---|---|---|---|---|
| Rent | -10% $102 | -5% $166 | +0% $231 | +5% $296 | +10% $360 |
| Rate | -1.0pp $309 | -0.5pp $270 | base $231 | +0.5pp $191 | +1.0pp $150 |
UW: 25.0% down · 7.5% · 30yr · 1.5% tax · 5.0% vac · 8.0% maint · 8.0% mgmt
Financing live
Cash to close
- Down payment
- $38,725
- Closing costs
- $4,647
- Reserves months
- —
- Total cash needed
- —
Loan-product check · same deal, 3 products live
Conventional
25% down · 7.5% · 30yr
- Down + closing
- —
- Monthly P&I
- —
- Monthly cashflow
- —
- DSCR
- —
- Eligible?
- —
Personal DTI + credit; lowest rate.
DSCR
20% down · 8.5% · 30yr
- Down + closing
- —
- Monthly P&I
- —
- Monthly cashflow
- —
- DSCR
- —
- Eligible?
- —
No personal income docs; deal must DSCR.
Hard money
10% down · 12.0% · 12mo
- Down + closing
- —
- Monthly P&I
- —
- Monthly cashflow
- —
- DSCR
- —
- Eligible?
- —
Short-term bridge; refi at stabilization.
Rent comps 6 comps
| Address | Beds | Baths | Sqft | Rent | $/sqft | DOM | Units | Dist |
|---|---|---|---|---|---|---|---|---|
| 2302 Woodsman Dr Augusta, GA | 3.0 | 2.0 | 1436 | $1,475 | $1.03 | 24d | 1 | 0.16mi |
| 2401 Boykin Rd Hephzibah, GA | 3.0 | 2.5 | 1644 | $1,600 | $0.97 | 45d | 1 | 0.71mi |
| 4416 Hatteras Dr Augusta, GA | 3.0 | 2.0 | 1436 | $1,600 | $1.11 | 15d | 1 | 0.81mi |
| 4235 Cap Chat St Hephzibah, GA | 3.0 | 2.0 | 1300 | $1,651 | $1.27 | 45d | 1 | 1.01mi |
| 4438 Windsor Spring Rd Hephzibah, GA | 4.0 | 2.0 | 1653 | $1,900 | $1.15 | 45d | 1 | 1.11mi |
| 2933 Easton Dr Hephzibah, GA | 4.0 | 2.5 | 2038 | $2,200 | $1.08 | 45d | 1 | 1.48mi |
Listing history 14 events
-
2026-05-21$154,900 Active
-
2026-04-26historical $1,706
-
2026-04-24$1,706
-
2025-04-11historical $1,695
-
2025-04-05$1,695
-
2019-12-31soldstatus $17,554,800
-
2018-09-18soldstatus $7,643,100
-
2017-09-25soldstatus $600,900
-
2017-02-24soldstatus $48,500
-
2017-02-15soldstatus $48,500 235-char remark
Show marketing remark (235 chars)
3 bedroom 2 bath Brick ranch with fully fenced rear yard. Interior features and eat-in kitchen, formal dinning room and living room with brick fireplace. Owners suite with private bath and large closet. Kitchen walks out to back deck.
-
2016-12-01$49,900 235-char remark
Show marketing remark (235 chars)
3 bedroom 2 bath Brick ranch with fully fenced rear yard. Interior features and eat-in kitchen, formal dinning room and living room with brick fireplace. Owners suite with private bath and large closet. Kitchen walks out to back deck.
-
1988-05-01soldstatus $61,900
ⓘ Source: listings_history table (triggers on properties + properties_extension) + one-shot
backfill from property_details.listing_events for pre-trigger history.
Tax reassessment forecast GA · Resets to sale price
- Current annual tax
- $2,241 · $187/mo
- Projected year-2 tax
- $2,241 · $187/mo
- Expected delta
- $0/yr ($0/mo · 0.0%)
ⓘ Screening estimate from a state-policy table — verify with the county assessor before closing.
Climate risk First Street
- Flood 1/10 Low FEMA zone X (unshaded) · 0% chance over 30 yrs
- Wildfire 4/10 Moderate
- Heat 7/10 Severe 7 d/yr ≥106°F today · 17 d/yr by 30 yrs out
- Wind 6/10 Major 70% chance of damaging wind over 30 yrs
- Air quality 3/10 Moderate 3 unhealthy d/yr today · 3 by 30 yrs out
Nearby sold comps map
Loading sold comps map…
Walkable amenities ~0.75 mi
Loading nearby amenities…
Taxation est. · year 1
- Rental income
- $19,664
- − Mortgage interest
- −$8,677
- − Property taxes
- −$2,241
- − Insurance
- −$774
- − Repairs & maintenance
- −$1,573
- − Management
- −$1,573
- − Depreciation
- −$4,506
- Taxable income
- $320
- Est. tax owed @ 24.0%
- −$77
- After-tax cash flow
- $2,695/yr
For passive investors: Depreciation is non-cash, so a rental often shows a tax loss while cash-flowing — sheltering income. Rental losses are passive: they offset passive income freely, and up to $25,000/yr can offset ordinary (W-2) income if you actively participate and your MAGI is under $100k (phasing out to $0 by $150k); unused losses carry forward. On sale, claimed depreciation is recaptured at up to 25%, and gains may owe capital-gains tax (a 1031 exchange can defer both). Figures are a year-1 estimate at your 24.0% rate — not tax advice; consult a CPA.
Schools (NCES district)
- District
- Richmond County
- NCES district ID
- 1304380
- Math proficiency
- 12% ▼ -9.00%
- Reading proficiency
- 20% ▼ -6.00%
- Median HH income
- $38,069
- Composite
- 13.43/100
- National rank
- #9524
- State rank
- #154 of 174 in GA
Livability — Augusta-Richmond County consolidated government (balance)
No livability data for this city. (Only ~50 U.S. cities are tracked.)
Census & demographics
- Census place
- Augusta-Richmond County consolidated government (balance), GA
- County
- Richmond County · 190,917 people
- City population
- 154,035
- Metro
- Augusta-Richmond County, GA-SC
- Population (ZIP)
- 60,423
- Household income
- $45,999
- Rent vs Own
- Severe rent burden
- 3363.0
Population outlook (Richmond County) Hauer SSP2
- Today (2025)
- 200,753 people
- By 2030
- 200,232 · -0.3%
- By 2040
- 196,813 · -2.0%
- By 2050
- 190,347 · -5.2%
- By 2075
- 172,496 · -14.1%
- By 2100
- 146,284 · -27.1%
Race, ethnicity, and origin ACS 2023
- Neighborhood character
- Majority Black (64%)
- Race & ethnicity
- Black 64% White 27% Two or more races 5% Hispanic / Latino 5%
- Common ancestry
- Lithuanian 1%
- Foreign-born
- 2% · Canada
- Languages at home
- 95% English-only · Spanish 3% German/W. Germanic 1%
Political lean MEDSL · Richmond
- 2024 margin
- Solid D (+36.1) · D 67.8% · R 31.7%
- 2008→2024 swing
- +4.3pp toward D · 2008: 31.8pp · 2024: 36.1pp
- All cycles
- 2024: D+36.1 2020: D+37.2 2016: D+32.4 2012: D+33.8 2008: D+31.8
Not yet ingested
- Civics
- —
Market trends
- HPI YoY
- ▼ -58.99%
- Current HPI
- 213.5733
- Rent YoY
- ▼ -0.25%
- Metro
- Augusta-Richmond County, GA-SC
- State GDP YoY
- ▲ 2.66%
- F500 in state
- 28
Industry mix (Fortune 500 HQ in GA)
| Industry | F500 HQs | Revenue |
|---|---|---|
| Paper / Packaging | 2 | $29B |
|
||
| Retail | 1 | $160B |
|
||
| Transportation / Logistics | 1 | $91B |
|
||
| Airlines | 1 | $62B |
|
||
| Consumer Goods | 1 | $47B |
|
||
| Utilities | 1 | $25B |
|
||
Price history
+150.2% since first listed15 events — show timeline
- 2026-05-22 Pending — Hive MLS
- 2026-05-21 Listed $154,900 Hive MLS
- 2026-04-26 Rental Removed $1,706 RENTLY
- 2026-04-24 Listed for Rent $1,706 RENTLY
- 2025-04-11 Rental Removed $1,695 RENTLY
- 2025-04-05 Listed for Rent $1,695 RENTLY
- 2019-12-31 Sold (Public Records) $17,554,800 Public Records
- 2018-09-18 Sold (Public Records) $7,643,100 Public Records
- 2017-09-25 Sold (Public Records) $600,900 Public Records
- 2017-02-24 Sold (Public Records) $48,500 Public Records
- 2017-02-15 Sold (MLS) $48,500 Hive MLS
- 2017-02-15 Sold (MLS) $48,500 Hive MLS
- 2016-12-01 Listed $49,900 Hive MLS
- 2016-12-01 Listed $49,900 Hive MLS
- 1988-05-01 Sold (Public Records) $61,900 Public Records
Property tax history
+5.9%/yrLatest (2025): $2,241 · +3.5% YoY. Source: county tax records.
Cash-flow waterfall
monthlySold comps — $/sqft
last 12 mo · ≤1 miLoading sold comps…