7313 Private Road 1830 · West Plains, MO
Flood risk 1/10 · Minimal
- FEMA flood zone
- X (unshaded)
- Chance of flooding over 30 yrs
- 0.0%
- Est. flood insurance / yr
- $473 – $860
Fire risk 5/10 · Moderate
- Est. fire insurance / yr
- $1,054 – $1,958
Heat risk 4/10 · Minor
- Hot days now (above 105°F)
- 7 days/yr
- Hot days in 30 yrs
- 18 days/yr
Wind risk 2/10 · Minimal
- Chance of severe wind over 30 yrs
- 2.0%
Air-quality risk 2/10 · Minimal
- Unhealthy air days now
- 1 days/yr
- Unhealthy air days in 30 yrs
- 1 days/yr
Risk factors via First Street. Map © Google.
Why this score? — see what drove the F grade
The composite is a weighted blend of 9 inputs, each scored 0–100. Each bar is that input's sub-score; the figure is the points it added to the 100-point composite (weight × sub-score).
- ARV discount +7.5/15.0
- Cash flow +7.2/30.0
- Livability +3.9/5.0
- Schools +3.2/10.0
- Rent growth +2.5/5.0
- Condition / age +2.5/5.0
- DSCR +1.4/10.0
- 1% rule +0.9/10.0
- Appreciation +0.0/10.0
$179,900
🖨 Deal sheet (PDF) 📄 Offer letter ✓ Due diligence
Listing remarks
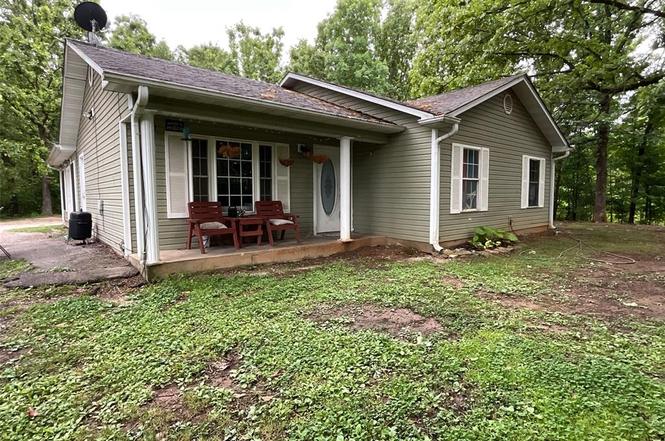
This would make a great home for a large family. Needs some tlc. 4-bedroom, 3-bath. Has two master suites. 2 living rooms. Had an addition put on after the home was built in 1999. With an addition put on in 2008. A new roof was also put on in 2008. (Central AC doesn't work. Storage shed stays. We have a bid for the whole inside of the home to be painted. We can add it to the purchase price and put in escrow for the new buyer.
Key facts
- 1.23 acre lot
- Built 1999
- Listed 16 days
Property features AI
Finance
- Financial info: Tax annual amount available (financial details excluded per instructions)
Exterior
- Parking: Driveway
- Security: No security features listed
- Utilities: Water: other; Sewer: septic tank
- Home design: Single family residence; One-level; Residential property
- Construction: Composition roof; Slab foundation; Built area above grade: 2,200
- Exterior features: Covered patio/porch; Few trees; Level site; Gravel road access; Private maintained road; Private and county road frontage
Interior
- Kitchen: Electric oven; Free-standing electric oven; Dishwasher; Refrigerator; Water softener (owned); Electric water heater
- Bedrooms: Bedrooms not specified
- Flooring: Carpet; Vinyl; Tile
- Bathrooms: 3 full bathrooms
- Heating & cooling: Central heating; Electric heating; Heat pump; Ceiling fan(s); Window unit(s)
- Interior features: Entrance foyer; Walk-in closet(s); Therapeutic whirlpool
- Laundry & utility: Laundry on main level
Neighborhood map
What this means for you Summary
Snapshot
- This is a 4-bed/3.0-bath other listed at $180k.
Deal economics
- At list price, monthly cash flow is $-247 ($-3k/yr) — negative.
- To cash-flow at today's rent, offer at most $136k (24.2% below list).
- To meet the 1% rule (rent ≥ 1% of price), the offer needs to be $107k (40.8% below list).
- Recommended offer: $107k (40.8% below list) — sets the bar for 1% rule.
- Cap rate 4.6% vs local median 3.1% in West Plains — top-decile yield for the area; either an underpriced asset or a hidden risk that comps aren't pricing in. Stress-test before assuming the spread holds.
Location & tenants
- Location reads 77/100 on livability (#34 in MO, #2,977 nationally) — a middle-class / working-renter tenant base. Strengths: cost of living A+, health & safety A+, housing A-; Watch: crime C-, commute C-, amenities D.
- Richards R-V (rural): math 37% / reading 39% proficiency, ranked #187 of 324 in MO (top 58%) — families likely to look elsewhere, expect single-tenant / working-renter base with shorter leases.
- Zoned schools: Richards Elem. (math 37% / reading 39%, grade F, #604 of 1,115 statewide, top 54%, 372 students, 63% FRL).
- Market conditions: 320 active listings in the ZIP; 53 units permitted in Howell County in 2024 (0 in 5+ unit buildings).
Forward outlook
- Local home prices are declining (-3.0%/yr); year-one equity from $1k of loan paydown is wiped out by about $5k of value loss. Plan a longer hold.
- Howell County population projected at -18% by 2050 — secular population decline; favor cash flow + early exit over multi-decade hold.
Negotiation context
- It's been on market 17 days — a 2% lower offer ($177k) is reasonable based on typical stale-listing flexibility.
Risks & watch-outs
- Climate carrying-cost: moderate wildfire risk — expect insurance premiums to compound above CPI over the hold.
Questions for the listing agent
- What do current leases actually rent for vs. the listed asking? Can we see a recent rent roll and the last 12 months of T-12 income?
- Is there a deadline driving the sale (1031 exchange, divorce, estate, relocation)? That informs how much negotiation room exists.
- Schools are D-rated, which usually means shorter tenancies and higher turnover. Who's the typical renter profile here, and what's been the actual vacancy rate?
- The area grade is low — what's the realistic commute time and amenity access for the typical tenant pool here? Any planned neighborhood developments (good or bad) we should know about?
- What's the average days-on-market for RENTAL listings here right now (not sales)? A rising rental-DOM trend means longer vacancies and softer asking-rent achievability than the comps imply.
- What's the recent tenant-quality profile in this submarket — average credit score on applications, eviction rate, late-payment / NSF rate, and stable-employment percentage? A property-management company in the area should have these aggregated.
- How much new for-sale + rental construction is in the pipeline within 1–3 miles? Heavy new supply typically softens prices + rents 12–24 months out; constrained supply supports both.
Investment metrics
- 1% rule
- 0.59% ✗
- Cap rate
- 4.65%
- Cash-on-cash
- -5.88%
- DSCR
- 0.74
- GRM
- 14.1
CMA / ARV
No comps found within radius.
Projected returns pro-forma
-3.0% appreciation · 3.0% rent growth · sell at horizon
- IRR
- -26.5%
- Equity multiple
- 0.11×
- Total profit
- $-44,956
- Equity at exit
- $26,824
- IRR
- -23.9%
- Equity multiple
- -0.19×
- Total profit
- $-59,718
- Equity at exit
- $15,554
Cash invested: $50,372 (down + closing). Projections, not guarantees.
Landlord ↔ Tenant lean methodology
- Overall (STATE)
- 81 Strongly Landlord-Friendly
- State Missouri
- 81 Strongly Landlord-Friendly · R+10
- County
- — inherits STATE
- City
- — inherits STATE
ZIP-level market 65775
- Home prices YoY
- -16.4%
- Active inventory
- 320
- Price-to-rent
- 14.1×
Monthly cashflow live
- Estimated rent
- $1,065 medium interval (Pro) →
- Mortgage (P&I)
- −$943
- Tax from tax record
- −$70 /mo · $841/yr
- Insurance
- −$75
- HOA
- −$0
- Vacancy / Maint / Mgmt
- −$224
- Net cashflow
- $-247
Break-even live
Sensitivity live
| Price | -10% $-145 | -5% $-196 | +0% $-247 | +5% $-298 | +10% $-349 |
|---|---|---|---|---|---|
| Rent | -10% $-331 | -5% $-289 | +0% $-247 | +5% $-205 | +10% $-163 |
| Rate | -1.0pp $-156 | -0.5pp $-201 | base $-247 | +0.5pp $-294 | +1.0pp $-341 |
UW: 25.0% down · 7.5% · 30yr · 1.5% tax · 5.0% vac · 8.0% maint · 8.0% mgmt
Financing live
Cash to close
- Down payment
- $44,975
- Closing costs
- $5,397
- Reserves months
- —
- Total cash needed
- —
Loan-product check · same deal, 3 products live
Conventional
25% down · 7.5% · 30yr
- Down + closing
- —
- Monthly P&I
- —
- Monthly cashflow
- —
- DSCR
- —
- Eligible?
- —
Personal DTI + credit; lowest rate.
DSCR
20% down · 8.5% · 30yr
- Down + closing
- —
- Monthly P&I
- —
- Monthly cashflow
- —
- DSCR
- —
- Eligible?
- —
No personal income docs; deal must DSCR.
Hard money
10% down · 12.0% · 12mo
- Down + closing
- —
- Monthly P&I
- —
- Monthly cashflow
- —
- DSCR
- —
- Eligible?
- —
Short-term bridge; refi at stabilization.
Listing history 17 events
-
2026-06-22days on market $179,900 Active 17 DOM
-
2026-06-21days on market $179,900 Active 16 DOM
-
2026-06-21days on market $179,900 Active 15 DOM
-
2026-06-18days on market $179,900 Active 13 DOM
-
2026-06-17days on market $179,900 Active 12 DOM
-
2026-06-16days on market $179,900 Active 11 DOM
-
2026-06-15days on market $179,900 Active 10 DOM
-
2026-06-13days on market $179,900 Active 8 DOM
-
2026-06-12days on market $179,900 Active 7 DOM
-
2026-06-09days on market $179,900 Active 4 DOM
-
2026-06-08days on market $179,900 Active 3 DOM
-
2026-06-07days on market $179,900 Active 2 DOM
-
2026-06-05days on market $179,900 Active 5 DOM
-
2026-06-04days on market $179,900 Active 3 DOM
-
2026-06-02days on market $179,900 Active 2 DOM
-
2026-06-01remarks 429-char remark
-
2026-06-01$179,900 Active 1 DOM
ⓘ Source: listings_history table (triggers on properties + properties_extension) + one-shot
backfill from property_details.listing_events for pre-trigger history.
Tax reassessment forecast MO · Resets to sale price
- Current annual tax
- $841 · $70/mo
- Projected year-2 tax
- $1,745 · $145/mo
- Expected delta
- +$904/yr (+$75/mo · 107.4%)
ⓘ Screening estimate from a state-policy table — verify with the county assessor before closing.
Climate risk First Street
- Flood 1/10 Low FEMA zone X (unshaded) · 0% chance over 30 yrs
- Wildfire 5/10 Major
- Heat 4/10 Moderate 7 d/yr ≥105°F today · 18 d/yr by 30 yrs out
- Wind 2/10 Low 2% chance of damaging wind over 30 yrs
- Air quality 2/10 Low 1 unhealthy d/yr today · 1 by 30 yrs out
Nearby sold comps map
Loading sold comps map…
Walkable amenities ~0.75 mi
Loading nearby amenities…
Taxation est. · year 1
- Rental income
- $12,783
- − Mortgage interest
- −$10,077
- − Property taxes
- −$841
- − Insurance
- −$900
- − Repairs & maintenance
- −$1,023
- − Management
- −$1,023
- − Depreciation
- −$5,233
- Taxable loss
- −$6,313
- Est. tax savings @ 24.0%
- +$1,515
- After-tax cash flow
- $-1,448/yr
For passive investors: Depreciation is non-cash, so a rental often shows a tax loss while cash-flowing — sheltering income. Rental losses are passive: they offset passive income freely, and up to $25,000/yr can offset ordinary (W-2) income if you actively participate and your MAGI is under $100k (phasing out to $0 by $150k); unused losses carry forward. On sale, claimed depreciation is recaptured at up to 25%, and gains may owe capital-gains tax (a 1031 exchange can defer both). Figures are a year-1 estimate at your 24.0% rate — not tax advice; consult a CPA.
Schools (NCES district)
- District
- Richards R-V
- NCES district ID
- 2926370
- Math proficiency
- 37% ▼ -2.00%
- Reading proficiency
- 39% ▼ -12.00%
- Median HH income
- $36,052
- Composite
- 31.5/100
- National rank
- #5972
- State rank
- #187 of 324 in MO
Livability — West Plains
- Score
- 77/100
- State rank
- #34
- US rank
- #2977
Category grades
Schools grade is shown separately in the Schools card above.
Census & demographics
- Population (ZIP)
- 24,950
Population outlook (Howell County) Hauer SSP2
- Today (2025)
- 38,462 people
- By 2030
- 37,240 · -3.2%
- By 2040
- 34,495 · -10.3%
- By 2050
- 31,450 · -18.2%
- By 2075
- 23,660 · -38.5%
- By 2100
- 16,373 · -57.4%
Race, ethnicity, and origin ACS 2023
- Neighborhood character
- Predominantly White (94%)
- Race & ethnicity
- White 94% Two or more races 4% Hispanic / Latino 2%
- Common ancestry
- Lithuanian 2% Portuguese 2% Slovak 1%
- Foreign-born
- 1% · Canada
- Languages at home
- 97% English-only · Spanish 1% German/W. Germanic 1%
Political lean MEDSL · Howell
- 2024 margin
- Solid R (+66.8) · D 16.2% · R 83.0%
- 2008→2024 swing
- -36.0pp toward R · 2008: -30.8pp · 2024: -66.8pp
- All cycles
- 2024: R+66.8 2020: R+64.2 2016: R+63.2 2012: R+43.8 2008: R+30.8
Not yet ingested
- Civics
- —
Market trends
- HPI YoY
- ▼ -44.99%
- Current HPI
- 228.8763
- Rent YoY
- —
- Metro
- —
- State GDP YoY
- ▲ 1.84%
- F500 in state
- 20
Industry mix (Fortune 500 HQ in MO)
| Industry | F500 HQs | Revenue |
|---|---|---|
| Healthcare | 1 | $163B |
|
||
| Insurance | 1 | $21B |
|
||
| Industrial Technology | 1 | $17B |
|
||
| Retail | 1 | $16B |
|
||
| Industrial Distribution | 1 | $10B |
|
||
| Utilities | 1 | $9B |
|
||
Price history
3 events — show timeline
- 2026-06-01 Listed $179,900 SOMO
- 2007-11-02 Sold (Public Records) — Public Records
- 2002-05-21 Sold (Public Records) — Public Records
Property tax history
+1.9%/yrLatest (2025): $841 · +11.6% YoY. Source: county tax records.
Cash-flow waterfall
monthlySold comps — $/sqft
last 12 mo · ≤1 miLoading sold comps…