 Multi-family
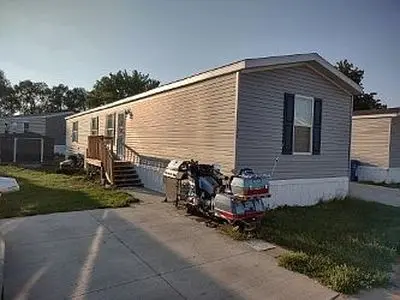
833 E Duke St · Vermillion, SD
Flood risk No data
- FEMA flood zone
- —
- Chance of flooding over 30 yrs
- —
- Est. flood insurance / yr
- —
Fire risk No data
- Est. fire insurance / yr
- —
Heat risk No data
- Hot days now (above threshold)
- —
- Hot days in 30 yrs
- —
Wind risk No data
- Chance of severe wind over 30 yrs
- —
Air-quality risk No data
- Unhealthy air days now
- —
- Unhealthy air days in 30 yrs
- —
Risk factors via First Street. Map © Google.
Why this score? — see what drove the D+ grade
The composite is a weighted blend of 9 inputs, each scored 0–100. Each bar is that input's sub-score; the figure is the points it added to the 100-point composite (weight × sub-score).
- Cash flow +15.0/30.0
- ARV discount +7.5/15.0
- 1% rule +5.0/10.0
- DSCR +5.0/10.0
- Schools +4.3/10.0
- Livability +4.2/5.0
- Rent growth +2.5/5.0
- Condition / age +2.5/5.0
- Appreciation +0.0/10.0
$65,000
🖨 Deal sheet 📄 Offer letter ✓ Due diligence
Multi-family units
County records classify this as Multi-Family (5+ Unit). Listing-text estimate: 1 unit. estimate disagrees with records
5+ unit building — per-unit beds/baths from public records are typically unavailable; the breakdown below (if shown) is an estimate from the listing text.
Listing remarks MLS
INVESTMENT OPPORTUNITY!! Purchase these 4 trailer homes in lots 102, 103, 104 & 109 to increase your monthly income! All units are occupied, some with tenants for 4 and 5 years! This is a solid investment portfolio with proven profitability. Trailers were built in 1998, 1974, 1973 & 1972. Each trailer is remodeled as needed and when vacant, to include flooring, paint, vanities, etc. Call your agent for more information!
Key facts
- Wood-look flooring
- Walk-in closet
- Large island
Tags
Neighborhood map
What this means for you Summary
Snapshot
- This is a 3-bed/1.0-bath multifamily listed at $65k.
Deal economics
- At list price, monthly cash flow is $4k ($49k/yr) — positive.
- The deal already cash-flows at list — no discount required.
- Meets the 1% rule at list price ($6k rent vs $65k).
- Cap rate 81.5% vs local median 2.5% in Vermillion — top-decile yield for the area; either an underpriced asset or a hidden risk that comps aren't pricing in. Stress-test before assuming the spread holds.
Location & tenants
- Location reads 84/100 on livability (#5 in SD, #757 nationally) — a professional / high-income tenant draw. Strengths: amenities A+, cost of living A+, housing A+; Watch: commute F, employment F.
- Vermillion School District 13-1 (town): math 44% / reading 61% proficiency, ranked #27 of 59 in SD (top 46%) — acceptable for families but not a draw, mixed tenant base, ~2y average lease.
- Market conditions: 120 active listings in the ZIP; 3 comparable units currently listed for rent nearby; rentals lingering (median 44d on market — plan ~5-8 weeks vacancy on turnover, expect pricing pressure); 100% of comp listings sitting > 30 days — soft ceiling on asking rent; 28 units permitted in Clay County in 2024 (10 in 5+ unit buildings).
- At $5,727/mo this rent would consume 129% of the median local household income ($53k/yr) (locally 792% of renters already pay >50% of income on rent) — very limited rent-growth headroom before tenants either downsize or default.
Forward outlook
- Local home prices are declining (-3.0%/yr); year-one equity from $449 of loan paydown is wiped out by about $2k of value loss. Plan a longer hold.
- Clay County population projected at +12% by 2050 — modest demand growth; plan on rents tracking national, not racing it.
- At projected returns (-3.0% appreciation + 3.0% rent growth), your $18k cash investment doubles in ~1 year — after that, you're playing with house money.
Negotiation context
- Only 14 days on market — expect competitive offers; lowballing is unlikely to land.
- 5 sale attempts since 3y ago with the ask held roughly flat each time — persistent listings suggest the price (not the market) is what's stuck; bring a comps-based counter.
- Current owner paid $40k; list at $65k implies a 62% gain — meaningful room to come down on a strong offer.
Questions for the listing agent
- Is there a deadline driving the sale (1031 exchange, divorce, estate, relocation)? That informs how much negotiation room exists.
- Schools are A-rated — typically a magnet for longer-tenancy family renters. What's the average tenant stay here, and is there a school-zone premium baked into asking?
- The area grade is low — what's the realistic commute time and amenity access for the typical tenant pool here? Any planned neighborhood developments (good or bad) we should know about?
- What's the average days-on-market for RENTAL listings here right now (not sales)? A rising rental-DOM trend means longer vacancies and softer asking-rent achievability than the comps imply.
- What's the recent tenant-quality profile in this submarket — average credit score on applications, eviction rate, late-payment / NSF rate, and stable-employment percentage? A property-management company in the area should have these aggregated.
- How much new apartment / multifamily construction is in the pipeline within 1–3 miles? Heavy new supply (>2% of stock underway) typically softens rents 12–24 months out; light construction supports rent growth.
Investment metrics
- 1% rule
- 8.81% ✓
- Cap rate
- 81.53%
- Cash-on-cash
- 268.69%
- DSCR
- 12.96
- GRM
- 0.9
CMA / ARV
No comps found within radius.
Projected returns pro-forma
-3.0% appreciation · 3.0% rent growth · sell at horizon
- IRR
- —
- Equity multiple
- 14.69×
- Total profit
- $249,101
- Equity at exit
- $9,692
- IRR
- —
- Equity multiple
- 31.30×
- Total profit
- $551,472
- Equity at exit
- $5,620
Cash invested: $18,200 (down + closing). Projections, not guarantees.
Landlord ↔ Tenant lean methodology
- Overall (STATE)
- 83 Strongly Landlord-Friendly
- State South Dakota
- 83 Strongly Landlord-Friendly · R+16
- County
- — inherits STATE
- City
- — inherits STATE
ZIP-level market 57069
- Home prices YoY
- -32.8%
- Active inventory
- 120
- Price-to-rent
- 4.7×
Monthly cashflow live
- Estimated rent
- $5,727 medium interval (Pro) →
- Mortgage (P&I)
- −$341
- Tax est. 1.5%
- −$81 /mo · $975/yr
- Insurance
- −$27
- HOA
- −$0
- Vacancy / Maint / Mgmt
- −$1,203
- Net cashflow
- $4,075
Break-even live
5-unit breakdown (identical units grouped — click to expand)
| Units | Beds | Baths | Est. rent |
|---|---|---|---|
| 5× units | 3 | 1 | $5,725 |
| #1 | 3 | 1 | $1,145 |
| #2 | 3 | 1 | $1,145 |
| #3 | 3 | 1 | $1,145 |
| #4 | 3 | 1 | $1,145 |
| #5 | 3 | 1 | $1,145 |
| Total (5 units) | $5,727 | ||
UW: 25.0% down · 7.5% · 30yr · 1.5% tax · 5.0% vac · 8.0% maint · 8.0% mgmt
Financing live
Cash to close
- Down payment
- $16,250
- Closing costs
- $1,950
- Reserves months
- —
- Total cash needed
- —
Loan-product check · same deal, 3 products live
Conventional
25% down · 7.5% · 30yr
- Down + closing
- —
- Monthly P&I
- —
- Monthly cashflow
- —
- DSCR
- —
- Eligible?
- —
Personal DTI + credit; lowest rate.
DSCR
20% down · 8.5% · 30yr
- Down + closing
- —
- Monthly P&I
- —
- Monthly cashflow
- —
- DSCR
- —
- Eligible?
- —
No personal income docs; deal must DSCR.
Hard money
10% down · 12.0% · 12mo
- Down + closing
- —
- Monthly P&I
- —
- Monthly cashflow
- —
- DSCR
- —
- Eligible?
- —
Short-term bridge; refi at stabilization.
Rent comps 3 comps
| Address | Beds | Baths | Sqft | Rent | $/sqft | DOM | Units | Dist |
|---|---|---|---|---|---|---|---|---|
| 315 N Norbeck St Vermillion, SD | 2.0 | 1.5 | 1100 | $1,320 | $1.20 | 43d | 1 | 0.57mi |
| 1000 N Dakota St Vermillion, SD | 2.0 | 2.0 | 790 | $756 | $0.96 | 43d | 1 | 0.57mi |
| 105 E Dartmouth St Vermillion, SD | 2.0 | 1.0 | 700 | $900 | $1.29 | 43d | 1 | 0.64mi |
Listing history 10 events
-
2026-06-19days on market $65,000 Active 14 DOM
-
2026-06-18days on market $65,000 Active 13 DOM
-
2026-06-17days on market $65,000 Active 12 DOM
-
2026-06-16days on market $65,000 Active 11 DOM
-
2026-06-15days on market $65,000 Active 10 DOM
-
2026-06-14days on market $65,000 Active 8 DOM
-
2026-06-12days on market $65,000 Active 7 DOM
-
2026-06-09days on market $65,000 Active 4 DOM
-
2026-06-08days on market $65,000 Active 3 DOM
-
2026-06-07$65,000 Active 2 DOM
ⓘ Source: listings_history table (triggers on properties + properties_extension) + one-shot
backfill from property_details.listing_events for pre-trigger history.
Nearby sold comps map
Loading sold comps map…
Walkable amenities ~0.75 mi
Loading nearby amenities…
Taxation est. · year 1
- Rental income
- $68,724
- − Mortgage interest
- −$3,641
- − Property taxes
- −$975
- − Insurance
- −$325
- − Repairs & maintenance
- −$5,498
- − Management
- −$5,498
- − Depreciation
- −$1,891
- Taxable income
- $50,896
- Est. tax owed @ 24.0%
- −$12,215
- After-tax cash flow
- $36,686/yr
For passive investors: Depreciation is non-cash, so a rental often shows a tax loss while cash-flowing — sheltering income. Rental losses are passive: they offset passive income freely, and up to $25,000/yr can offset ordinary (W-2) income if you actively participate and your MAGI is under $100k (phasing out to $0 by $150k); unused losses carry forward. On sale, claimed depreciation is recaptured at up to 25%, and gains may owe capital-gains tax (a 1031 exchange can defer both). Figures are a year-1 estimate at your 24.0% rate — not tax advice; consult a CPA.
Schools (NCES district)
- District
- Vermillion School District 13-1
- NCES district ID
- 4674370
- Math proficiency
- 44% ▼ -8.00%
- Reading proficiency
- 61% ▼ -7.00%
- Median HH income
- $36,421
- Composite
- 43.49/100
- National rank
- #2995
- State rank
- #27 of 59 in SD
Livability — Vermillion
- Score
- 84/100
- State rank
- #5
- US rank
- #757
Category grades
Schools grade is shown separately in the Schools card above.
Census & demographics
- Census place
- Vermillion, SD
- County
- Clay County · 13,091 people
- City population
- 13,091
- Metro
- Vermillion, SD
- Population (ZIP)
- 13,091
- Household income
- $53,327
- Rent vs Own
- Severe rent burden
- 792.0
Population outlook (Clay County) Hauer SSP2
- Today (2025)
- 15,009 people
- By 2030
- 15,554 · +3.6%
- By 2040
- 15,862 · +5.7%
- By 2050
- 16,801 · +11.9%
- By 2075
- 20,880 · +39.1%
- By 2100
- 27,360 · +82.3%
Race, ethnicity, and origin ACS 2023
- Neighborhood character
- Predominantly White (86%)
- Race & ethnicity
- White 86% Native American 5% Asian 3% Two or more races 3% Hispanic / Latino 3% Black 2%
- Common ancestry
- Portuguese 9% Iranian 2% Serbian 2%
- Foreign-born
- 5% · Canada, China, Vietnam
- Languages at home
- 94% English-only · Chinese 1% Spanish 1% Arabic 1%
Political lean MEDSL · Clay
- 2024 margin
- Lean D (+6.5) · D 52.0% · R 45.5% · Other 2.5%
- 2008→2024 swing
- -17.7pp toward R · 2008: 24.2pp · 2024: 6.5pp
- All cycles
- 2024: D+6.5 2020: D+11.0 2016: D+9.8 2012: D+15.5 2008: D+24.2
Not yet ingested
- Civics
- —
Market trends
- HPI YoY
- ▼ -90.55%
- Current HPI
- 185.1311
- Rent YoY
- —
- Metro
- Vermillion, SD
- State GDP YoY
- ▲ 0.70%
- F500 in state
- 2
Industry mix (Fortune 500 HQ in SD)
| Industry | F500 HQs | Revenue |
|---|---|---|
| Utilities | 1 | $1B |
|
||
Price history
-62.9% since first listed11 events — show timeline
- 2026-06-06 Listed $65,000 FSBO.com
- 2025-09-15 Price Changed $55,000 NWIA
- 2025-05-01 Price Changed $60,000 NWIA
- 2024-11-12 Listed $63,000 NWIA
- 2023-11-27 Sold (MLS) $40,000 MARMLS
- 2023-11-11 Pending — MARMLS
- 2023-11-11 Pending — MARMLS
- 2023-08-24 Price Changed $60,000 MARMLS
- 2023-08-16 Listed $85,000 MARMLS
- 2023-08-15 Listed $85,000 MARMLS
- 2023-06-28 Listed $175,000 MARMLS
Cash-flow waterfall
monthlySold comps — $/sqft
last 12 mo · ≤1 miLoading sold comps…