 🏗️ New Construction
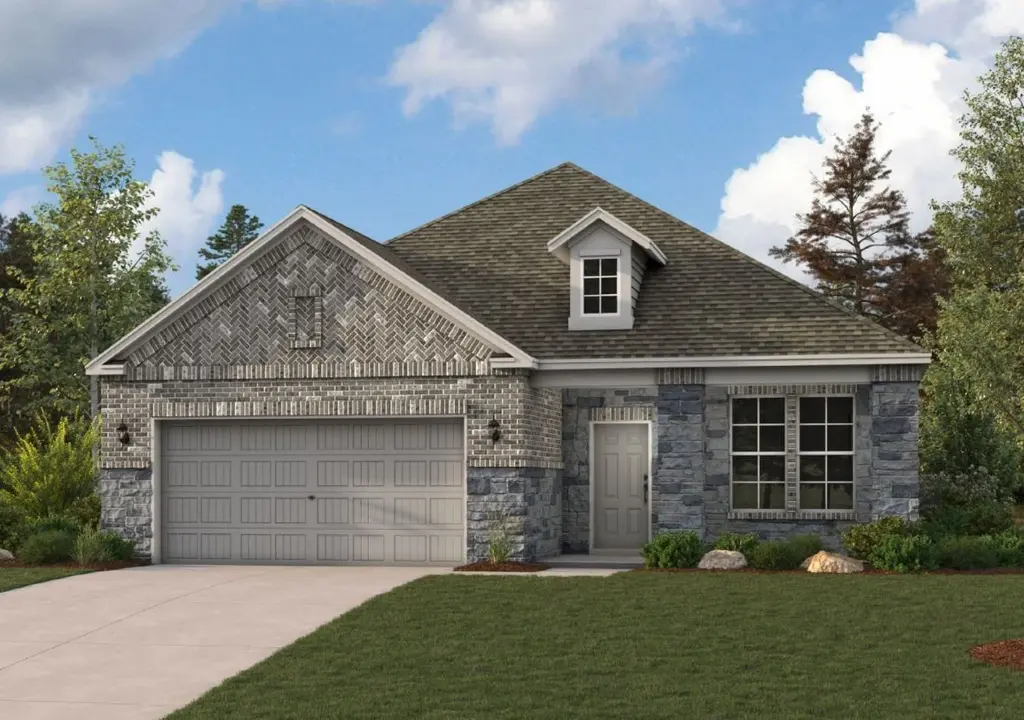
CHAMPLAIN Plan · Texas City, TX
Flood risk No data
- FEMA flood zone
- —
- Chance of flooding over 30 yrs
- —
- Est. flood insurance / yr
- —
Fire risk No data
- Est. fire insurance / yr
- —
Heat risk No data
- Hot days now (above threshold)
- —
- Hot days in 30 yrs
- —
Wind risk No data
- Chance of severe wind over 30 yrs
- —
Air-quality risk No data
- Unhealthy air days now
- —
- Unhealthy air days in 30 yrs
- —
Risk factors via First Street. Map © Google.
Why this score? — see what drove the F grade
The composite is a weighted blend of 9 inputs, each scored 0–100. Each bar is that input's sub-score; the figure is the points it added to the 100-point composite (weight × sub-score).
- ARV discount +7.5/15.0
- Cash flow +6.0/30.0
- Rent growth +3.5/5.0
- Schools +3.5/10.0
- Livability +3.1/5.0
- Condition / age +2.5/5.0
- 1% rule +1.3/10.0
- DSCR +0.4/10.0
- Appreciation +0.0/10.0
$309,990
🖨 Deal sheet 📄 Offer letter ✓ Due diligence
Listing remarks MLS
The single-story Champlain plan boasts an open, inviting central layout, with a spacious great room overlooking a dining area and a kitchen with a center island and built-in pantry. The primary suite is adjacent, showcasing a walk-in closet and private bath with dual vanities and a walk-in shower. Two secondary bedrooms each offer a walk-in closet. You'll also find a private study in this plan. 2-bay garage included. Options: Covered patio
Key facts
- Built-in pantry
- Central layout
- Walk-in closet
Tags
Neighborhood map
What this means for you Summary
Snapshot
- This is a 3-bed/2.0-bath single-family listed at $310k.
Deal economics
- At list price, monthly cash flow is $-701 ($-8k/yr) — negative.
- To cash-flow at today's rent, offer at most $269k (13.3% below list).
- To meet the 1% rule (rent ≥ 1% of price), the offer needs to be $235k (24.2% below list).
- Recommended offer: $235k (24.2% below list) — sets the bar for 1% rule.
Location & tenants
- Location reads 62/100 on livability (#907 in TX) — a middle-class / working-renter tenant base. Strengths: cost of living A+, housing A+; Watch: crime D+, schools F, amenities F.
- Dickinson ISD (suburban): math 39% / reading 40% proficiency, ranked #366 of 826 in TX (top 44%) — families likely to look elsewhere, expect single-tenant / working-renter base with shorter leases; 60% free/reduced lunch — lower-income household profile, screen leases tightly.
- Market conditions: Rents rising (+4.0%/yr); 654 active listings in the ZIP; 8 comparable units currently listed for rent nearby; rentals leasing fast (median 12d on market — plan ~1-2 weeks tenant-placement turnaround); 3,258 units permitted in Galveston County in 2024 (0 in 5+ unit buildings).
- This rent runs 38% of the median local income ($75k/yr) — at the standard rent-burdened threshold; future hikes will face affordability resistance.
Forward outlook
- Local home prices are declining (-3.0%/yr); year-one equity from $3k of loan paydown is wiped out by about $11k of value loss. Plan a longer hold.
- Galveston County population projected at +43% by 2050 — long-run rental-demand tailwind backs the buy-and-hold thesis.
Negotiation context
- It's been on market 400 days — a 12% lower offer ($273k) is reasonable based on typical stale-listing flexibility.
Questions for the listing agent
- What do current leases actually rent for vs. the listed asking? Can we see a recent rent roll and the last 12 months of T-12 income?
- It's been on market 400 days. Have you received any prior offers? Is the seller open to a 24% concession, seller financing, or rate buy-down credit?
- Why hasn't it sold? Are there any deal-killer items the seller is aware of (foundation, flood, title, zoning, code violations)?
- Is there a deadline driving the sale (1031 exchange, divorce, estate, relocation)? That informs how much negotiation room exists.
- Schools are F-rated, which usually means shorter tenancies and higher turnover. Who's the typical renter profile here, and what's been the actual vacancy rate?
- Crime grade is D in this area — have there been break-ins, vandalism, or insurance claims at this property in the last 3 years? What carrier currently insures it and at what premium?
- The area grade is low — what's the realistic commute time and amenity access for the typical tenant pool here? Any planned neighborhood developments (good or bad) we should know about?
- What's the average days-on-market for RENTAL listings here right now (not sales)? A rising rental-DOM trend means longer vacancies and softer asking-rent achievability than the comps imply.
- What's the recent tenant-quality profile in this submarket — average credit score on applications, eviction rate, late-payment / NSF rate, and stable-employment percentage? A property-management company in the area should have these aggregated.
- How much new for-sale + rental construction is in the pipeline within 1–3 miles? Heavy new supply typically softens prices + rents 12–24 months out; constrained supply supports both.
Investment metrics
- 1% rule
- 0.63% ✗
- Cap rate
- 4.02%
- Cash-on-cash
- -8.12%
- DSCR
- 0.64
- GRM
- 13.1
CMA / ARV
- ARV (median comp)
- $370,127
- List price
- $309,990
- Delta
- -16.25%
- Verdict
- UNDERPRICED
- Comps
- 20 within 1.0 mi
Show comp detail 12 sales within ~0.75 mi
| Address | Dist | Beds/Ba | Sqft | Sold | Price | $/sf | Match |
|---|---|---|---|---|---|---|---|
| 13714 Ballast Green Dr | 0.26mi | 3/2.0 | 1,738 (-3%) | 1mo | $344,560 | $198 | 83 |
| 13220 Harbor Point Dr | 0.29mi | 3/2.0 | 1,819 (+2%) | 1mo | $354,990 | $195 | 82 |
| 3026 Banyan Dr | 0.40mi | 3/2.0 | 1,850 (+4%) | 1mo | $345,900 | $187 | 75 |
| 14001 Baikal Manor Dr | 0.45mi | 4/2.0 (+1) | 1,804 (+1%) | 1mo | $321,990 | $178 | 71 |
| 2917 Mariner Island Dr | 0.23mi | 4/2.0 (+1) | 1,922 (+8%) | 1mo | $360,990 | $188 | 71 |
| 13525 Bonita Island Way | 0.42mi | 3/2.0 | 1,900 (+6%) | 1mo | $288,900 | $152 | 69 |
| 13016 Cobalt Cove Ct | 0.35mi | 3/2.5 | 1,963 (+10%) | 0mo | $312,990 | $159 | 65 |
| 13421 Diamond Reef Ln | 0.52mi | 3/2.0 | 1,900 (+6%) | 1mo | $284,900 | $150 | 64 |
| 13926 Baikal Manor Dr | 0.47mi | 3/2.0 | 1,619 (-9%) | 1mo | $305,990 | $189 | 62 |
| 13544 Diamond Reef Ln | 0.60mi | 4/2.0 (+1) | 1,635 (-8%) | 1mo | $284,900 | $174 | 52 |
| 13001 Deep Marine Dr | 0.43mi | 4/3.0 (+1) | 2,053 (+15%) | 1mo | $338,000 | $165 | 45 |
| 13009 Oleander Bay Ln | 0.48mi | 4/3.0 (+1) | 2,040 (+14%) | 0mo | $325,000 | $159 | 45 |
Match score weights: distance 35% · size 25% · config 20% · recency 20%. Top-matched comps best support the ARV.
Projected returns pro-forma
-3.0% appreciation · 3.95% rent growth · sell at horizon
- IRR
- -29.5%
- Equity multiple
- 0.01×
- Total profit
- $-102,346
- Equity at exit
- $55,187
- IRR
- -26.6%
- Equity multiple
- -0.32×
- Total profit
- $-137,013
- Equity at exit
- $32,002
Cash invested: $103,636 (down + closing). Projections, not guarantees.
Landlord ↔ Tenant lean methodology
- Overall (STATE)
- 87 Strongly Landlord-Friendly
- State Texas
- 87 Strongly Landlord-Friendly · R+5
- County
- — inherits STATE
- City
- — inherits STATE
ZIP-level market 77568
- Home prices YoY
- -22.7%
- Rents YoY
- 4.0%
- Active inventory
- 654
- Price-to-rent
- 11.0×
Monthly cashflow live
- Estimated rent
- $2,350 high interval (Pro) →
- Mortgage (P&I)
- −$1,941
- Tax est. 1.5%
- −$463 /mo · $5,552/yr
- Insurance
- −$154
- HOA
- −$0
- Vacancy / Maint / Mgmt
- −$493
- Net cashflow
- $-701
Break-even live
UW: 25.0% down · 7.5% · 30yr · 1.5% tax · 5.0% vac · 8.0% maint · 8.0% mgmt
Financing live
Cash to close
- Down payment
- $92,532
- Closing costs
- $11,104
- Reserves months
- —
- Total cash needed
- —
Loan-product check · same deal, 3 products live
Conventional
25% down · 7.5% · 30yr
- Down + closing
- —
- Monthly P&I
- —
- Monthly cashflow
- —
- DSCR
- —
- Eligible?
- —
Personal DTI + credit; lowest rate.
DSCR
20% down · 8.5% · 30yr
- Down + closing
- —
- Monthly P&I
- —
- Monthly cashflow
- —
- DSCR
- —
- Eligible?
- —
No personal income docs; deal must DSCR.
Hard money
10% down · 12.0% · 12mo
- Down + closing
- —
- Monthly P&I
- —
- Monthly cashflow
- —
- DSCR
- —
- Eligible?
- —
Short-term bridge; refi at stabilization.
Rent comps 8 comps
| Address | Beds | Baths | Sqft | Rent | $/sqft | DOM | Units | Dist |
|---|---|---|---|---|---|---|---|---|
| 13817 Starboard Reach Dr Santa Fe, TX | 3.0–4.0 | 2.0–3.5 | 2268 | $2,445 | $1.08 | 1d | 1 | 0.55mi |
| 12524 Jetty Cv Santa Fe, TX | 3.0 | 2.0 | 1803 | $2,506 | $1.39 | 22d | 1 | 0.93mi |
| 6136 Lago Mar Blvd Dickinson, TX | 3.0 | 2.0 | 1417 | $1,900 | $1.34 | 44d | 1 | 0.95mi |
| 6130 Lago Mar Blvd Texas City, TX | 1.0–3.0 | 1.0–2.0 | 1066 | $2,199 | $2.06 | 4d | 2 | 1.04mi |
| 640 Totem Trail Dr La Marque, TX | 4.0 | 2.5 | 2134 | $2,309 | $1.08 | 12d | 1 | 1.10mi |
| 3301 Gulf Fwy La Marque, TX | 1.0–3.0 | 1.0–2.0 | 991 | $2,430 | $2.45 | 2d | 22 | 1.11mi |
| 2437 Regatta Ln La Marque, TX | 4.0 | 2.0 | 1844 | $2,079 | $1.13 | 5d | 1 | 1.20mi |
| 2301 Starboard Sail Alta Loma, TX | 4.0 | 2.0 | 1856 | $2,181 | $1.18 | 11d | 1 | 1.36mi |
Listing history 14 events
-
2026-06-18days on market $309,990 Active 400 DOM
-
2026-06-17days on market $309,990 Active 399 DOM
-
2026-06-16days on market $309,990 Active 398 DOM
-
2026-06-15days on market $309,990 Active 397 DOM
-
2026-06-13days on market $309,990 Active 395 DOM
-
2026-06-09days on market $309,990 Active 391 DOM
-
2026-06-08days on market $309,990 Active 390 DOM
-
2026-06-07days on market $309,990 Active 389 DOM
-
2026-06-04days on market $309,990 Active 386 DOM
-
2026-06-03days on market $309,990 Active 385 DOM
-
2026-06-02days on market $309,990 Active 384 DOM
-
2026-06-02days on market $309,990 Active 383 DOM
-
2026-05-31days on market $309,990 Active 382 DOM
-
2025-05-14$309,990 Active 443-char remark
Show marketing remark (443 chars)
The single-story Champlain plan boasts an open, inviting central layout, with a spacious great room overlooking a dining area and a kitchen with a center island and built-in pantry. The primary suite is adjacent, showcasing a walk-in closet and private bath with dual vanities and a walk-in shower. Two secondary bedrooms each offer a walk-in closet. You'll also find a private study in this plan. 2-bay garage included. Options: Covered patio
ⓘ Source: listings_history table (triggers on properties + properties_extension) + one-shot
backfill from property_details.listing_events for pre-trigger history.
Nearby sold comps map
Loading sold comps map…
Walkable amenities ~0.75 mi
Loading nearby amenities…
Taxation est. · year 1
- Rental income
- $28,200
- − Mortgage interest
- −$20,733
- − Property taxes
- −$5,552
- − Insurance
- −$1,851
- − Repairs & maintenance
- −$2,256
- − Management
- −$2,256
- − Depreciation
- −$10,767
- Taxable loss
- −$15,215
- Est. tax savings @ 24.0%
- +$3,652
- After-tax cash flow
- $-4,765/yr
For passive investors: Depreciation is non-cash, so a rental often shows a tax loss while cash-flowing — sheltering income. Rental losses are passive: they offset passive income freely, and up to $25,000/yr can offset ordinary (W-2) income if you actively participate and your MAGI is under $100k (phasing out to $0 by $150k); unused losses carry forward. On sale, claimed depreciation is recaptured at up to 25%, and gains may owe capital-gains tax (a 1031 exchange can defer both). Figures are a year-1 estimate at your 24.0% rate — not tax advice; consult a CPA.
Schools (NCES district)
- District
- Dickinson ISD
- NCES district ID
- 4817070
- Math proficiency
- 39% ▼ -11.00%
- Reading proficiency
- 40% ▼ -2.00%
- Median HH income
- $61,318
- Composite
- 35.16/100
- National rank
- #5005
- State rank
- #366 of 826 in TX
Livability — Texas City
- Score
- 62/100
- State rank
- #907
- US rank
- #16268
Category grades
Schools grade is shown separately in the Schools card above.
Census & demographics
- Census place
- Texas City, TX
- County
- Galveston County · 357,330 people
- City population
- 49,936
- Metro
- Houston-The Woodlands-Sugar Land, TX
- Population (ZIP)
- 23,083
- Household income
- $74,694
- Rent vs Own
- Severe rent burden
- 700.0
Population outlook (Galveston County) Hauer SSP2
- Today (2025)
- 390,640 people
- By 2030
- 425,226 · +8.9%
- By 2040
- 493,765 · +26.4%
- By 2050
- 559,698 · +43.3%
- By 2075
- 719,260 · +84.1%
- By 2100
- 819,628 · +109.8%
Race, ethnicity, and origin ACS 2023
- Neighborhood character
- Highly diverse neighborhood (Simpson 0.71)
- Race & ethnicity
- White 37% Hispanic / Latino 29% Black 26% Two or more races 17% Asian 3%
- Hispanic origin (detail)
- Mexican 22% Puerto Rican 1%
- Common ancestry
- Lithuanian 1% Italian 1% Serbian 1%
- Foreign-born
- 8% · Canada
- Languages at home
- 77% English-only · Spanish 21% Tagalog/Filipino 1% Other Asian/Pacific 1%
Political lean MEDSL · Galveston
- 2024 margin
- Strong R (+27.4) · D 35.7% · R 63.1% · Other 1.2%
- 2008→2024 swing
- -7.9pp toward R · 2008: -19.5pp · 2024: -27.4pp
- All cycles
- 2024: R+27.4 2020: R+22.6 2016: R+22.6 2012: R+26.9 2008: R+19.5
Not yet ingested
- Civics
- —
Market trends
- HPI YoY
- ▼ -69.39%
- Current HPI
- 236.0239
- Rent YoY
- ▲ 3.95%
- Metro
- Houston-The Woodlands-Sugar Land, TX
- State GDP YoY
- ▲ 3.95%
- F500 in state
- 110
Industry mix (Fortune 500 HQ in TX)
| Industry | F500 HQs | Revenue |
|---|---|---|
| Energy | 16 | $1,198B |
|
||
| Technology | 5 | $198B |
|
||
| Engineering / Construction | 4 | $72B |
|
||
| Energy Services | 3 | $60B |
|
||
| Utilities | 3 | $41B |
|
||
| Healthcare | 2 | $330B |
|
||
Price history
1 event — show timeline
- 2025-05-14 Listed $309,990 Zillow
Cash-flow waterfall
monthlySold comps — $/sqft
last 12 mo · ≤1 miLoading sold comps…