 48-Plex
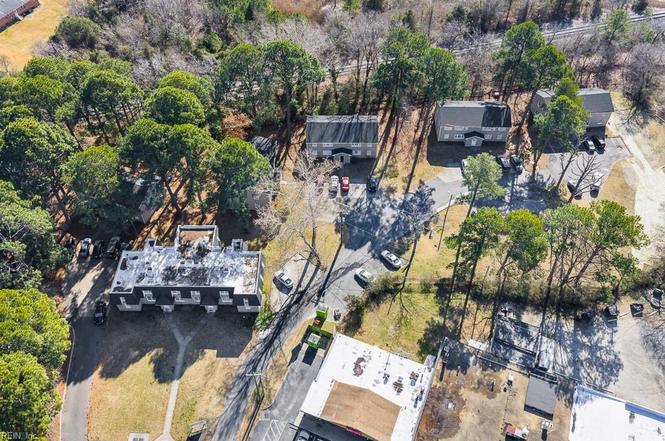
824 Post Ave · Chesapeake, VA
Flood risk No data
- FEMA flood zone
- —
- Chance of flooding over 30 yrs
- —
- Est. flood insurance / yr
- —
Fire risk No data
- Est. fire insurance / yr
- —
Heat risk No data
- Hot days now (above threshold)
- —
- Hot days in 30 yrs
- —
Wind risk No data
- Chance of severe wind over 30 yrs
- —
Air-quality risk No data
- Unhealthy air days now
- —
- Unhealthy air days in 30 yrs
- —
Risk factors via First Street. Map © Google.
Why this score? — see what drove the B grade
The composite is a weighted blend of 9 inputs, each scored 0–100. Each bar is that input's sub-score; the figure is the points it added to the 100-point composite (weight × sub-score).
- Cash flow +30.0/30.0
- DSCR +10.0/10.0
- 1% rule +9.2/10.0
- ARV discount +7.5/15.0
- Schools +5.8/10.0
- Livability +3.5/5.0
- Rent growth +2.5/5.0
- Condition / age +2.5/5.0
- Appreciation +0.0/10.0
$5,625,000
🖨 Deal sheet 📄 Offer letter ✓ Due diligence
Multi-family units
County records classify this as Multi-Family (5+ Unit). Listing-text estimate: 48 units. confirmed
5+ unit building — per-unit beds/baths from public records are typically unavailable; the breakdown below (if shown) is an estimate from the listing text.
Listing remarks
Sunnybrook Apartments (824 Post Ave and 2127 Chesapeake Drive, Chesapeake, VA) is a 48-unit multifamily community in the Hampton Roads metro, positioned for cash flow and upside. The property offers an attractive unit mix of forty-four (44) 2BR/1BA and four (4) 1BR/1BA apartments, supporting broad renter demand. Offered at a $5,625,000 list price, buyers may benefit from assumable financing of approximately $3.5M at 5.7% interest (subject to lender approval), helping reduce interest-rate uncertainty and enhance leverage. The Chesapeake location provides convenient access to retail, dining and commuter routes. A compelling value-add story exists through rent optimization, interior upgrades a
Key facts
- Unit mix
- Retail access
- Dining access
Tags
Property features AI
Finance
- HOA & community: Part of Sunnybrook complex (48 total units)
Exterior
- Parking: Off-street parking (lot)
- Utilities: City water; City sewer; Electric service; Electric water heater
- Home design: 2-story building; Frame construction; Crawl foundation
- Construction: Asphalt shingle roof; Poly skin roof; Frame construction
- Exterior features: Brick siding; Garden-style apartment
Interior
- Kitchen: Electric range; Refrigerator
- Flooring: Laminate
- Heating & cooling: Baseboard heating; Window/wall cooling units
- Interior features: Laminate flooring; On-site laundry room
- Laundry & utility: Washer available; Dryer not provided
Neighborhood map
What this means for you Summary
Snapshot
- This is a 48 × 2.0-bed/1.0-bath units multifamily listed at $5.62M.
Deal economics
- At list price, monthly cash flow is $24k ($291k/yr) — positive. Per door: $504/mo.
- The deal already cash-flows at list — no discount required.
- Meets the 1% rule at list price ($80k rent vs $5.62M).
- Recommended offer: $4.95M (12.0% below list) — sets the bar for market timing.
- Cap rate 11.5% vs local median 3.7% in Chesapeake — top-decile yield for the area; either an underpriced asset or a hidden risk that comps aren't pricing in. Stress-test before assuming the spread holds.
Location & tenants
- Location reads 70/100 on livability (#236 in VA) — a middle-class / working-renter tenant base. Strengths: employment A+, housing A+; Watch: crime C-, cost of living C-, amenities F.
- Chesapeake City Public School District (suburban): math 58% / reading 74% proficiency, ranked #31 of 131 in VA (top 24%) — acceptable for families but not a draw, mixed tenant base, ~2y average lease.
- Zoned schools: Rena B. Wright Primary (271 students, 96% FRL); Oscar F. Smith High (math 63% / reading 75%, grade B, #170 of 319 statewide, top 55%, 2,291 students, 70% FRL) — zoned schools average 83% FRL vs 28% district-wide (55 pts higher); higher-poverty schools than district average — tighter screening recommended.
- Market conditions: 116 active listings in the ZIP; 597 units permitted in Chesapeake city in 2024 (0 in 5+ unit buildings).
- At $79,854/mo this rent would consume 1680% of the median local household income ($57k/yr) (locally 1301% of renters already pay >50% of income on rent) — very limited rent-growth headroom before tenants either downsize or default.
Forward outlook
- Local home prices are declining (-3.0%/yr); year-one equity from $39k of loan paydown is wiped out by about $169k of value loss. Plan a longer hold.
- Chesapeake County population projected at +21% by 2050 — long-run rental-demand tailwind backs the buy-and-hold thesis.
- At projected returns (-3.0% appreciation + 3.0% rent growth), your $1.57M cash investment doubles in ~7 years — after that, you're playing with house money.
Negotiation context
- It's been on market 125 days — a 12% lower offer ($4.95M) is reasonable based on typical stale-listing flexibility.
Questions for the listing agent
- It's been on market 125 days. Have you received any prior offers? Is the seller open to a 12% concession, seller financing, or rate buy-down credit?
- Can we see the unit-by-unit rent roll, current vacancy, and any below-market leases? What's the average tenancy length?
- What capital expenditures (roof, boiler, parking lot, exteriors) have been made in the last 5 years, and what's planned in the next 2?
- Built in 1970 — when were the roof, HVAC, electrical panel, plumbing, and water heater last replaced?
- Why hasn't it sold? Are there any deal-killer items the seller is aware of (foundation, flood, title, zoning, code violations)?
- Is there a deadline driving the sale (1031 exchange, divorce, estate, relocation)? That informs how much negotiation room exists.
- Schools are A-rated — typically a magnet for longer-tenancy family renters. What's the average tenant stay here, and is there a school-zone premium baked into asking?
- What's the average days-on-market for RENTAL listings here right now (not sales)? A rising rental-DOM trend means longer vacancies and softer asking-rent achievability than the comps imply.
- What's the recent tenant-quality profile in this submarket — average credit score on applications, eviction rate, late-payment / NSF rate, and stable-employment percentage? A property-management company in the area should have these aggregated.
- How much new apartment / multifamily construction is in the pipeline within 1–3 miles? Heavy new supply (>2% of stock underway) typically softens rents 12–24 months out; light construction supports rent growth.
Investment metrics
- 1% rule
- 1.42% ✓
- Cap rate
- 11.46%
- Cash-on-cash
- 18.45%
- DSCR
- 1.82
- GRM
- 5.9
CMA / ARV
No comps found within radius.
Projected returns pro-forma
-3.0% appreciation · 3.0% rent growth · sell at horizon
- IRR
- 10.2%
- Equity multiple
- 1.40×
- Total profit
- $631,760
- Equity at exit
- $838,706
- IRR
- 19.3%
- Equity multiple
- 2.61×
- Total profit
- $2,540,652
- Equity at exit
- $486,347
Cash invested: $1,575,000 (down + closing). Projections, not guarantees.
Landlord ↔ Tenant lean methodology
- Overall (STATE)
- 55 Moderately Landlord-Leaning
- State Virginia
- 55 Moderately Landlord-Leaning · D+2
- County
- — inherits STATE
- City
- — inherits STATE
ZIP-level market 23324
- Home prices YoY
- -17.3%
- Active inventory
- 116
- Price-to-rent
- 281.8×
Monthly cashflow live
- Estimated rent
- $79,854 high interval (Pro) →
- Mortgage (P&I)
- −$29,498
- Tax est. 1.5%
- −$7,031 /mo · $84,375/yr
- Insurance
- −$2,344
- HOA
- −$0
- Vacancy / Maint / Mgmt
- −$16,769
- Net cashflow
- $24,212
Break-even live
48-unit breakdown (identical units grouped — click to expand)
| Units | Beds | Baths | Est. rent |
|---|---|---|---|
| 48× units | 2.0 | 1 | $79,872 |
| #1 | 2.0 | 1 | $1,664 |
| #2 | 2.0 | 1 | $1,664 |
| #3 | 2.0 | 1 | $1,664 |
| #4 | 2.0 | 1 | $1,664 |
| #5 | 2.0 | 1 | $1,664 |
| #6 | 2.0 | 1 | $1,664 |
| #7 | 2.0 | 1 | $1,664 |
| #8 | 2.0 | 1 | $1,664 |
| #9 | 2.0 | 1 | $1,664 |
| #10 | 2.0 | 1 | $1,664 |
| #11 | 2.0 | 1 | $1,664 |
| #12 | 2.0 | 1 | $1,664 |
| #13 | 2.0 | 1 | $1,664 |
| #14 | 2.0 | 1 | $1,664 |
| #15 | 2.0 | 1 | $1,664 |
| #16 | 2.0 | 1 | $1,664 |
| #17 | 2.0 | 1 | $1,664 |
| #18 | 2.0 | 1 | $1,664 |
| #19 | 2.0 | 1 | $1,664 |
| #20 | 2.0 | 1 | $1,664 |
| #21 | 2.0 | 1 | $1,664 |
| #22 | 2.0 | 1 | $1,664 |
| #23 | 2.0 | 1 | $1,664 |
| #24 | 2.0 | 1 | $1,664 |
| #25 | 2.0 | 1 | $1,664 |
| #26 | 2.0 | 1 | $1,664 |
| #27 | 2.0 | 1 | $1,664 |
| #28 | 2.0 | 1 | $1,664 |
| #29 | 2.0 | 1 | $1,664 |
| #30 | 2.0 | 1 | $1,664 |
| #31 | 2.0 | 1 | $1,664 |
| #32 | 2.0 | 1 | $1,664 |
| #33 | 2.0 | 1 | $1,664 |
| #34 | 2.0 | 1 | $1,664 |
| #35 | 2.0 | 1 | $1,664 |
| #36 | 2.0 | 1 | $1,664 |
| #37 | 2.0 | 1 | $1,664 |
| #38 | 2.0 | 1 | $1,664 |
| #39 | 2.0 | 1 | $1,664 |
| #40 | 2.0 | 1 | $1,664 |
| #41 | 2.0 | 1 | $1,664 |
| #42 | 2.0 | 1 | $1,664 |
| #43 | 2.0 | 1 | $1,664 |
| #44 | 2.0 | 1 | $1,664 |
| #45 | 2.0 | 1 | $1,664 |
| #46 | 2.0 | 1 | $1,664 |
| #47 | 2.0 | 1 | $1,664 |
| #48 | 2.0 | 1 | $1,664 |
| Total (48 units) | $79,854 | ||
UW: 25.0% down · 7.5% · 30yr · 1.5% tax · 5.0% vac · 8.0% maint · 8.0% mgmt
Financing live
Cash to close
- Down payment
- $1,406,250
- Closing costs
- $168,750
- Reserves months
- —
- Total cash needed
- —
Loan-product check · same deal, 3 products live
Conventional
25% down · 7.5% · 30yr
- Down + closing
- —
- Monthly P&I
- —
- Monthly cashflow
- —
- DSCR
- —
- Eligible?
- —
Personal DTI + credit; lowest rate.
DSCR
20% down · 8.5% · 30yr
- Down + closing
- —
- Monthly P&I
- —
- Monthly cashflow
- —
- DSCR
- —
- Eligible?
- —
No personal income docs; deal must DSCR.
Hard money
10% down · 12.0% · 12mo
- Down + closing
- —
- Monthly P&I
- —
- Monthly cashflow
- —
- DSCR
- —
- Eligible?
- —
Short-term bridge; refi at stabilization.
Listing history 13 events
-
2026-06-18days on market $5,625,000 Active 125 DOM
-
2026-06-17days on market $5,625,000 Active 124 DOM
-
2026-06-16days on market $5,625,000 Active 123 DOM
-
2026-06-15days on market $5,625,000 Active 122 DOM
-
2026-06-13days on market $5,625,000 Active 120 DOM
-
2026-06-09days on market $5,625,000 Active 116 DOM
-
2026-06-08days on market $5,625,000 Active 115 DOM
-
2026-06-07days on market $5,625,000 Active 114 DOM
-
2026-06-03days on market $5,625,000 Active 110 DOM
-
2026-06-02days on market $5,625,000 Active 109 DOM
-
2026-06-01days on market $5,625,000 Active 108 DOM
-
2026-05-31days on market $5,625,000 Active 107 DOM
-
2026-02-13$5,625,000 Active
ⓘ Source: listings_history table (triggers on properties + properties_extension) + one-shot
backfill from property_details.listing_events for pre-trigger history.
Nearby sold comps map
Loading sold comps map…
Walkable amenities ~0.75 mi
Loading nearby amenities…
Taxation est. · year 1
- Rental income
- $958,248
- − Mortgage interest
- −$315,087
- − Property taxes
- −$84,375
- − Insurance
- −$28,125
- − Repairs & maintenance
- −$76,660
- − Management
- −$76,660
- − Depreciation
- −$163,636
- Taxable income
- $213,705
- Est. tax owed @ 24.0%
- −$51,289
- After-tax cash flow
- $239,249/yr
For passive investors: Depreciation is non-cash, so a rental often shows a tax loss while cash-flowing — sheltering income. Rental losses are passive: they offset passive income freely, and up to $25,000/yr can offset ordinary (W-2) income if you actively participate and your MAGI is under $100k (phasing out to $0 by $150k); unused losses carry forward. On sale, claimed depreciation is recaptured at up to 25%, and gains may owe capital-gains tax (a 1031 exchange can defer both). Figures are a year-1 estimate at your 24.0% rate — not tax advice; consult a CPA.
Schools (NCES district)
- District
- Chesapeake City Public School District
- NCES district ID
- 5100810
- Math proficiency
- 58% ▼ -29.00%
- Reading proficiency
- 74% ▼ -7.00%
- Median HH income
- $69,356
- Composite
- 57.84/100
- National rank
- #1047
- State rank
- #31 of 131 in VA
Livability — Chesapeake
- Score
- 70/100
- State rank
- #236
- US rank
- #7942
Category grades
Schools grade is shown separately in the Schools card above.
Census & demographics
- Census place
- Chesapeake, VA
- County
- Chesapeake City · 253,091 people
- City population
- 253,091
- Metro
- Virginia Beach-Norfolk-Newport News, VA-NC
- Population (ZIP)
- 24,670
- Household income
- $57,045
- Rent vs Own
- Severe rent burden
- 1301.0
Population outlook (Chesapeake County) Hauer SSP2
- Today (2025)
- 263,804 people
- By 2030
- 276,798 · +4.9%
- By 2040
- 299,906 · +13.7%
- By 2050
- 318,284 · +20.7%
- By 2075
- 362,137 · +37.3%
- By 2100
- 372,225 · +41.1%
Race, ethnicity, and origin ACS 2023
- Neighborhood character
- Diverse neighborhood (Simpson 0.59)
- Race & ethnicity
- Black 58% White 27% Two or more races 9% Hispanic / Latino 9% Asian 1%
- Hispanic origin (detail)
- Mexican 3% Puerto Rican 4%
- Common ancestry
- Slovak 2% Italian 2% Romanian 1%
- Foreign-born
- 4% · Canada
- Languages at home
- 92% English-only · Spanish 6% French/Haitian/Cajun 1% Other Indo-European 1%
Political lean MEDSL · Chesapeake
- 2024 margin
- Toss-up / Even · D 51.3% · R 47.5% · Other 1.2%
- 2008→2024 swing
- +2.5pp toward D · 2008: 1.3pp · 2024: 3.8pp
- All cycles
- 2024: D+3.8 2020: D+6.5 2016: R+1.3 2012: D+1.1 2008: D+1.3
Not yet ingested
- Civics
- —
Market trends
- HPI YoY
- ▼ -66.73%
- Current HPI
- 319.2653
- Rent YoY
- —
- Metro
- Virginia Beach-Norfolk-Newport News, VA-NC
- State GDP YoY
- ▲ 2.40%
- F500 in state
- 50
Industry mix (Fortune 500 HQ in VA)
| Industry | F500 HQs | Revenue |
|---|---|---|
| Aerospace / Defense | 4 | $236B |
|
||
| Technology / Defense | 3 | $32B |
|
||
| Financial Services | 2 | $176B |
|
||
| Utilities | 2 | $27B |
|
||
| Insurance | 2 | $25B |
|
||
| Technology | 2 | $15B |
|
||
Price history
1 event — show timeline
- 2026-02-13 Listed $5,625,000 REINMLS
Cash-flow waterfall
monthlySold comps — $/sqft
last 12 mo · ≤1 miLoading sold comps…