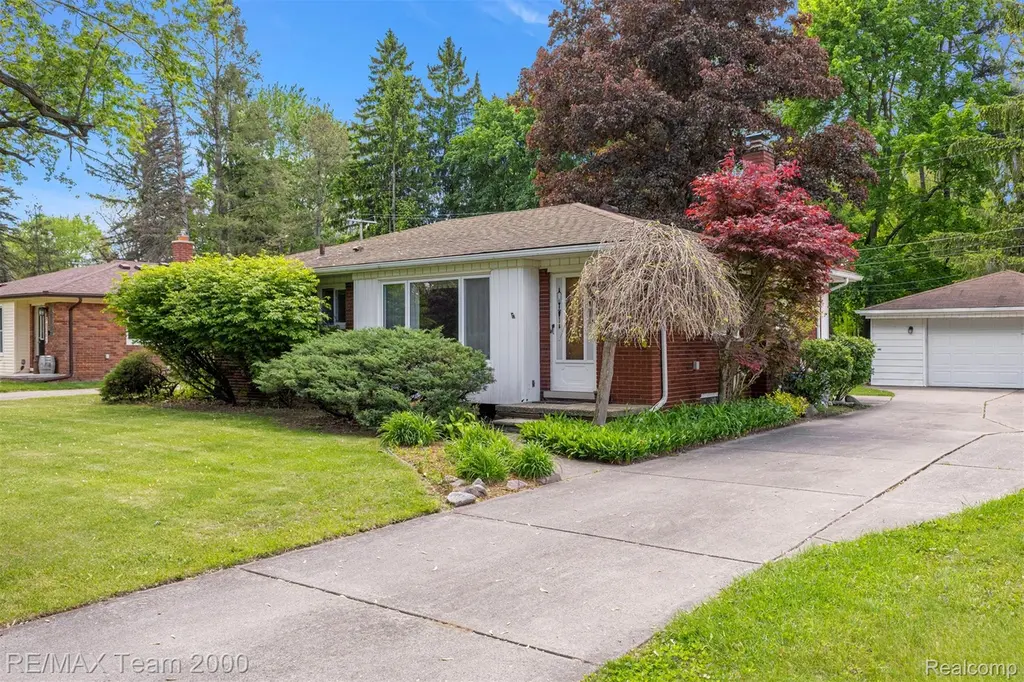
27143 Westland Rd · Livonia, MI
Flood risk 1/10 · Minimal
- FEMA flood zone
- X (unshaded)
- Chance of flooding over 30 yrs
- 0.0%
- Est. flood insurance / yr
- $473 – $860
Fire risk 1/10 · Minimal
- Est. fire insurance / yr
- $784 – $1,456
Heat risk 3/10 · Minor
- Hot days now (above 98°F)
- 7 days/yr
- Hot days in 30 yrs
- 14 days/yr
Wind risk 2/10 · Minimal
- Chance of severe wind over 30 yrs
- —
Air-quality risk 3/10 · Minor
- Unhealthy air days now
- 2 days/yr
- Unhealthy air days in 30 yrs
- 3 days/yr
Risk factors via First Street. Map © Google.
Why this score? — see what drove the F grade
The composite is a weighted blend of 9 inputs, each scored 0–100. Each bar is that input's sub-score; the figure is the points it added to the 100-point composite (weight × sub-score).
- Cash flow +12.1/30.0
- ARV discount +6.3/15.0
- Livability +3.9/5.0
- DSCR +3.6/10.0
- Rent growth +2.5/5.0
- Condition / age +2.5/5.0
- 1% rule +2.4/10.0
- Schools +1.4/10.0
- Appreciation +0.0/10.0
$199,900
🖨 Deal sheet (PDF) 📄 Offer letter ✓ Due diligence
Listing remarks MLS
MULTIPLE OFFERS RECEIVED, HIGHEST AND BEST DUE WEDNESDAY 5/20 2PM. 3 bedroom, 2 bath brick ranch with full finished basement in Beautiful winding streets section of Redford. Living room with hardwood floors, dining section, kitchen with all appliances included, 3rd bedroom has walk thru door to basement stairway, finished basement with full bath. Beautiful deep lot and 2 1/2 car garage. Make this house your own!
Key facts
- Deep lot
- Hardwood floors
- Brick ranch
Tags
Property features AI
Exterior
- Parking: Detached garage (2 car) with garage facing front
- Utilities: Public water; Public sewer; Cable available
- Home design: Single-family residence; One story; Ground-level entry with steps; Brick exterior
- Construction: Brick construction; Block foundation; Above-grade finished area and additional finished space below grade
- Exterior features: Paved road; Lot approximately 70 x 200 (0.33 acre)
Interior
- Kitchen: Dishwasher; Free-standing gas oven; Free-standing refrigerator; Microwave
- Bathrooms: 2 full bathrooms
- Heating & cooling: Forced air heating (natural gas); No central air
- Interior features: Gas water heater; Dishwasher; Dryer; Free-standing gas oven; Free-standing refrigerator; Microwave; Washer; Full, partially finished basement
- Laundry & utility: Laundry room; Washer and dryer; Gas water heater
Neighborhood map
What this means for you Summary
Snapshot
- This is a 3-bed/1.0-bath single-family listed at $200k.
Deal economics
- At list price, monthly cash flow is $-43 ($-518/yr) — negative.
- To cash-flow at today's rent, offer at most $192k (3.8% below list).
- To meet the 1% rule (rent ≥ 1% of price), the offer needs to be $148k (26.1% below list).
- Recommended offer: $148k (26.1% below list) — sets the bar for 1% rule.
- Cap rate 6.0% vs local median 4.9% in Livonia — meaningfully above typical; check what's discounted (condition, days-on-market, listing class) to confirm the premium yield is real.
Location & tenants
- Location reads 77/100 on livability (#116 in MI, #2,784 nationally) — a middle-class / working-renter tenant base. Strengths: employment A+, cost of living A+, housing A+; Watch: amenities D, health & safety D, commute F.
- Redford Union Schools District No. 1 (suburban): math 8% / reading 23% proficiency, ranked #489 of 540 in MI (top 91%) — low school quality limits family demand, transient renter base, plan for 1-2y turnover; 66% free/reduced lunch — lower-income household profile, screen leases tightly.
- Market conditions: 86 active listings in the ZIP; 8 comparable units currently listed for rent nearby; rentals at typical pace (median 25d on market — plan ~3-4 weeks tenant-placement turnaround); 2,639 units permitted in Wayne County in 2024 (1,216 in 5+ unit buildings).
Forward outlook
- Local home prices are declining (-3.0%/yr); year-one equity from $1k of loan paydown is wiped out by about $6k of value loss. Plan a longer hold.
- Wayne County population projected at -17% by 2050 — secular population decline; favor cash flow + early exit over multi-decade hold.
Negotiation context
- Only 4 days on market — expect competitive offers; lowballing is unlikely to land.
- 2 sale attempts with the ask held roughly flat each time — persistent listings suggest the price (not the market) is what's stuck; bring a comps-based counter.
Risks & watch-outs
- Watch-outs: built in 1954 — expect roof / HVAC / electrical / plumbing capex.
Questions for the listing agent
- What do current leases actually rent for vs. the listed asking? Can we see a recent rent roll and the last 12 months of T-12 income?
- Built in 1954 — when were the roof, HVAC, electrical panel, plumbing, and water heater last replaced?
- Is there a deadline driving the sale (1031 exchange, divorce, estate, relocation)? That informs how much negotiation room exists.
- Schools are B-rated — typically a magnet for longer-tenancy family renters. What's the average tenant stay here, and is there a school-zone premium baked into asking?
- The area grade is low — what's the realistic commute time and amenity access for the typical tenant pool here? Any planned neighborhood developments (good or bad) we should know about?
- What's the average days-on-market for RENTAL listings here right now (not sales)? A rising rental-DOM trend means longer vacancies and softer asking-rent achievability than the comps imply.
- What's the recent tenant-quality profile in this submarket — average credit score on applications, eviction rate, late-payment / NSF rate, and stable-employment percentage? A property-management company in the area should have these aggregated.
- How much new for-sale + rental construction is in the pipeline within 1–3 miles? Heavy new supply typically softens prices + rents 12–24 months out; constrained supply supports both.
Investment metrics
- 1% rule
- 0.74% ✗
- Cap rate
- 6.03%
- Cash-on-cash
- -0.93%
- DSCR
- 0.96
- GRM
- 11.3
CMA / ARV
- ARV (on-the-fly)
- $194,877
- Comps found
- 12
Show comp detail 12 sales within ~0.75 mi
| Address | Dist | Beds/Ba | Sqft | Sold | Price | $/sf | Match |
|---|---|---|---|---|---|---|---|
| 16544 Delaware Ave | 0.54mi | 3/1.5 | 1,146 (+4%) | 1mo | $203,000 | $177 | 65 |
| 16635 Macarthur | 0.59mi | 3/1.0 | 1,148 (+4%) | 1mo | $185,000 | $161 | 65 |
| 18653 Indian | 0.69mi | 3/1.0 | 1,071 (-3%) | 1mo | $151,000 | $141 | 62 |
| 17150 Wakenden | 0.65mi | 3/1.5 | 1,120 (+2%) | 4mo | $210,000 | $188 | 62 |
| 18434 Fox | 0.59mi | 3/1.0 | 1,071 (-3%) | 9mo | $185,000 | $173 | 60 |
| 17694 Fox | 0.39mi | 3/1.0 | 970 (-12%) | 7mo | $179,500 | $185 | 56 |
| 18070 Floral St | 0.56mi | 3/1.0 | 1,225 (+11%) | 5mo | $230,000 | $188 | 51 |
| 18400 Delaware Ave | 0.61mi | 3/1.0 | 981 (-11%) | 6mo | $175,000 | $178 | 48 |
| 17052 Kinloch St | 0.61mi | 2/1.0 (-1) | 1,184 (+8%) | 7mo | $172,000 | $145 | 48 |
| 16887 Wakenden | 0.67mi | 3/1.0 | 1,197 (+9%) | 9mo | $190,000 | $159 | 47 |
| 27220 Puritan St | 0.62mi | 2/2.0 (-1) | 1,219 (+11%) | 6mo | $175,000 | $144 | 40 |
| 18632 Lexington | 0.73mi | 3/1.5 | 966 (-12%) | 7mo | $183,000 | $189 | 38 |
Match score weights: distance 35% · size 25% · config 20% · recency 20%. Top-matched comps best support the ARV.
Projected returns pro-forma
-3.0% appreciation · 3.0% rent growth · sell at horizon
- IRR
- -17.9%
- Equity multiple
- 0.37×
- Total profit
- $-35,226
- Equity at exit
- $29,806
- IRR
- -10.1%
- Equity multiple
- 0.38×
- Total profit
- $-34,554
- Equity at exit
- $17,284
Cash invested: $55,972 (down + closing). Projections, not guarantees.
Landlord ↔ Tenant lean methodology
- Overall (STATE)
- 62 Landlord-Friendly
- State Michigan
- 62 Landlord-Friendly · EVEN
- County
- — inherits STATE
- City
- — inherits STATE
ZIP-level market 48240
- Active inventory
- 86
- Price-to-rent
- 11.3×
Monthly cashflow live
- Estimated rent
- $1,477 high interval (Pro) →
- Mortgage (P&I)
- −$1,048
- Tax from tax record
- −$79 /mo · $945/yr
- Insurance
- −$83
- HOA
- −$0
- Vacancy / Maint / Mgmt
- −$310
- Net cashflow
- $-43
Break-even live
Sensitivity live
| Price | -10% $70 | -5% $13 | +0% $-43 | +5% $-100 | +10% $-156 |
|---|---|---|---|---|---|
| Rent | -10% $-160 | -5% $-102 | +0% $-43 | +5% $15 | +10% $74 |
| Rate | -1.0pp $57 | -0.5pp $8 | base $-43 | +0.5pp $-95 | +1.0pp $-148 |
UW: 25.0% down · 7.5% · 30yr · 1.5% tax · 5.0% vac · 8.0% maint · 8.0% mgmt
Financing live
Cash to close
- Down payment
- $49,975
- Closing costs
- $5,997
- Reserves months
- —
- Total cash needed
- —
Loan-product check · same deal, 3 products live
Conventional
25% down · 7.5% · 30yr
- Down + closing
- —
- Monthly P&I
- —
- Monthly cashflow
- —
- DSCR
- —
- Eligible?
- —
Personal DTI + credit; lowest rate.
DSCR
20% down · 8.5% · 30yr
- Down + closing
- —
- Monthly P&I
- —
- Monthly cashflow
- —
- DSCR
- —
- Eligible?
- —
No personal income docs; deal must DSCR.
Hard money
10% down · 12.0% · 12mo
- Down + closing
- —
- Monthly P&I
- —
- Monthly cashflow
- —
- DSCR
- —
- Eligible?
- —
Short-term bridge; refi at stabilization.
Rent comps 8 comps
| Address | Beds | Baths | Sqft | Rent | $/sqft | DOM | Units | Dist |
|---|---|---|---|---|---|---|---|---|
| 18405 Gillman St Livonia, MI | 3.0 | 2.0 | 1014 | $1,950 | $1.92 | 5d | 1 | 0.77mi |
| 25822 W 6 Mile Rd Redford Township, MI | 2.0 | 2.0 | 1100 | $1,100 | $1.00 | 25d | 1 | 0.82mi |
| 26539 Clarita Redford, MI | 3.0 | 1.5 | 931 | $1,875 | $2.01 | 25d | 1 | 0.84mi |
| 19354 Seminole Redford, MI | 3.0 | 1.0 | 1050 | $1,450 | $1.38 | 25d | 1 | 1.07mi |
| 29200 Dardanella St Livonia, MI | 1.0–2.0 | 1.0 | 825 | $1,230 | $1.49 | 0d | 5 | 1.34mi |
| 17324 Salem St Detroit, MI | 2.0 | 1.0 | 989 | $1,200 | $1.21 | 25d | 1 | 1.44mi |
| 16896 Salem St Detroit, MI | 3.0 | 1.0 | 1150 | $1,300 | $1.13 | 44d | 1 | 1.45mi |
| 28940 Lancaster St Livonia, MI | 1.0–2.0 | 1.0 | 800 | $1,365 | $1.71 | 25d | 5 | 1.50mi |
Listing history 4 events
-
2026-05-20status Pending 415-char remark
Show marketing remark (415 chars)
MULTIPLE OFFERS RECEIVED, HIGHEST AND BEST DUE WEDNESDAY 5/20 2PM. 3 bedroom, 2 bath brick ranch with full finished basement in Beautiful winding streets section of Redford. Living room with hardwood floors, dining section, kitchen with all appliances included, 3rd bedroom has walk thru door to basement stairway, finished basement with full bath. Beautiful deep lot and 2 1/2 car garage. Make this house your own!
-
2026-05-20status Pending
Show marketing remark (415 chars)
MULTIPLE OFFERS RECEIVED, HIGHEST AND BEST DUE WEDNESDAY 5/20 2PM. 3 bedroom, 2 bath brick ranch with full finished basement in Beautiful winding streets section of Redford. Living room with hardwood floors, dining section, kitchen with all appliances included, 3rd bedroom has walk thru door to basement stairway, finished basement with full bath. Beautiful deep lot and 2 1/2 car garage. Make this house your own!
-
2026-05-16$199,900 Active 415-char remark
Show marketing remark (415 chars)
MULTIPLE OFFERS RECEIVED, HIGHEST AND BEST DUE WEDNESDAY 5/20 2PM. 3 bedroom, 2 bath brick ranch with full finished basement in Beautiful winding streets section of Redford. Living room with hardwood floors, dining section, kitchen with all appliances included, 3rd bedroom has walk thru door to basement stairway, finished basement with full bath. Beautiful deep lot and 2 1/2 car garage. Make this house your own!
-
2026-05-16$199,900 Active
Show marketing remark (415 chars)
MULTIPLE OFFERS RECEIVED, HIGHEST AND BEST DUE WEDNESDAY 5/20 2PM. 3 bedroom, 2 bath brick ranch with full finished basement in Beautiful winding streets section of Redford. Living room with hardwood floors, dining section, kitchen with all appliances included, 3rd bedroom has walk thru door to basement stairway, finished basement with full bath. Beautiful deep lot and 2 1/2 car garage. Make this house your own!
ⓘ Source: listings_history table (triggers on properties + properties_extension) + one-shot
backfill from property_details.listing_events for pre-trigger history.
Tax reassessment forecast MI · Partial reset (capped growth)
- Current annual tax
- $945 · $79/mo
- Projected year-2 tax
- $2,012 · $168/mo
- Expected delta
- +$1,067/yr (+$89/mo · 112.8%)
ⓘ Screening estimate from a state-policy table — verify with the county assessor before closing.
Climate risk First Street
- Flood 1/10 Low FEMA zone X (unshaded) · 0% chance over 30 yrs
- Wildfire 1/10 Low
- Heat 3/10 Moderate 7 d/yr ≥98°F today · 14 d/yr by 30 yrs out
- Wind 2/10 Low
- Air quality 3/10 Moderate 2 unhealthy d/yr today · 3 by 30 yrs out
Nearby sold comps map
Loading sold comps map…
Walkable amenities ~0.75 mi
Loading nearby amenities…
Taxation est. · year 1
- Rental income
- $17,729
- − Mortgage interest
- −$11,198
- − Property taxes
- −$945
- − Insurance
- −$1,000
- − Repairs & maintenance
- −$1,418
- − Management
- −$1,418
- − Depreciation
- −$5,815
- Taxable loss
- −$4,065
- Est. tax savings @ 24.0%
- +$976
- After-tax cash flow
- $457/yr
For passive investors: Depreciation is non-cash, so a rental often shows a tax loss while cash-flowing — sheltering income. Rental losses are passive: they offset passive income freely, and up to $25,000/yr can offset ordinary (W-2) income if you actively participate and your MAGI is under $100k (phasing out to $0 by $150k); unused losses carry forward. On sale, claimed depreciation is recaptured at up to 25%, and gains may owe capital-gains tax (a 1031 exchange can defer both). Figures are a year-1 estimate at your 24.0% rate — not tax advice; consult a CPA.
Schools (NCES district)
- District
- Redford Union Schools District No. 1
- NCES district ID
- 2629460
- Math proficiency
- 8% ▼ -6.00%
- Reading proficiency
- 23% ▬ 0.00%
- Median HH income
- $49,778
- Composite
- 14.1/100
- National rank
- #9460
- State rank
- #489 of 540 in MI
Livability — Livonia
- Score
- 77/100
- State rank
- #116
- US rank
- #2784
Category grades
Schools grade is shown separately in the Schools card above.
Census & demographics
- City population
- 56,806
- Population (ZIP)
- 17,097
Population outlook (Wayne County) Hauer SSP2
- Today (2025)
- 1,675,273 people
- By 2030
- 1,620,300 · -3.3%
- By 2040
- 1,502,341 · -10.3%
- By 2050
- 1,384,039 · -17.4%
- By 2075
- 1,124,592 · -32.9%
- By 2100
- 881,193 · -47.4%
Race, ethnicity, and origin ACS 2023
- Neighborhood character
- Diverse neighborhood (Simpson 0.64)
- Race & ethnicity
- White 45% Black 40% Two or more races 10% Hispanic / Latino 6%
- Hispanic origin (detail)
- Mexican 6%
- Common ancestry
- Romanian 5% Lithuanian 3% Slovak 2%
- Foreign-born
- 4% · Canada
- Languages at home
- 93% English-only · Spanish 5% Chinese 1%
Political lean MEDSL · Wayne
- 2024 margin
- Strong D (+29.0) · D 62.7% · R 33.7% · Other 3.6%
- 2008→2024 swing
- -20.5pp toward R · 2008: 49.5pp · 2024: 29.0pp
- All cycles
- 2024: D+29.0 2020: D+38.1 2016: D+37.3 2012: D+46.9 2008: D+49.5
Not yet ingested
- Civics
- —
Market trends
- HPI YoY
- ▼ -177.98%
- Current HPI
- 236.2958
- Rent YoY
- —
- Metro
- —
- State GDP YoY
- ▲ 1.37%
- F500 in state
- 28
Industry mix (Fortune 500 HQ in MI)
| Industry | F500 HQs | Revenue |
|---|---|---|
| Automotive Parts | 3 | $48B |
|
||
| Automotive | 2 | $372B |
|
||
| Chemicals | 1 | $45B |
|
||
| Automotive Retail | 1 | $29B |
|
||
| Healthcare / Medical Devices | 1 | $23B |
|
||
| Automotive Technology | 1 | $20B |
|
||
Price history
+0.0% since first listed4 events — show timeline
- 2026-05-20 Pending — MiRealSource-MiMLS
- 2026-05-20 Pending — REALCOMP
- 2026-05-16 Listed $199,900 REALCOMP
- 2026-05-16 Listed $199,900 MiRealSource-MiMLS
Property tax history
-5.6%/yrLatest (2025): $945 · -59.5% YoY. Source: county tax records.
Cash-flow waterfall
monthlySold comps — $/sqft
last 12 mo · ≤1 miLoading sold comps…