210 Avenue H Unit A And B · Greenwood, MS
Flood risk No data
- FEMA flood zone
- —
- Chance of flooding over 30 yrs
- —
- Est. flood insurance / yr
- —
Fire risk No data
- Est. fire insurance / yr
- —
Heat risk 7/10 · Major
- Hot days now (above threshold)
- 7 days/yr
- Hot days in 30 yrs
- 21 days/yr
Wind risk No data
- Chance of severe wind over 30 yrs
- —
Air-quality risk 1/10 · Minimal
- Unhealthy air days now
- 0 days/yr
- Unhealthy air days in 30 yrs
- 0 days/yr
Risk factors via First Street. Map © Google.
Why this score? — see what drove the D grade
The composite is a weighted blend of 9 inputs, each scored 0–100. Each bar is that input's sub-score; the figure is the points it added to the 100-point composite (weight × sub-score).
- Cash flow +15.0/30.0
- ARV discount +7.5/15.0
- 1% rule +5.0/10.0
- DSCR +5.0/10.0
- Schools +5.0/10.0
- Livability +3.6/5.0
- Rent growth +2.5/5.0
- Condition / age +1.0/5.0
- Appreciation +0.0/10.0
$25,000
🖨 Deal sheet (PDF) 📄 Offer letter ✓ Due diligence
Listing remarks MLS
Investor Special! 4 sidebrick Duplex with 2BR1BTH on each side and a 1/1 brick Unit on same parcel . Sold AS-IS with long-term tenants. Do Not Distrub the tenants. Call for details
Key facts
- 6,969 sq ft lot
- 2 parking spots
- Listed 157 days
Neighborhood map
What this means for you Summary
Snapshot
- This is a 4-bed/2.0-bath condo listed at $25k. Condition is rated poor.
Deal economics
- At list price, monthly cash flow is $795 ($10k/yr) — positive.
- The deal already cash-flows at list — no discount required.
- Meets the 1% rule at list price ($1k rent vs $25k).
- Recommended offer: $22k (12.0% below list) — sets the bar for market timing.
- Cap rate 44.4% vs local median 4.7% in Greenwood — top-decile yield for the area; either an underpriced asset or a hidden risk that comps aren't pricing in. Stress-test before assuming the spread holds.
Location & tenants
- Location reads 71/100 on livability (#31 in MS) — a middle-class / working-renter tenant base. Strengths: cost of living A+, health & safety A+, housing A; Watch: schools D, amenities F, commute F.
- Market conditions: 101 active listings in the ZIP; 9 units permitted in Leflore County in 2024 (0 in 5+ unit buildings).
Forward outlook
- Local home prices are declining (-3.0%/yr); year-one equity from $173 of loan paydown is wiped out by about $750 of value loss. Plan a longer hold.
- Leflore County population projected at -29% by 2050 — secular population decline; favor cash flow + early exit over multi-decade hold.
- At projected returns (-3.0% appreciation + 3.0% rent growth), your $7k cash investment doubles in ~1 year — after that, you're playing with house money.
Negotiation context
- It's been on market 157 days — a 12% lower offer ($22k) is reasonable based on typical stale-listing flexibility.
- 2 sale attempts; this cycle's ask has dropped $17k (40%) from the opening price — seller is motivated, your offer sets the floor, not the list.
Risks & watch-outs
- Climate carrying-cost: extreme-heat days projected 7→21/yr by 2055 (HVAC capex compounding) — expect insurance premiums to compound above CPI over the hold.
Questions for the listing agent
- It's been on market 157 days. Have you received any prior offers? Is the seller open to a 12% concession, seller financing, or rate buy-down credit?
- Have any recent inspections been done? Can we get a copy of the seller's disclosures and any deferred-maintenance estimates?
- Any open or pending special assessments — roof, HVAC, plumbing, elevator, façade? What's the per-unit balance and payoff schedule, and is the seller paying it off at close or rolling it to the buyer?
- Why hasn't it sold? Are there any deal-killer items the seller is aware of (foundation, flood, title, zoning, code violations)?
- Is there a deadline driving the sale (1031 exchange, divorce, estate, relocation)? That informs how much negotiation room exists.
- Schools are D-rated, which usually means shorter tenancies and higher turnover. Who's the typical renter profile here, and what's been the actual vacancy rate?
- The area grade is low — what's the realistic commute time and amenity access for the typical tenant pool here? Any planned neighborhood developments (good or bad) we should know about?
- What's the average days-on-market for RENTAL listings here right now (not sales)? A rising rental-DOM trend means longer vacancies and softer asking-rent achievability than the comps imply.
- What's the recent tenant-quality profile in this submarket — average credit score on applications, eviction rate, late-payment / NSF rate, and stable-employment percentage? A property-management company in the area should have these aggregated.
- How much new apartment / multifamily construction is in the pipeline within 1–3 miles? Heavy new supply (>2% of stock underway) typically softens rents 12–24 months out; light construction supports rent growth.
Investment metrics
- 1% rule
- 4.90% ✓
- Cap rate
- 44.44%
- Cash-on-cash
- 136.23%
- DSCR
- 7.06
- GRM
- 1.7
CMA / ARV
No comps found within radius.
Projected returns pro-forma
-3.0% appreciation · 3.0% rent growth · sell at horizon
- IRR
- —
- Equity multiple
- 7.65×
- Total profit
- $46,579
- Equity at exit
- $3,728
- IRR
- —
- Equity multiple
- 16.12×
- Total profit
- $105,806
- Equity at exit
- $2,162
Cash invested: $7,000 (down + closing). Projections, not guarantees.
Landlord ↔ Tenant lean methodology
- Overall (STATE)
- 90 Strongly Landlord-Friendly
- State Mississippi
- 90 Strongly Landlord-Friendly · R+11
- County
- — inherits STATE
- City
- — inherits STATE
ZIP-level market 38930
- Home prices YoY
- -18.6%
- Active inventory
- 101
- Price-to-rent
- 1.7×
Monthly cashflow live
- Estimated rent
- $1,225 medium interval (Pro) →
- Mortgage (P&I)
- −$131
- Tax est. 1.5%
- −$31 /mo · $375/yr
- Insurance
- −$10
- HOA
- −$0
- Vacancy / Maint / Mgmt
- −$257
- Net cashflow
- $795
Break-even live
Sensitivity live
| Price | -10% $812 | -5% $803 | +0% $795 | +5% $786 | +10% $777 |
|---|---|---|---|---|---|
| Rent | -10% $698 | -5% $746 | +0% $795 | +5% $843 | +10% $891 |
| Rate | -1.0pp $807 | -0.5pp $801 | base $795 | +0.5pp $788 | +1.0pp $782 |
UW: 25.0% down · 7.5% · 30yr · 1.5% tax · 5.0% vac · 8.0% maint · 8.0% mgmt
Financing live
Cash to close
- Down payment
- $6,250
- Closing costs
- $750
- Reserves months
- —
- Total cash needed
- —
Loan-product check · same deal, 3 products live
Conventional
25% down · 7.5% · 30yr
- Down + closing
- —
- Monthly P&I
- —
- Monthly cashflow
- —
- DSCR
- —
- Eligible?
- —
Personal DTI + credit; lowest rate.
DSCR
20% down · 8.5% · 30yr
- Down + closing
- —
- Monthly P&I
- —
- Monthly cashflow
- —
- DSCR
- —
- Eligible?
- —
No personal income docs; deal must DSCR.
Hard money
10% down · 12.0% · 12mo
- Down + closing
- —
- Monthly P&I
- —
- Monthly cashflow
- —
- DSCR
- —
- Eligible?
- —
Short-term bridge; refi at stabilization.
HOA detail condo
- Monthly dues
- $0 · $0/yr
- Assessments
- None detected in remarks — confirm with the listing agent.
Listing history 21 events
-
2026-06-21days on market $25,000 Active 157 DOM
-
2026-06-21days on market $25,000 Active 156 DOM
-
2026-06-18days on market $25,000 Active 154 DOM
-
2026-06-17days on market $25,000 Active 153 DOM
-
2026-06-16days on market $25,000 Active 152 DOM
-
2026-06-15days on market $25,000 Active 151 DOM
-
2026-06-13days on market $25,000 Active 149 DOM
-
2026-06-12days on market $25,000 Active 148 DOM
-
2026-06-09days on market $25,000 Active 145 DOM
-
2026-06-08days on market $25,000 Active 144 DOM
-
2026-06-07days on market $25,000 Active 143 DOM
-
2026-06-04days on market $25,000 Active 139 DOM
-
2026-06-02days on market $25,000 Active 138 DOM
-
2026-06-01days on market $25,000 Active 137 DOM
-
2026-05-31days on market $25,000 Active 136 DOM
-
2026-05-08price $25,000 185-char remark
Show marketing remark (185 chars)
Investor Special! 4 sidebrick Duplex with 2BR1BTH on each side and a 1/1 brick Unit on same parcel . Sold AS-IS with long-term tenants. Do Not Distrub the tenants. Call for details
-
2026-04-13status Active 185-char remark
Show marketing remark (185 chars)
Investor Special! 4 sidebrick Duplex with 2BR1BTH on each side and a 1/1 brick Unit on same parcel . Sold AS-IS with long-term tenants. Do Not Distrub the tenants. Call for details
-
2026-04-10historical 185-char remark
Show marketing remark (185 chars)
Investor Special! 4 sidebrick Duplex with 2BR1BTH on each side and a 1/1 brick Unit on same parcel . Sold AS-IS with long-term tenants. Do Not Distrub the tenants. Call for details
-
2026-03-13price $34,000 185-char remark
Show marketing remark (185 chars)
Investor Special! 4 sidebrick Duplex with 2BR1BTH on each side and a 1/1 brick Unit on same parcel . Sold AS-IS with long-term tenants. Do Not Distrub the tenants. Call for details
-
2026-03-04price $39,000 185-char remark
Show marketing remark (185 chars)
Investor Special! 4 sidebrick Duplex with 2BR1BTH on each side and a 1/1 brick Unit on same parcel . Sold AS-IS with long-term tenants. Do Not Distrub the tenants. Call for details
-
2026-01-12$42,000 Active 185-char remark
Show marketing remark (185 chars)
Investor Special! 4 sidebrick Duplex with 2BR1BTH on each side and a 1/1 brick Unit on same parcel . Sold AS-IS with long-term tenants. Do Not Distrub the tenants. Call for details
ⓘ Source: listings_history table (triggers on properties + properties_extension) + one-shot
backfill from property_details.listing_events for pre-trigger history.
Climate risk First Street
- Heat 7/10 Severe
- Air quality 1/10 Low 0 unhealthy d/yr today · 0 by 30 yrs out
Nearby sold comps map
Loading sold comps map…
Walkable amenities ~0.75 mi
Loading nearby amenities…
Taxation est. · year 1
- Rental income
- $14,695
- − Mortgage interest
- −$1,400
- − Property taxes
- −$375
- − Insurance
- −$125
- − Repairs & maintenance
- −$1,176
- − Management
- −$1,176
- − Depreciation
- −$727
- Taxable income
- $9,716
- Est. tax owed @ 24.0%
- −$2,332
- After-tax cash flow
- $7,204/yr
For passive investors: Depreciation is non-cash, so a rental often shows a tax loss while cash-flowing — sheltering income. Rental losses are passive: they offset passive income freely, and up to $25,000/yr can offset ordinary (W-2) income if you actively participate and your MAGI is under $100k (phasing out to $0 by $150k); unused losses carry forward. On sale, claimed depreciation is recaptured at up to 25%, and gains may owe capital-gains tax (a 1031 exchange can defer both). Figures are a year-1 estimate at your 24.0% rate — not tax advice; consult a CPA.
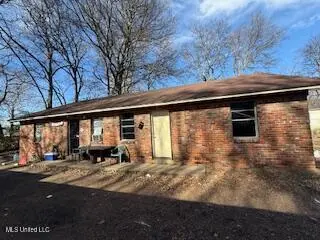
Condition & rehab AI · 2 photos
This multi-family property requires extensive repairs and maintenance, including a new roof, windows, and landscaping, to become move-in ready and increase its value.
Repairs flagged
- Major roof — Significant damage to the roof
- Major windows — Missing or damaged windows
- Major exterior siding — Weathered and damaged brick siding
Value-add opportunities
- Both New roof — Critical to the structural integrity and appearance of the property
- Both New windows — Improves energy efficiency and curb appeal
- Both Landscaping and curb appeal — Enhances the property's visual appeal and marketability
Renovation cost estimate screening
| Repair item | Severity | Est. cost |
|---|---|---|
| roof · Significant damage to the roof | Major | $15,000–50,000 |
| windows · Missing or damaged windows | Major | $15,000–50,000 |
| exterior siding · Weathered and damaged brick siding | Major | $15,000–50,000 |
| Total estimated repair cost · 3 items | $45,000–150,000 |
Value-add ROI direction
- Both New roof — Critical to the structural integrity and appearance of the property ↑
- Both New windows — Improves energy efficiency and curb appeal ↑
- Both Landscaping and curb appeal — Enhances the property's visual appeal and marketability ↑
ⓘ Cost ranges are severity-bucket heuristics (US national rule-of-thumb). Get contractor quotes + a written scope before underwriting a rehab budget.
Schools (NCES district)
No district data.
Livability — Greenwood
- Score
- 71/100
- State rank
- #31
- US rank
- #6625
Category grades
Schools grade is shown separately in the Schools card above.
Census & demographics
- Census place
- Greenwood, MS
- Population (ZIP)
- 23,326
Population outlook (Leflore County) Hauer SSP2
- Today (2025)
- 27,008 people
- By 2030
- 25,362 · -6.1%
- By 2040
- 22,049 · -18.4%
- By 2050
- 19,188 · -29.0%
- By 2075
- 13,543 · -49.9%
- By 2100
- 8,913 · -67.0%
Race, ethnicity, and origin ACS 2023
- Neighborhood character
- Predominantly Black (70%)
- Race & ethnicity
- Black 70% White 25% Hispanic / Latino 3% Two or more races 1%
- Common ancestry
- Slovak 1% Serbian 1%
- Foreign-born
- 2% · Canada, Jamaica
- Languages at home
- 97% English-only · Spanish 2%
Political lean MEDSL · Leflore
- 2024 margin
- Solid D (+38.5) · D 68.7% · R 30.3%
- 2008→2024 swing
- +1.7pp toward D · 2008: 36.8pp · 2024: 38.5pp
- All cycles
- 2024: D+38.5 2020: D+41.5 2016: D+41.0 2012: D+45.8 2008: D+36.8
Not yet ingested
- Civics
- —
Market trends
- HPI YoY
- ▼ -34.32%
- Current HPI
- 150.2668
- Rent YoY
- —
- Metro
- —
- State GDP YoY
- —
- F500 in state
- 0
Price history
-40.5% since first listed6 events — show timeline
- 2026-05-08 Price Changed $25,000 MLSU
- 2026-04-13 Relisted — MLSU
- 2026-04-10 Listing Removed — MLSU
- 2026-03-13 Price Changed $34,000 MLSU
- 2026-03-04 Price Changed $39,000 MLSU
- 2026-01-12 Listed $42,000 MLSU
Cash-flow waterfall
monthlySold comps — $/sqft
last 12 mo · ≤1 miLoading sold comps…