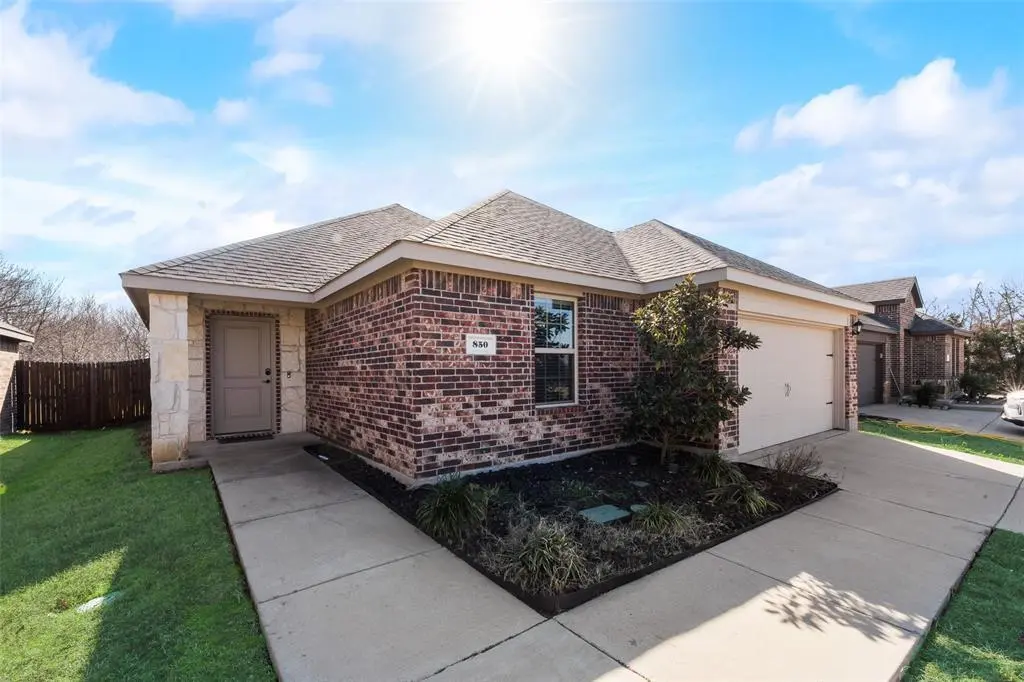
850 Levi Ln · Mesquite, TX
Flood risk 1/10 · Minimal
- FEMA flood zone
- X (unshaded)
- Chance of flooding over 30 yrs
- 0.0%
- Est. flood insurance / yr
- $507 – $1,088
Fire risk 5/10 · Moderate
- Est. fire insurance / yr
- $1,222 – $2,270
Heat risk 8/10 · Major
- Hot days now (above 110°F)
- 7 days/yr
- Hot days in 30 yrs
- 24 days/yr
Wind risk 6/10 · Moderate
- Chance of severe wind over 30 yrs
- 27.0%
Air-quality risk 2/10 · Minimal
- Unhealthy air days now
- 1 days/yr
- Unhealthy air days in 30 yrs
- 1 days/yr
Risk factors via First Street. Map © Google.
Why this score? — see what drove the C- grade
The composite is a weighted blend of 9 inputs, each scored 0–100. Each bar is that input's sub-score; the figure is the points it added to the 100-point composite (weight × sub-score).
- Cash flow +15.6/30.0
- ARV discount +12.5/15.0
- DSCR +4.8/10.0
- 1% rule +4.4/10.0
- Schools +4.0/10.0
- Livability +3.5/5.0
- Rent growth +2.9/5.0
- Condition / age +2.5/5.0
- Appreciation +0.0/10.0
$275,000
🖨 Deal sheet 📄 Offer letter ✓ Due diligence
Listing remarks MLS
Charming 3 bedroom, 2 bathroom home in Forney ISD! Spacious living room with breakfast bar connecting to the eat-in kitchen, which offers granite countertops & stainless steel appliances. The primary suite features a walk-in closet with custom closet system & ensuite bath. Your furry friends will have room to run and play in the spacious backyard. Easy access to I-20.
Key facts
- Custom closet system
- Walk-in closet
- Ensuite bath
Tags
Neighborhood map
What this means for you Summary
Snapshot
- This is a 4-bed/2.0-bath single-family listed at $275k.
Deal economics
- At list price, monthly cash flow is $117 ($1k/yr) — positive.
- The deal already cash-flows at list — no discount required.
- To meet the 1% rule (rent ≥ 1% of price), the offer needs to be $257k (6.4% below list).
- Recommended offer: $242k (12.0% below list) — sets the bar for market timing.
- Cap rate 6.8% vs local median 4.4% in Mesquite — top-decile yield for the area; either an underpriced asset or a hidden risk that comps aren't pricing in. Stress-test before assuming the spread holds.
Location & tenants
- Location reads 70/100 on livability (#358 in TX) — a middle-class / working-renter tenant base. Strengths: cost of living A+, housing A+, health & safety A-; Watch: schools C-, crime F, commute F.
- Forney ISD (rural): math 41% / reading 44% proficiency, ranked #234 of 826 in TX (top 28%) — families likely to look elsewhere, expect single-tenant / working-renter base with shorter leases.
- Market conditions: Rents rising (+1.4%/yr); 2179 active listings in the ZIP; 33 comparable units currently listed for rent nearby; rentals at typical pace (median 24d on market — plan ~3-4 weeks tenant-placement turnaround); 45% of comp listings sitting > 30 days — soft ceiling on asking rent; solid renter incomes; 1,747 units permitted in Kaufman County in 2024 (180 in 5+ unit buildings).
Forward outlook
- Local home prices are declining (-3.0%/yr); year-one equity from $2k of loan paydown is wiped out by about $8k of value loss. Plan a longer hold.
- Kaufman County population projected at +43% by 2050 — long-run rental-demand tailwind backs the buy-and-hold thesis.
Negotiation context
- It's been on market 399 days — a 12% lower offer ($242k) is reasonable based on typical stale-listing flexibility.
- 6 sale attempts since 8y ago with the ask held roughly flat each time — persistent listings suggest the price (not the market) is what's stuck; bring a comps-based counter.
Risks & watch-outs
- Climate carrying-cost: major wind risk, 27% chance of damaging wind over 30y; moderate wildfire risk; extreme-heat days projected 7→24/yr by 2055 (HVAC capex compounding) — expect insurance premiums to compound above CPI over the hold.
Questions for the listing agent
- It's been on market 399 days. Have you received any prior offers? Is the seller open to a 12% concession, seller financing, or rate buy-down credit?
- What does the HOA fee cover, when was the last increase, and are there any pending special assessments or reserve-fund shortfalls?
- Why hasn't it sold? Are there any deal-killer items the seller is aware of (foundation, flood, title, zoning, code violations)?
- Is there a deadline driving the sale (1031 exchange, divorce, estate, relocation)? That informs how much negotiation room exists.
- Crime grade is F in this area — have there been break-ins, vandalism, or insurance claims at this property in the last 3 years? What carrier currently insures it and at what premium?
- What's the average days-on-market for RENTAL listings here right now (not sales)? A rising rental-DOM trend means longer vacancies and softer asking-rent achievability than the comps imply.
- What's the recent tenant-quality profile in this submarket — average credit score on applications, eviction rate, late-payment / NSF rate, and stable-employment percentage? A property-management company in the area should have these aggregated.
- How much new for-sale + rental construction is in the pipeline within 1–3 miles? Heavy new supply typically softens prices + rents 12–24 months out; constrained supply supports both.
Investment metrics
- 1% rule
- 0.94% ✗
- Cap rate
- 6.80%
- Cash-on-cash
- 1.82%
- DSCR
- 1.08
- GRM
- 8.9
CMA / ARV
- ARV (median comp)
- $309,019
- List price
- $275,000
- Delta
- -11.01%
- Verdict
- UNDERPRICED
- Comps
- 20 within 1.0 mi
Show comp detail 12 sales within ~0.75 mi
| Address | Dist | Beds/Ba | Sqft | Sold | Price | $/sf | Match |
|---|---|---|---|---|---|---|---|
| 3210 Emerson Rd | 0.07mi | 4/2.0 | 1,600 (-9%) | 4mo | $253,990 | $159 | 79 |
| 3225 Stanley St | 0.65mi | 4/2.0 | 1,801 (+3%) | 1mo | $269,900 | $150 | 64 |
| 2465 Willard Way | 0.47mi | 4/2.0 | 1,627 (-7%) | 4mo | $289,990 | $178 | 62 |
| 4200 Plateau Dr | 0.64mi | 4/2.0 | 1,832 (+5%) | 4mo | $320,990 | $175 | 59 |
| 2015 Allyson Dr | 0.64mi | 4/2.0 | 1,614 (-8%) | 3mo | $245,000 | $152 | 54 |
| 2002 Carriage Rd | 0.61mi | 3/2.0 (-1) | 1,885 (+8%) | 1mo | $253,500 | $134 | 53 |
| 2008 Allyson Dr | 0.68mi | 3/2.0 (-1) | 1,869 (+7%) | 4mo | $249,900 | $134 | 49 |
| 2007 Sterling Gate Dr | 0.66mi | 3/2.0 (-1) | 1,912 (+9%) | 2mo | $265,000 | $139 | 48 |
| 4174 Plateau Dr | 0.69mi | 4/2.0 | 1,935 (+10%) | 4mo | $340,490 | $176 | 47 |
| 4194 Plateau Dr | 0.65mi | 4/2.0 | 2,014 (+15%) | 4mo | $359,490 | $178 | 42 |
| 2029 Karsen Ln | 0.53mi | 3/2.0 (-1) | 1,496 (-15%) | 5mo | $249,990 | $167 | 42 |
| 4168 Plateau Dr | 0.71mi | 4/3.0 | 2,014 (+15%) | 4mo | $362,750 | $180 | 35 |
Match score weights: distance 35% · size 25% · config 20% · recency 20%. Top-matched comps best support the ARV.
Projected returns pro-forma
-3.0% appreciation · 1.42% rent growth · sell at horizon
- IRR
- -15.2%
- Equity multiple
- 0.47×
- Total profit
- $-41,088
- Equity at exit
- $41,003
- IRR
- -9.5%
- Equity multiple
- 0.45×
- Total profit
- $-41,997
- Equity at exit
- $23,777
Cash invested: $77,000 (down + closing). Projections, not guarantees.
Landlord ↔ Tenant lean methodology
- Overall (STATE)
- 87 Strongly Landlord-Friendly
- State Texas
- 87 Strongly Landlord-Friendly · R+5
- County
- — inherits STATE
- City
- — inherits STATE
ZIP-level market 75126
- Rents YoY
- 1.4%
- Active inventory
- 2179
- Price-to-rent
- 8.9×
Monthly cashflow live
- Estimated rent
- $2,574 high interval (Pro) →
- Mortgage (P&I)
- −$1,442
- Tax from tax record
- −$317 /mo · $3,810/yr
- Insurance
- −$115
- HOA
- −$42
- Vacancy / Maint / Mgmt
- −$540
- Net cashflow
- $117
Break-even live
UW: 25.0% down · 7.5% · 30yr · 1.5% tax · 5.0% vac · 8.0% maint · 8.0% mgmt
Financing live
Cash to close
- Down payment
- $68,750
- Closing costs
- $8,250
- Reserves months
- —
- Total cash needed
- —
Loan-product check · same deal, 3 products live
Conventional
25% down · 7.5% · 30yr
- Down + closing
- —
- Monthly P&I
- —
- Monthly cashflow
- —
- DSCR
- —
- Eligible?
- —
Personal DTI + credit; lowest rate.
DSCR
20% down · 8.5% · 30yr
- Down + closing
- —
- Monthly P&I
- —
- Monthly cashflow
- —
- DSCR
- —
- Eligible?
- —
No personal income docs; deal must DSCR.
Hard money
10% down · 12.0% · 12mo
- Down + closing
- —
- Monthly P&I
- —
- Monthly cashflow
- —
- DSCR
- —
- Eligible?
- —
Short-term bridge; refi at stabilization.
Rent comps 33 comps
| Address | Beds | Baths | Sqft | Rent | $/sqft | DOM | Units | Dist |
|---|---|---|---|---|---|---|---|---|
| 2850 Dusty Rd Forney, TX | 4.0 | 3.0 | 2115 | $2,450 | $1.16 | 19d | 1 | 0.21mi |
| 1450 Arabella Ave Forney, TX | 4.0 | 2.0 | 1636 | $2,250 | $1.38 | 12d | 1 | 0.41mi |
| 2320 Willard Way Forney, TX | 5.0 | 4.0 | 2408 | $3,950 | $1.64 | 43d | 1 | 0.46mi |
| 3001 Glazner Dr Forney, TX | 3.0 | 2.0 | 1510 | $2,350 | $1.56 | 43d | 1 | 0.49mi |
| 3137 Grimaldo Dr Forney, TX | 3.0 | 2.0 | 1585 | $2,195 | $1.38 | 24d | 1 | 0.52mi |
| 3137 Grimaldo Dr Forney, TX | 3.0 | 2.0 | 1565 | $1,995 | $1.27 | 12d | 1 | 0.52mi |
| 3012 Glazner Dr Forney, TX | 3.0 | 2.5 | 1984 | $2,195 | $1.11 | 3d | 1 | 0.53mi |
| 2035 Karsen Ln Heartland, TX | 4.0 | 2.0 | 1587 | $2,125 | $1.34 | 1d | 1 | 0.53mi |
| 3204 Stanley St Forney, TX | 4.0 | 2.5 | 2425 | $2,400 | $0.99 | 24d | 1 | 0.56mi |
| 4186 Rim Trl Forney, TX | 4.0 | 2.0 | 2060 | $2,750 | $1.33 | 43d | 1 | 0.60mi |
| 2038 Allyson Dr Heartland, TX | 3.0 | 2.0 | 1496 | $1,900 | $1.27 | 43d | 1 | 0.61mi |
| 4198 Plateau Dr Forney, TX | 4.0 | 2.0 | 1832 | $3,573 | $1.95 | 43d | 1 | 0.63mi |
| 4162 Rim Trl Forney, TX | 4.0 | 2.0 | 1916 | $2,500 | $1.30 | 43d | 1 | 0.65mi |
| 2040 Shawnee Trl Heartland, TX | 4.0 | 2.0 | 1836 | $2,000 | $1.09 | 15d | 1 | 0.66mi |
| 3324 Perman Dr Forney, TX | 3.0 | 2.5 | 1724 | $2,125 | $1.23 | 12d | 1 | 0.67mi |
| 4178 Plateau Dr Forney, TX | 4.0 | 2.0 | 1832 | $3,573 | $1.95 | 44d | 1 | 0.67mi |
| 3328 Perman Dr Forney, TX | 4.0 | 2.5 | 2301 | $2,400 | $1.04 | 43d | 1 | 0.67mi |
| 4170 Plateau Dr Forney, TX | 4.0 | 2.0 | 2100 | $3,573 | $1.70 | 43d | 1 | 0.68mi |
| 2048 Stagecoach Trl Heartland, TX | 3.0 | 2.5 | 2284 | $2,300 | $1.01 | 1d | 1 | 0.73mi |
| 2048 Stagecoach Trl Unit NA Forney, TX | 3.0 | 2.5 | 2284 | $2,295 | $1.00 | 43d | 1 | 0.73mi |
| 2015 Angel Way Heartland, TX | 3.0 | 2.0 | 1408 | $1,671 | $1.19 | 22d | 1 | 0.80mi |
| 4306 Paxton Dr Forney, TX | 4.0 | 2.0 | 1837 | $2,600 | $1.42 | 43d | 1 | 0.85mi |
| 4009 Freedom St Heartland, TX | 3.0 | 2.0 | 1419 | $1,800 | $1.27 | 44d | 1 | 0.96mi |
| 4005 Waterford Dr Forney, TX | 4.0 | 2.0 | 1852 | $2,350 | $1.27 | 43d | 1 | 0.96mi |
| 2048 Lake Trail Dr Heartland, TX | 3.0 | 2.0 | 1900 | $2,300 | $1.21 | 1d | 1 | 1.00mi |
| 2048 Lake Trail Dr Heartland, TX | 3.0 | 2.0 | 1908 | $2,250 | $1.18 | 2d | 1 | 1.00mi |
| 4032 Eagle Dr Forney, TX | 3.0 | 2.0 | 1456 | $1,775 | $1.22 | 4d | 1 | 1.08mi |
| 2140 Florence Dr Forney, TX | 4.0 | 2.5 | 2032 | $2,600 | $1.28 | 43d | 1 | 1.23mi |
| 2302 Doe Branch Ln Forney, TX | 4.0 | 2.5 | 2457 | $2,750 | $1.12 | 22d | 1 | 1.26mi |
| 2503 Blue Oasis Ct Forney, TX | 4.0 | 2.5 | 2127 | $2,499 | $1.17 | 7d | 1 | 1.27mi |
| 1308 Middlebrooks Dr Forney, TX | 4.0 | 2.5 | 2231 | $2,650 | $1.19 | 44d | 1 | 1.42mi |
| 1968 Marble Ln Forney, TX | 3.0 | 2.5 | 2051 | $2,350 | $1.15 | 15d | 1 | 1.42mi |
| 4121 Gaillardia Way Forney, TX | 4.0 | 2.0 | 2135 | $2,250 | $1.05 | 18d | 1 | 1.42mi |
HOA detail
- Monthly dues
- $42 · $504/yr
Listing history 21 events
-
2026-06-04days on market $275,000 Active 399 DOM
-
2026-06-03days on market $275,000 Active 398 DOM
-
2026-06-02days on market $275,000 Active 397 DOM
-
2026-06-01days on market $275,000 Active 396 DOM
-
2026-05-31days on market $275,000 Active 395 DOM
-
2025-09-16price $275,000 378-char remark
Show marketing remark (378 chars)
Charming 3 bedroom, 2 bathroom home in Forney ISD! Spacious living room with breakfast bar connecting to the eat-in kitchen, which offers granite countertops & stainless steel appliances. The primary suite features a walk-in closet with custom closet system & ensuite bath. Your furry friends will have room to run and play in the spacious backyard. Easy access to I-20.
-
2025-05-01$285,000 Active 378-char remark
Show marketing remark (378 chars)
Charming 3 bedroom, 2 bathroom home in Forney ISD! Spacious living room with breakfast bar connecting to the eat-in kitchen, which offers granite countertops & stainless steel appliances. The primary suite features a walk-in closet with custom closet system & ensuite bath. Your furry friends will have room to run and play in the spacious backyard. Easy access to I-20.
-
2025-05-01historical
Show marketing remark (378 chars)
Charming 3 bedroom, 2 bathroom home in Forney ISD! Spacious living room with breakfast bar connecting to the eat-in kitchen, which offers granite countertops & stainless steel appliances. The primary suite features a walk-in closet with custom closet system & ensuite bath. Your furry friends will have room to run and play in the spacious backyard. Easy access to I-20.
-
2025-01-23$285,000 Active
-
2024-10-28soldstatus
-
2024-10-25soldstatus Closed
-
2024-09-26historical Active Option Contract
-
2024-09-18price $285,000
-
2024-08-09status Active
-
2024-08-03historical Active Option Contract
-
2024-07-22status Active
-
2024-07-16historical Active Option Contract
-
2024-06-29$290,000 Active
-
2019-02-11soldstatus Sold
-
2019-02-02status Pending
-
2018-12-30$211,490 Active
ⓘ Source: listings_history table (triggers on properties + properties_extension) + one-shot
backfill from property_details.listing_events for pre-trigger history.
Tax reassessment forecast TX · Resets to sale price
- Current annual tax
- $3,810 · $317/mo
- Projected year-2 tax
- $5,032 · $419/mo
- Expected delta
- +$1,223/yr (+$102/mo · 32.1%)
ⓘ Screening estimate from a state-policy table — verify with the county assessor before closing.
Climate risk First Street
- Flood 1/10 Low FEMA zone X (unshaded) · 0% chance over 30 yrs
- Wildfire 5/10 Major
- Heat 8/10 Severe 7 d/yr ≥110°F today · 24 d/yr by 30 yrs out
- Wind 6/10 Major 27% chance of damaging wind over 30 yrs
- Air quality 2/10 Low 1 unhealthy d/yr today · 1 by 30 yrs out
Nearby sold comps map
Loading sold comps map…
Walkable amenities ~0.75 mi
Loading nearby amenities…
Taxation est. · year 1
- Rental income
- $30,884
- − Mortgage interest
- −$15,404
- − Property taxes
- −$3,810
- − Insurance
- −$1,375
- − Repairs & maintenance
- −$2,471
- − Management
- −$2,471
- − HOA
- −$504
- − Depreciation
- −$8,000
- Taxable loss
- −$3,150
- Est. tax savings @ 24.0%
- +$756
- After-tax cash flow
- $2,160/yr
For passive investors: Depreciation is non-cash, so a rental often shows a tax loss while cash-flowing — sheltering income. Rental losses are passive: they offset passive income freely, and up to $25,000/yr can offset ordinary (W-2) income if you actively participate and your MAGI is under $100k (phasing out to $0 by $150k); unused losses carry forward. On sale, claimed depreciation is recaptured at up to 25%, and gains may owe capital-gains tax (a 1031 exchange can defer both). Figures are a year-1 estimate at your 24.0% rate — not tax advice; consult a CPA.
Schools (NCES district)
- District
- Forney ISD
- NCES district ID
- 4819560
- Math proficiency
- 41% ▼ -20.00%
- Reading proficiency
- 44% ▼ -12.00%
- Median HH income
- $86,679
- Composite
- 40.07/100
- National rank
- #3812
- State rank
- #234 of 826 in TX
Livability — Mesquite
- Score
- 70/100
- State rank
- #358
- US rank
- #7743
Category grades
Schools grade is shown separately in the Schools card above.
Census & demographics
- County
- Kaufman County · 122,338 people
- City population
- 150,788
- Metro
- Dallas-Fort Worth-Arlington, TX
- Population (ZIP)
- 84,799
- Household income
- $103,673
- Rent vs Own
- Severe rent burden
- 1306.0
Population outlook (Kaufman County) Hauer SSP2
- Today (2025)
- 138,716 people
- By 2030
- 150,815 · +8.7%
- By 2040
- 174,877 · +26.1%
- By 2050
- 198,020 · +42.8%
- By 2075
- 251,908 · +81.6%
- By 2100
- 285,325 · +105.7%
Race, ethnicity, and origin ACS 2023
- Neighborhood character
- Diverse neighborhood (Simpson 0.68)
- Race & ethnicity
- White 45% Black 25% Hispanic / Latino 23% Two or more races 14% Asian 3%
- Hispanic origin (detail)
- Mexican 18% Puerto Rican 1%
- Common ancestry
- Italian 2% Slovak 1% Portuguese 1%
- Foreign-born
- 12% · Canada, Vietnam
- Languages at home
- 79% English-only · Spanish 14% Arabic 1% Vietnamese 1%
Political lean MEDSL · Kaufman
- 2024 margin
- Strong R (+27.9) · D 35.6% · R 63.5%
- 2008→2024 swing
- +7.9pp toward D · 2008: -35.8pp · 2024: -27.9pp
- All cycles
- 2024: R+27.9 2020: R+33.9 2016: R+47.0 2012: R+44.4 2008: R+35.8
Not yet ingested
- Civics
- —
Market trends
- HPI YoY
- ▼ -102.93%
- Current HPI
- 148.5749
- Rent YoY
- ▲ 1.42%
- Metro
- Dallas-Fort Worth-Arlington, TX
- State GDP YoY
- ▲ 3.95%
- F500 in state
- 110
Industry mix (Fortune 500 HQ in TX)
| Industry | F500 HQs | Revenue |
|---|---|---|
| Energy | 16 | $1,198B |
|
||
| Technology | 5 | $198B |
|
||
| Engineering / Construction | 4 | $72B |
|
||
| Energy Services | 3 | $60B |
|
||
| Utilities | 3 | $41B |
|
||
| Healthcare | 2 | $330B |
|
||
Price history
+30.0% since first listed16 events — show timeline
- 2025-09-16 Price Changed $275,000 NTREIS
- 2025-05-01 Listing Removed — NTREIS
- 2025-05-01 Listed $285,000 NTREIS
- 2025-01-23 Listed $285,000 NTREIS
- 2024-10-28 Sold (Public Records) — Public Records
- 2024-10-25 Sold (MLS) — NTREIS
- 2024-09-26 Contingent — NTREIS
- 2024-09-18 Price Changed $285,000 NTREIS
- 2024-08-09 Relisted — NTREIS
- 2024-08-03 Contingent — NTREIS
- 2024-07-22 Relisted — NTREIS
- 2024-07-16 Contingent — NTREIS
- 2024-06-29 Listed $290,000 NTREIS
- 2019-02-11 Sold (MLS) — NTREIS
- 2019-02-02 Pending — NTREIS
- 2018-12-30 Listed $211,490 NTREIS
Property tax history
+22.0%/yrLatest (2025): $3,810 · -53.0% YoY. Source: county tax records.
Cash-flow waterfall
monthlySold comps — $/sqft
last 12 mo · ≤1 miLoading sold comps…