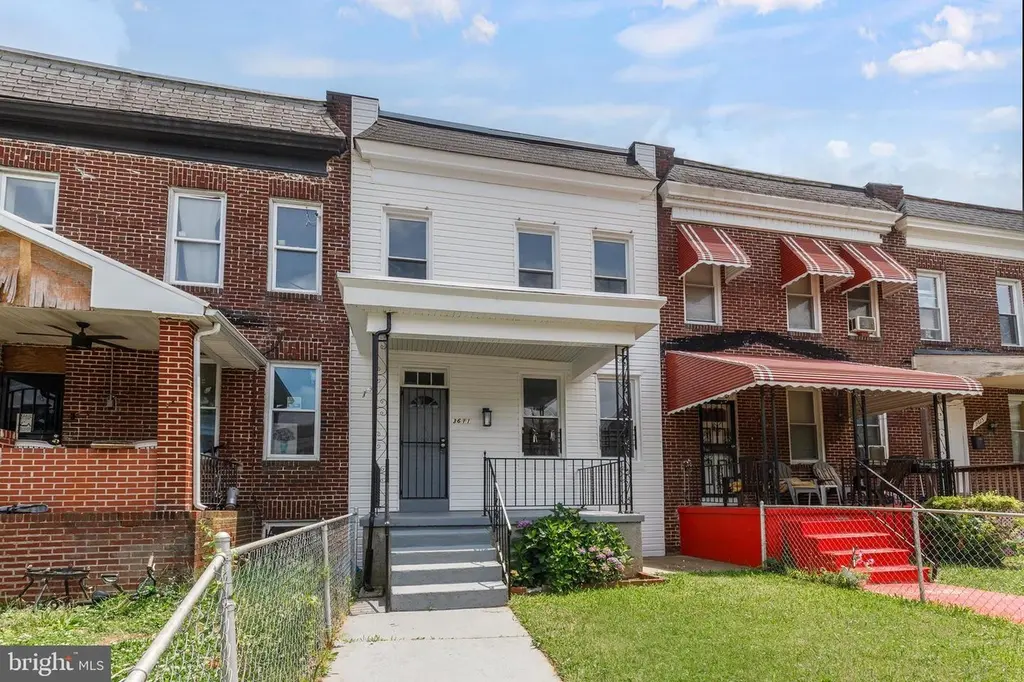
3611 W Garrison Ave · Baltimore, MD
Flood risk 1/10 · Minimal
- FEMA flood zone
- X (unshaded)
- Chance of flooding over 30 yrs
- 0.0%
- Est. flood insurance / yr
- $507 – $1,088
Fire risk 1/10 · Minimal
- Est. fire insurance / yr
- $755 – $1,403
Heat risk 7/10 · Major
- Hot days now (above 104°F)
- 7 days/yr
- Hot days in 30 yrs
- 15 days/yr
Wind risk 4/10 · Minor
- Chance of severe wind over 30 yrs
- 21.0%
Air-quality risk 3/10 · Minor
- Unhealthy air days now
- 3 days/yr
- Unhealthy air days in 30 yrs
- 4 days/yr
Risk factors via First Street. Map © Google.
Why this score? — see what drove the B grade
The composite is a weighted blend of 9 inputs, each scored 0–100. Each bar is that input's sub-score; the figure is the points it added to the 100-point composite (weight × sub-score).
- Cash flow +29.1/30.0
- ARV discount +15.0/15.0
- DSCR +10.0/10.0
- 1% rule +7.8/10.0
- Livability +3.8/5.0
- Rent growth +3.1/5.0
- Condition / age +2.5/5.0
- Schools +1.0/10.0
- Appreciation +0.0/10.0
$175,000
🖨 Deal sheet 📄 Offer letter ✓ Due diligence
Listing remarks
This beautifully renovated, turn-key home perfectly blends modern style with functional design, offering a seamless, move-in-ready living experience. The main level boasts a bright, airy open-concept layout that connects the living and dining areas to a gourmet dream kitchen, fully equipped with brand-new stainless steel appliances, crisp new cabinetry, and elegant granite countertops. Upstairs, you will find three generously sized, sunlit bedrooms alongside a beautifully updated full bathroom, creating a peaceful and private retreat. The finished basement adds incredible versatility to the property, featuring an extra room ideal for a home office, gym, or guest space, a convenient half bat
Key facts
- Finished basement
- New cabinetry
- Granite countertops
Tags
Property features AI
Exterior
- Parking: On-street parking
- Utilities: Public water; Public sewer; Natural gas for heating; Other hot water source
- Home design: Interior townhouse/rowhouse; Fee simple ownership
- Construction: Brick construction; Other foundation
- Exterior features: No tidal water
Interior
- Bedrooms: Four bedrooms on the main level
- Bathrooms: One full bathroom; One half bathroom
- Heating & cooling: Forced air heating; Electric-powered cooling (other type)
- Interior features: Estimated living area; Finished lower level space
Neighborhood map
What this means for you Summary
Snapshot
- This is a 4-bed/1.5-bath townhouse listed at $175k.
Deal economics
- At list price, monthly cash flow is $604 ($7k/yr) — positive.
- The deal already cash-flows at list — no discount required.
- Meets the 1% rule at list price ($2k rent vs $175k).
- Cap rate 10.4% vs local median 6.0% in Baltimore — top-decile yield for the area; either an underpriced asset or a hidden risk that comps aren't pricing in. Stress-test before assuming the spread holds.
Location & tenants
- Location reads 76/100 on livability (#90 in MD, #3,396 nationally) — a middle-class / working-renter tenant base. Strengths: amenities A+, commute A+, housing A+; Watch: schools D, crime F.
- Baltimore City Public Schools (urban): math 7% / reading 16% proficiency, ranked #24 of 24 in MD (top 100%) — low school quality limits family demand, transient renter base, plan for 1-2y turnover; 79% free/reduced lunch — lower-income household profile, screen leases tightly.
- Market conditions: Rents rising (+2.4%/yr); 351 active listings in the ZIP; 9 comparable units currently listed for rent nearby; rentals at typical pace (median 24d on market — plan ~3-4 weeks tenant-placement turnaround); 1,273 units permitted in Baltimore city in 2024 (1,104 in 5+ unit buildings).
- At $2,233/mo this rent would consume 52% of the median local household income ($52k/yr) (locally 3644% of renters already pay >50% of income on rent) — very limited rent-growth headroom before tenants either downsize or default.
Forward outlook
- Local home prices are declining (-3.0%/yr); year-one equity from $1k of loan paydown is wiped out by about $5k of value loss. Plan a longer hold.
- Baltimore County population projected to shrink 4% by 2050 — rents likely to lag national; underwrite the cash flow, not the appreciation.
- At projected returns (-3.0% appreciation + 2.4% rent growth), your $49k cash investment doubles in ~9 years — after that, you're playing with house money.
Negotiation context
- Only 1 days on market — expect competitive offers; lowballing is unlikely to land.
- 6 sale attempts since 6y ago with the ask held roughly flat each time — persistent listings suggest the price (not the market) is what's stuck; bring a comps-based counter.
- Current owner paid $116k; list at $175k implies a 52% gain — meaningful room to come down on a strong offer.
Risks & watch-outs
- Watch-outs: built in 1920 — expect roof / HVAC / electrical / plumbing capex.
- Climate carrying-cost: extreme-heat days projected 7→15/yr by 2055 (HVAC capex compounding) — expect insurance premiums to compound above CPI over the hold.
Questions for the listing agent
- Built in 1920 — when were the roof, HVAC, electrical panel, plumbing, and water heater last replaced?
- Is there a deadline driving the sale (1031 exchange, divorce, estate, relocation)? That informs how much negotiation room exists.
- Schools are D-rated, which usually means shorter tenancies and higher turnover. Who's the typical renter profile here, and what's been the actual vacancy rate?
- Crime grade is F in this area — have there been break-ins, vandalism, or insurance claims at this property in the last 3 years? What carrier currently insures it and at what premium?
- What's the average days-on-market for RENTAL listings here right now (not sales)? A rising rental-DOM trend means longer vacancies and softer asking-rent achievability than the comps imply.
- What's the recent tenant-quality profile in this submarket — average credit score on applications, eviction rate, late-payment / NSF rate, and stable-employment percentage? A property-management company in the area should have these aggregated.
- How much new for-sale + rental construction is in the pipeline within 1–3 miles? Heavy new supply typically softens prices + rents 12–24 months out; constrained supply supports both.
Investment metrics
- 1% rule
- 1.28% ✓
- Cap rate
- 10.44%
- Cash-on-cash
- 14.79%
- DSCR
- 1.66
- GRM
- 6.5
CMA / ARV
- ARV (on-the-fly)
- $267,150
- Comps found
- 12
Show comp detail 12 sales within ~0.75 mi
| Address | Dist | Beds/Ba | Sqft | Sold | Price | $/sf | Match |
|---|---|---|---|---|---|---|---|
| 3701 Manchester Ave | 0.14mi | 4/2.5 | 1,900 (-3%) | 4mo | $170,000 | $89 | 82 |
| 5410 Narcissus Ave | 0.50mi | 4/2.5 | 1,860 (-5%) | 3mo | $260,000 | $140 | 62 |
| 5019 Queensberry Ave | 0.48mi | 4/3.5 | 2,079 (+7%) | 1mo | $288,000 | $139 | 58 |
| 5422 Narcissus Ave | 0.51mi | 4/3.5 | 1,872 (-4%) | 4mo | $254,000 | $136 | 58 |
| 4040 Hayward Ave | 0.45mi | 3/0.5 (-1) | 1,783 (-9%) | 4mo | $67,500 | $38 | 52 |
| 4668 Pimlico Rd | 0.49mi | 3/2.5 (-1) | 2,100 (+8%) | 4mo | $185,000 | $88 | 52 |
| 2807 Waldorf Ave | 0.46mi | 3/3.5 (-1) | 1,762 (-10%) | 1mo | $200,000 | $114 | 48 |
| 3742 Dolfield Ave | 0.45mi | 3/2.5 (-1) | 1,724 (-12%) | 4mo | $265,000 | $154 | 47 |
| 5100 Queensberry Ave | 0.47mi | 5/4.0 (+1) | 2,150 (+10%) | 5mo | $285,000 | $133 | 42 |
| 5132 Pembridge Ave | 0.58mi | 5/4.0 (+1) | 1,760 (-10%) | 1mo | $257,900 | $147 | 41 |
| 4011 Ridgewood Ave | 0.72mi | 5/3.5 (+1) | 2,122 (+9%) | 3mo | $290,000 | $137 | 37 |
| 5404 Crismer Ave | 0.67mi | 3/2.0 (-1) | 1,667 (-14%) | 1mo | $239,900 | $144 | 36 |
Match score weights: distance 35% · size 25% · config 20% · recency 20%. Top-matched comps best support the ARV.
Projected returns pro-forma
-3.0% appreciation · 2.41% rent growth · sell at horizon
- IRR
- 4.7%
- Equity multiple
- 1.18×
- Total profit
- $8,801
- Equity at exit
- $26,093
- IRR
- 13.6%
- Equity multiple
- 2.06×
- Total profit
- $51,873
- Equity at exit
- $15,131
Cash invested: $49,000 (down + closing). Projections, not guarantees.
Landlord ↔ Tenant lean methodology
- Overall (CITY)
- 12 Strongly Tenant-Friendly
- State Maryland
- 27 Tenant-Leaning · D+14
- County
- — inherits STATE
- City Baltimore
- 12 Strongly Tenant-Friendly · D+58
ZIP-level market 21215
- Rents YoY
- 2.4%
- Active inventory
- 351
- Price-to-rent
- 6.5×
Monthly cashflow live
- Estimated rent
- $2,233 high interval (Pro) →
- Mortgage (P&I)
- −$918
- Tax from tax record
- −$170 /mo · $2,037/yr
- Insurance
- −$73
- HOA
- −$0
- Vacancy / Maint / Mgmt
- −$469
- Net cashflow
- $604
Break-even live
UW: 25.0% down · 7.5% · 30yr · 1.5% tax · 5.0% vac · 8.0% maint · 8.0% mgmt
Financing live
Cash to close
- Down payment
- $43,750
- Closing costs
- $5,250
- Reserves months
- —
- Total cash needed
- —
Loan-product check · same deal, 3 products live
Conventional
25% down · 7.5% · 30yr
- Down + closing
- —
- Monthly P&I
- —
- Monthly cashflow
- —
- DSCR
- —
- Eligible?
- —
Personal DTI + credit; lowest rate.
DSCR
20% down · 8.5% · 30yr
- Down + closing
- —
- Monthly P&I
- —
- Monthly cashflow
- —
- DSCR
- —
- Eligible?
- —
No personal income docs; deal must DSCR.
Hard money
10% down · 12.0% · 12mo
- Down + closing
- —
- Monthly P&I
- —
- Monthly cashflow
- —
- DSCR
- —
- Eligible?
- —
Short-term bridge; refi at stabilization.
Rent comps 9 comps
| Address | Beds | Baths | Sqft | Rent | $/sqft | DOM | Units | Dist |
|---|---|---|---|---|---|---|---|---|
| 3784 Columbus Dr Baltimore, MD | 4.0 | 2.0 | 1250 | $2,200 | $1.76 | 23d | 1 | 0.39mi |
| 5306 Ethelbert Ave Baltimore, MD | 5.0 | 2.5 | 1510 | $3,000 | $1.99 | 4d | 1 | 0.42mi |
| 4704 Pimlico Rd Baltimore, MD | 3.0 | 1.5 | 2006 | $1,800 | $0.90 | 23d | 1 | 0.50mi |
| 4230 Towanda Ave Baltimore, MD | 3.0 | 2.0 | 1400 | $1,800 | $1.29 | 17d | 1 | 0.81mi |
| 4037 Cedardale Rd Baltimore, MD | 5.0 | 3.0 | 1500 | $2,800 | $1.87 | 14d | 1 | 0.92mi |
| 2619 Loyola Northway Baltimore, MD | 3.0 | 2.0 | 1400 | $1,995 | $1.43 | 23d | 1 | 0.93mi |
| 3204 Sequoia Ave Baltimore, MD | 4.0 | 2.5 | 1791 | $2,600 | $1.45 | 43d | 1 | 1.27mi |
| 3822 Pall Mall Rd Baltimore, MD | 3.0 | 1.5 | 1320 | $1,875 | $1.42 | 43d | 1 | 1.27mi |
| 3709 Fords Ln Baltimore, MD | 4.0 | 3.5 | 2248 | $3,200 | $1.42 | 19d | 1 | 1.40mi |
Listing history 2 events
-
2026-06-18remarks 699-char remark
-
2026-06-18$175,000 Active 1 DOM
ⓘ Source: listings_history table (triggers on properties + properties_extension) + one-shot
backfill from property_details.listing_events for pre-trigger history.
Tax reassessment forecast MD · Partial reset (capped growth)
- Current annual tax
- $2,037 · $170/mo
- Projected year-2 tax
- $2,037 · $170/mo
- Expected delta
- $0/yr ($0/mo · 0.0%)
ⓘ Screening estimate from a state-policy table — verify with the county assessor before closing.
Climate risk First Street
- Flood 1/10 Low FEMA zone X (unshaded) · 0% chance over 30 yrs
- Wildfire 1/10 Low
- Heat 7/10 Severe 7 d/yr ≥104°F today · 15 d/yr by 30 yrs out
- Wind 4/10 Moderate 21% chance of damaging wind over 30 yrs
- Air quality 3/10 Moderate 3 unhealthy d/yr today · 4 by 30 yrs out
Nearby sold comps map
Loading sold comps map…
Walkable amenities ~0.75 mi
Loading nearby amenities…
Taxation est. · year 1
- Rental income
- $26,802
- − Mortgage interest
- −$9,803
- − Property taxes
- −$2,037
- − Insurance
- −$875
- − Repairs & maintenance
- −$2,144
- − Management
- −$2,144
- − Depreciation
- −$5,091
- Taxable income
- $4,708
- Est. tax owed @ 24.0%
- −$1,130
- After-tax cash flow
- $6,119/yr
For passive investors: Depreciation is non-cash, so a rental often shows a tax loss while cash-flowing — sheltering income. Rental losses are passive: they offset passive income freely, and up to $25,000/yr can offset ordinary (W-2) income if you actively participate and your MAGI is under $100k (phasing out to $0 by $150k); unused losses carry forward. On sale, claimed depreciation is recaptured at up to 25%, and gains may owe capital-gains tax (a 1031 exchange can defer both). Figures are a year-1 estimate at your 24.0% rate — not tax advice; consult a CPA.
Schools (NCES district)
- District
- Baltimore City Public Schools
- NCES district ID
- 2400090
- Math proficiency
- 7% ▼ -9.00%
- Reading proficiency
- 16% ▼ -5.00%
- Median HH income
- $42,108
- Composite
- 10.08/100
- National rank
- #9805
- State rank
- #24 of 24 in MD
Livability — Baltimore
- Score
- 76/100
- State rank
- #90
- US rank
- #3396
Category grades
Schools grade is shown separately in the Schools card above.
Census & demographics
- Census place
- Baltimore, MD
- County
- Baltimore City · 558,601 people
- City population
- 588,727
- Metro
- Baltimore-Columbia-Towson, MD
- Population (ZIP)
- 52,229
- Household income
- $51,587
- Rent vs Own
- Severe rent burden
- 3644.0
Population outlook (Baltimore County) Hauer SSP2
- Today (2025)
- 624,249 people
- By 2030
- 621,541 · -0.4%
- By 2040
- 609,756 · -2.3%
- By 2050
- 597,249 · -4.3%
- By 2075
- 552,236 · -11.5%
- By 2100
- 513,934 · -17.7%
Race, ethnicity, and origin ACS 2023
- Neighborhood character
- Predominantly Black (73%)
- Race & ethnicity
- Black 73% White 17% Hispanic / Latino 5% Two or more races 4% Asian 1%
- Common ancestry
- Scotch-Irish 2% Romanian 2% Italian 1%
- Foreign-born
- 9% · Canada, South Korea
- Languages at home
- 91% English-only · Spanish 4% French/Haitian/Cajun 1% Other Indo-European 1%
Political lean MEDSL · Baltimore
- 2024 margin
- Solid D (+73.0) · D 85.2% · R 12.2% · Other 2.6%
- 2008→2024 swing
- -2.5pp toward R · 2008: 75.5pp · 2024: 73.0pp
- All cycles
- 2024: D+73.0 2020: D+76.6 2016: D+74.6 2012: D+76.4 2008: D+75.5
Not yet ingested
- Civics
- —
Market trends
- HPI YoY
- ▼ -318.58%
- Current HPI
- 291.4926
- Rent YoY
- ▲ 2.41%
- Metro
- Baltimore-Columbia-Towson, MD
- State GDP YoY
- ▲ 2.97%
- F500 in state
- 12
Industry mix (Fortune 500 HQ in MD)
| Industry | F500 HQs | Revenue |
|---|---|---|
| Aerospace / Defense | 1 | $71B |
|
||
| Utilities | 1 | $25B |
|
||
| Hotels | 1 | $24B |
|
||
| Consumer Goods | 1 | $7B |
|
||
| Real Estate | 1 | $6B |
|
||
| Chemicals | 1 | $2B |
|
||
Price history
+1258.9% since first listed25 events — show timeline
- 2026-06-17 Listed $175,000 BRIGHT MLS
- 2025-08-01 Listing Removed — BRIGHT MLS
- 2025-07-22 Listed $175,000 BRIGHT MLS
- 2025-07-22 Listing Removed — BRIGHT MLS
- 2025-07-07 Price Changed $175,000 BRIGHT MLS
- 2025-05-29 Price Changed $183,500 BRIGHT MLS
- 2025-05-07 Price Changed $189,900 BRIGHT MLS
- 2025-04-14 Listed $199,999 BRIGHT MLS
- 2025-04-07 Coming Soon — BRIGHT MLS
- 2024-07-25 Sold (Public Records) $115,500 Public Records
- 2024-06-28 Sold (MLS) $115,500 BRIGHT MLS
- 2024-05-17 Pending — BRIGHT MLS
- 2024-03-14 Listed $55,000 BRIGHT MLS
- 2023-08-02 Pending — BRIGHT MLS
- 2023-08-02 Listing Removed — BRIGHT MLS
- 2023-06-30 Listed $45,000 BRIGHT MLS
- 2021-02-26 Sold (Public Records) $5,274 Public Records
- 2021-02-12 Sold (Public Records) $41,250 Public Records
- 2021-02-05 Sold (Public Records) $5,551 Public Records
- 2020-10-06 Sold (Public Records) $12,009 Public Records
- 2020-09-04 Sold (MLS) $41,250 BRIGHT MLS
- 2020-08-12 Sold (Public Records) $3,144 Public Records
- 2020-07-22 Pending — BRIGHT MLS
- 2020-07-08 Listed $20,000 BRIGHT MLS
- 2020-01-30 Sold (Public Records) $12,878 Public Records
Property tax history
+12.3%/yrLatest (2025): $2,037 · +33.2% YoY. Source: county tax records.
Cash-flow waterfall
monthlySold comps — $/sqft
last 12 mo · ≤1 miLoading sold comps…