None · Lindale, GA
Flood risk 1/10 · Minimal
- FEMA flood zone
- X (unshaded)
- Chance of flooding over 30 yrs
- 0.0%
- Est. flood insurance / yr
- $507 – $1,088
Fire risk 4/10 · Minor
- Est. fire insurance / yr
- $963 – $1,789
Heat risk 6/10 · Moderate
- Hot days now (above 104°F)
- 7 days/yr
- Hot days in 30 yrs
- 19 days/yr
Wind risk 4/10 · Minor
- Chance of severe wind over 30 yrs
- 18.0%
Air-quality risk 2/10 · Minimal
- Unhealthy air days now
- 2 days/yr
- Unhealthy air days in 30 yrs
- 2 days/yr
Risk factors via First Street. Map © Google.
Why this score? — see what drove the B+ grade
The composite is a weighted blend of 9 inputs, each scored 0–100. Each bar is that input's sub-score; the figure is the points it added to the 100-point composite (weight × sub-score).
- Cash flow +30.0/30.0
- ARV discount +15.0/15.0
- 1% rule +10.0/10.0
- DSCR +10.0/10.0
- Schools +3.5/10.0
- Livability +3.0/5.0
- Rent growth +2.5/5.0
- Condition / age +2.5/5.0
- Appreciation +0.0/10.0
$150,000
🖨 Deal sheet 📄 Offer letter ✓ Due diligence
Listing remarks MLS
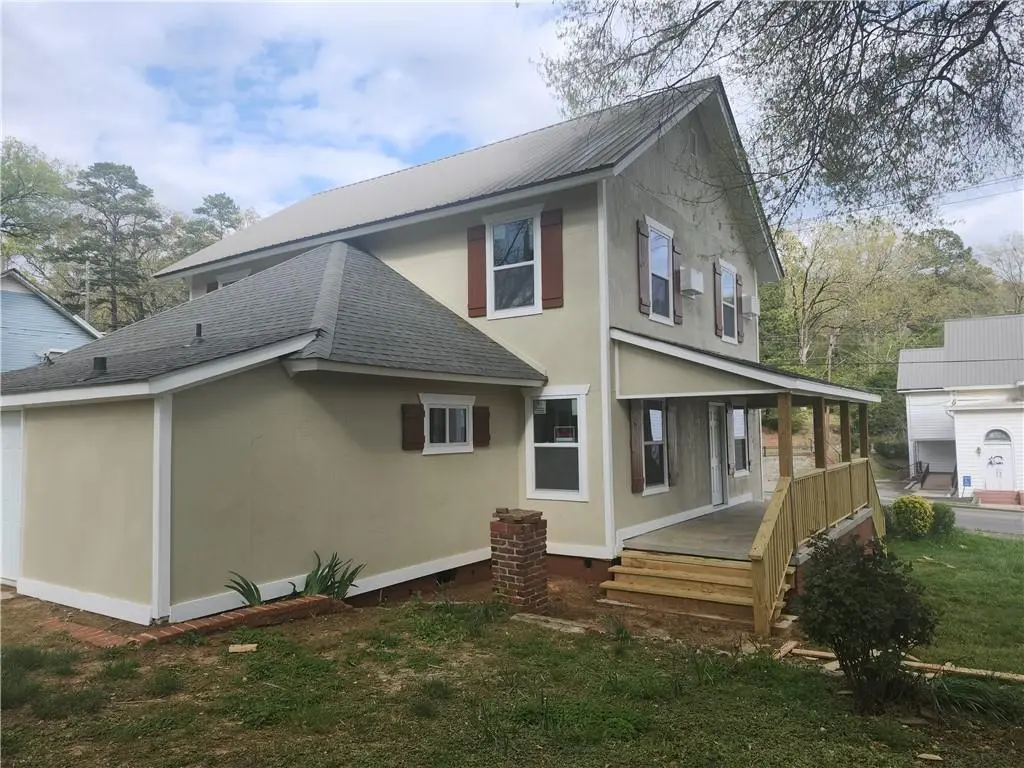
Cash or conventional only Investor special Needs inside completed with sheetrock and flooring etc. 2 bed/1 bath on each side Outside has been completely renovated
Key facts
- 0.26 acre lot
- Built 1920
- Listed 74 days
Neighborhood map
What this means for you Summary
Snapshot
- This is a 4-bed/2.0-bath single-family listed at $150k.
Deal economics
- At list price, monthly cash flow is $1k ($13k/yr) — positive.
- The deal already cash-flows at list — no discount required.
- Meets the 1% rule at list price ($2k rent vs $150k).
- Recommended offer: $141k (6.0% below list) — sets the bar for market timing.
- Cap rate 14.7% vs local median 3.2% in Lindale — top-decile yield for the area; either an underpriced asset or a hidden risk that comps aren't pricing in. Stress-test before assuming the spread holds.
Location & tenants
- Location reads 59/100 on livability (#411 in GA) — a working-class tenant base; expect higher turnover. Strengths: cost of living A+, housing A+; Watch: crime C-, schools F, amenities F.
- Floyd County (rural): math 41% / reading 40% proficiency, ranked #45 of 174 in GA (top 26%) — families likely to look elsewhere, expect single-tenant / working-renter base with shorter leases.
- Market conditions: 39 active listings in the ZIP; 1 comparable units currently listed for rent nearby; 355 units permitted in Floyd County in 2024 (0 in 5+ unit buildings).
Forward outlook
- Local home prices are declining (-3.0%/yr); year-one equity from $1k of loan paydown is wiped out by about $4k of value loss. Plan a longer hold.
- Floyd County population projected to shrink 6% by 2050 — rents likely to lag national; underwrite the cash flow, not the appreciation.
- At projected returns (-3.0% appreciation + 3.0% rent growth), your $42k cash investment doubles in ~5 years — after that, you're playing with house money.
Negotiation context
- It's been on market 74 days — a 6% lower offer ($141k) is reasonable based on typical stale-listing flexibility.
- 3 sale attempts since 3y ago; this cycle's ask has dropped $20k (12%) from the opening price — seller is motivated, your offer sets the floor, not the list.
- Current owner paid $115k; 30% above their basis — modest negotiation headroom, anchor on the comps not their cost.
Risks & watch-outs
- Watch-outs: built in 1920 — expect roof / HVAC / electrical / plumbing capex.
- Climate carrying-cost: extreme-heat days projected 7→19/yr by 2055 (HVAC capex compounding) — expect insurance premiums to compound above CPI over the hold.
Questions for the listing agent
- It's been on market 74 days. Have you received any prior offers? Is the seller open to a 6% concession, seller financing, or rate buy-down credit?
- Built in 1920 — when were the roof, HVAC, electrical panel, plumbing, and water heater last replaced?
- Why hasn't it sold? Are there any deal-killer items the seller is aware of (foundation, flood, title, zoning, code violations)?
- Is there a deadline driving the sale (1031 exchange, divorce, estate, relocation)? That informs how much negotiation room exists.
- Schools are F-rated, which usually means shorter tenancies and higher turnover. Who's the typical renter profile here, and what's been the actual vacancy rate?
- What's the average days-on-market for RENTAL listings here right now (not sales)? A rising rental-DOM trend means longer vacancies and softer asking-rent achievability than the comps imply.
- What's the recent tenant-quality profile in this submarket — average credit score on applications, eviction rate, late-payment / NSF rate, and stable-employment percentage? A property-management company in the area should have these aggregated.
- How much new for-sale + rental construction is in the pipeline within 1–3 miles? Heavy new supply typically softens prices + rents 12–24 months out; constrained supply supports both.
Investment metrics
- 1% rule
- 1.67% ✓
- Cap rate
- 14.68%
- Cash-on-cash
- 29.95%
- DSCR
- 2.33
- GRM
- 5.0
CMA / ARV
- ARV (median comp)
- $218,043
- List price
- $150,000
- Delta
- -31.21%
- Verdict
- UNDERPRICED
- Comps
- 20 within 1.0 mi
Show comp detail 6 sales within ~0.75 mi
| Address | Dist | Beds/Ba | Sqft | Sold | Price | $/sf | Match |
|---|---|---|---|---|---|---|---|
| 3419 Maple Rd SE | 0.08mi | 5/1.5 (+1) | 2,196 (-0%) | 11mo | $72,500 | $33 | 79 |
| 220 Avenue D | 0.16mi | 5/2.0 (+1) | 2,037 (-8%) | 4mo | $99,900 | $49 | 72 |
| 16 Summit Dr SE | 0.45mi | 3/3.0 (-1) | 2,200 (-0%) | 2mo | $309,000 | $140 | 68 |
| 17 N Terrace Ave SE | 0.50mi | 3/2.0 (-1) | 2,076 (-6%) | 3mo | $257,000 | $124 | 60 |
| 84 Nelson St SE | 0.65mi | 3/2.0 (-1) | 2,121 (-4%) | 20mo | $170,000 | $80 | 42 |
| 198 Sunset Dr SE | 0.38mi | 3/3.0 (-1) | 1,905 (-14%) | 20mo | $365,000 | $192 | 34 |
Match score weights: distance 35% · size 25% · config 20% · recency 20%. Top-matched comps best support the ARV.
Projected returns pro-forma
-3.0% appreciation · 3.0% rent growth · sell at horizon
- IRR
- 24.5%
- Equity multiple
- 2.01×
- Total profit
- $42,427
- Equity at exit
- $22,365
- IRR
- 32.3%
- Equity multiple
- 3.92×
- Total profit
- $122,792
- Equity at exit
- $12,969
Cash invested: $42,000 (down + closing). Projections, not guarantees.
Landlord ↔ Tenant lean methodology
- Overall (STATE)
- 90 Strongly Landlord-Friendly
- State Georgia
- 90 Strongly Landlord-Friendly · R+3
- County
- — inherits STATE
- City
- — inherits STATE
ZIP-level market 30147
- Home prices YoY
- -14.3%
- Active inventory
- 39
- Price-to-rent
- 5.0×
Monthly cashflow live
- Estimated rent
- $2,500 medium interval (Pro) →
- Mortgage (P&I)
- −$787
- Tax from tax record
- −$78 /mo · $932/yr
- Insurance
- −$62
- HOA
- −$0
- Vacancy / Maint / Mgmt
- −$525
- Net cashflow
- $1,048
Break-even live
UW: 25.0% down · 7.5% · 30yr · 1.5% tax · 5.0% vac · 8.0% maint · 8.0% mgmt
Financing live
Cash to close
- Down payment
- $37,500
- Closing costs
- $4,500
- Reserves months
- —
- Total cash needed
- —
Loan-product check · same deal, 3 products live
Conventional
25% down · 7.5% · 30yr
- Down + closing
- —
- Monthly P&I
- —
- Monthly cashflow
- —
- DSCR
- —
- Eligible?
- —
Personal DTI + credit; lowest rate.
DSCR
20% down · 8.5% · 30yr
- Down + closing
- —
- Monthly P&I
- —
- Monthly cashflow
- —
- DSCR
- —
- Eligible?
- —
No personal income docs; deal must DSCR.
Hard money
10% down · 12.0% · 12mo
- Down + closing
- —
- Monthly P&I
- —
- Monthly cashflow
- —
- DSCR
- —
- Eligible?
- —
Short-term bridge; refi at stabilization.
Rent comps 1 comps
| Address | Beds | Baths | Sqft | Rent | $/sqft | DOM | Units | Dist |
|---|---|---|---|---|---|---|---|---|
| 59 Bennett Way SE Rome, GA | 4.0 | 2.5 | 2400 | $2,500 | $1.04 | 44d | 1 | 1.05mi |
Listing history 23 events
-
2026-06-19days on market $150,000 Active 74 DOM
-
2026-06-18days on market $150,000 Active 73 DOM
-
2026-06-17days on market $150,000 Active 72 DOM
-
2026-06-16days on market $150,000 Active 71 DOM
-
2026-06-15days on market $150,000 Active 70 DOM
-
2026-06-14days on market $150,000 Active 68 DOM
-
2026-06-13days on market $150,000 Active 67 DOM
-
2026-06-10days on market $150,000 Active 65 DOM
-
2026-06-09days on market $150,000 Active 64 DOM
-
2026-06-08days on market $150,000 Active 63 DOM
-
2026-06-07pricedays on market $150,000 Active 62 DOM
-
2026-06-03days on market $170,000 Active 58 DOM
-
2026-06-02days on market $170,000 Active 57 DOM
-
2026-06-01days on market $170,000 Active 56 DOM
-
2026-05-31days on market $170,000 Active 55 DOM
-
2026-05-30days on market $170,000 Active 54 DOM
-
2026-04-05$170,000 New 167-char remark
Show marketing remark (1223 chars)
Welcome to this investor's dream, a charming duplex offering endless potential. As you step through the front door, envision the possibilities in the spacious living room, where natural light pours in, creating a warm and inviting atmosphere. Each side of this duplex feature two bedrooms and a bathroom, providing ample space for comfort and privacy. The interior awaits your creative vision, with the opportunity to complete it with sheetrock and flooring to suit your style. Imagine crafting a cozy retreat that reflects your taste and preferences. The exterior has been completely renovated, showcasing a fresh and modern appeal that enhances the property's curb appeal. Located conveniently close to shopping and dining options, this property offers the perfect blend of tranquility and accessibility. Just a short drive away, you'll find a variety of restaurants and retail stores, making everyday errands and leisure activities a breeze. This is a cash or conventional opportunity not to be missed, ideal for those looking to invest in a property with great potential. Embrace the chance to create a unique living space in a location that combines convenience with the charm of a well-established neighborhood.
-
2026-04-05$170,000 Active 1223-char remark
Show marketing remark (1223 chars)
Welcome to this investor's dream, a charming duplex offering endless potential. As you step through the front door, envision the possibilities in the spacious living room, where natural light pours in, creating a warm and inviting atmosphere. Each side of this duplex feature two bedrooms and a bathroom, providing ample space for comfort and privacy. The interior awaits your creative vision, with the opportunity to complete it with sheetrock and flooring to suit your style. Imagine crafting a cozy retreat that reflects your taste and preferences. The exterior has been completely renovated, showcasing a fresh and modern appeal that enhances the property's curb appeal. Located conveniently close to shopping and dining options, this property offers the perfect blend of tranquility and accessibility. Just a short drive away, you'll find a variety of restaurants and retail stores, making everyday errands and leisure activities a breeze. This is a cash or conventional opportunity not to be missed, ideal for those looking to invest in a property with great potential. Embrace the chance to create a unique living space in a location that combines convenience with the charm of a well-established neighborhood.
-
2023-09-01soldstatus $115,000
-
2023-07-06soldstatus $70,000 Sold
-
2023-06-24status Under Contract
-
2023-06-21$89,900 New
-
2001-03-30soldstatus $50,000
ⓘ Source: listings_history table (triggers on properties + properties_extension) + one-shot
backfill from property_details.listing_events for pre-trigger history.
Tax reassessment forecast GA · Resets to sale price
- Current annual tax
- $932 · $78/mo
- Projected year-2 tax
- $1,380 · $115/mo
- Expected delta
- +$448/yr (+$37/mo · 48.1%)
ⓘ Screening estimate from a state-policy table — verify with the county assessor before closing.
Climate risk First Street
- Flood 1/10 Low FEMA zone X (unshaded) · 0% chance over 30 yrs
- Wildfire 4/10 Moderate
- Heat 6/10 Major 7 d/yr ≥104°F today · 19 d/yr by 30 yrs out
- Wind 4/10 Moderate 18% chance of damaging wind over 30 yrs
- Air quality 2/10 Low 2 unhealthy d/yr today · 2 by 30 yrs out
Nearby sold comps map
Loading sold comps map…
Walkable amenities ~0.75 mi
Loading nearby amenities…
Taxation est. · year 1
- Rental income
- $30,000
- − Mortgage interest
- −$8,402
- − Property taxes
- −$932
- − Insurance
- −$750
- − Repairs & maintenance
- −$2,400
- − Management
- −$2,400
- − Depreciation
- −$4,364
- Taxable income
- $10,752
- Est. tax owed @ 24.0%
- −$2,581
- After-tax cash flow
- $9,998/yr
For passive investors: Depreciation is non-cash, so a rental often shows a tax loss while cash-flowing — sheltering income. Rental losses are passive: they offset passive income freely, and up to $25,000/yr can offset ordinary (W-2) income if you actively participate and your MAGI is under $100k (phasing out to $0 by $150k); unused losses carry forward. On sale, claimed depreciation is recaptured at up to 25%, and gains may owe capital-gains tax (a 1031 exchange can defer both). Figures are a year-1 estimate at your 24.0% rate — not tax advice; consult a CPA.
Schools (NCES district)
- District
- Floyd County
- NCES district ID
- 1302190
- Math proficiency
- 41% ▼ -5.00%
- Reading proficiency
- 40% ▼ -4.00%
- Median HH income
- $47,083
- Composite
- 34.64/100
- National rank
- #5143
- State rank
- #45 of 174 in GA
Livability — Lindale
- Score
- 59/100
- State rank
- #411
- US rank
- #20340
Category grades
Schools grade is shown separately in the Schools card above.
Census & demographics
- Census place
- Lindale, GA
- Population (ZIP)
- 4,855
Population outlook (Floyd County) Hauer SSP2
- Today (2025)
- 96,321 people
- By 2030
- 95,532 · -0.8%
- By 2040
- 93,332 · -3.1%
- By 2050
- 90,850 · -5.7%
- By 2075
- 84,989 · -11.8%
- By 2100
- 76,097 · -21.0%
Race, ethnicity, and origin ACS 2023
- Neighborhood character
- Predominantly White (93%)
- Race & ethnicity
- White 93% Hispanic / Latino 5% Two or more races 2%
- Hispanic origin (detail)
- Mexican 4%
- Common ancestry
- Serbian 2% Italian 1% Romanian 1%
- Foreign-born
- 2% · Canada
- Languages at home
- 96% English-only · Spanish 4%
Political lean MEDSL · Floyd
- 2024 margin
- Solid R (+42.0) · D 28.8% · R 70.7%
- 2008→2024 swing
- -5.6pp toward R · 2008: -36.4pp · 2024: -42.0pp
- All cycles
- 2024: R+42.0 2020: R+41.1 2016: R+43.5 2012: R+39.9 2008: R+36.4
Not yet ingested
- Civics
- —
Market trends
- HPI YoY
- ▼ -45.07%
- Current HPI
- 269.7475
- Rent YoY
- —
- Metro
- —
- State GDP YoY
- ▲ 2.66%
- F500 in state
- 28
Industry mix (Fortune 500 HQ in GA)
| Industry | F500 HQs | Revenue |
|---|---|---|
| Paper / Packaging | 2 | $29B |
|
||
| Retail | 1 | $160B |
|
||
| Transportation / Logistics | 1 | $91B |
|
||
| Airlines | 1 | $62B |
|
||
| Consumer Goods | 1 | $47B |
|
||
| Utilities | 1 | $25B |
|
||
Price history
+240.0% since first listed7 events — show timeline
- 2026-04-05 Listed $170,000 FMLS
- 2026-04-05 Listed $170,000 GAMLS
- 2023-09-01 Sold (Public Records) $115,000 Public Records
- 2023-07-06 Sold (MLS) $70,000 GAMLS
- 2023-06-24 Pending — GAMLS
- 2023-06-21 Listed $89,900 GAMLS
- 2001-03-30 Sold (Public Records) $50,000 Public Records
Property tax history
+13.2%/yrLatest (2025): $932 · +12.0% YoY. Source: county tax records.
Cash-flow waterfall
monthlySold comps — $/sqft
last 12 mo · ≤1 miLoading sold comps…