 Multi-family
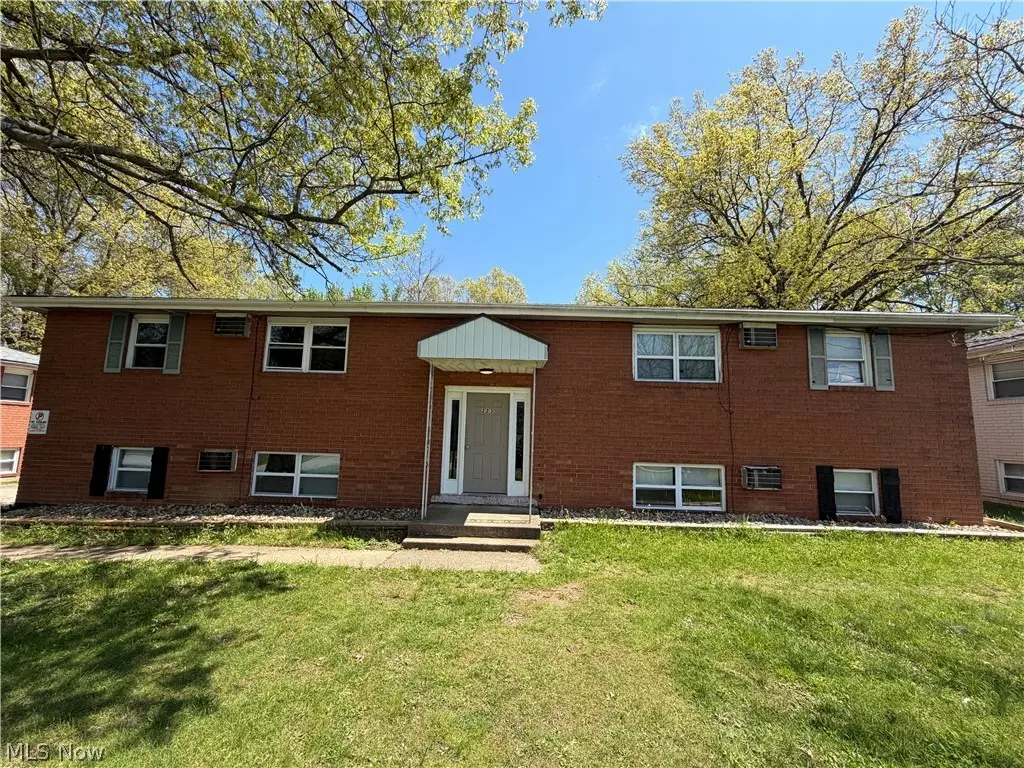
223 Kendall Ave · Campbell, OH
Flood risk 1/10 · Minimal
- FEMA flood zone
- X (unshaded)
- Chance of flooding over 30 yrs
- 0.0%
- Est. flood insurance / yr
- $507 – $1,088
Fire risk 1/10 · Minimal
- Est. fire insurance / yr
- $713 – $1,323
Heat risk 2/10 · Minimal
- Hot days now (above 96°F)
- 7 days/yr
- Hot days in 30 yrs
- 16 days/yr
Wind risk 1/10 · Minimal
- Chance of severe wind over 30 yrs
- —
Air-quality risk 3/10 · Minor
- Unhealthy air days now
- 1 days/yr
- Unhealthy air days in 30 yrs
- 4 days/yr
Risk factors via First Street. Map © Google.
Why this score? — see what drove the B+ grade
The composite is a weighted blend of 9 inputs, each scored 0–100. Each bar is that input's sub-score; the figure is the points it added to the 100-point composite (weight × sub-score).
- Cash flow +30.0/30.0
- 1% rule +10.0/10.0
- DSCR +10.0/10.0
- Appreciation +10.0/10.0
- ARV discount +7.5/15.0
- Livability +3.6/5.0
- Schools +2.6/10.0
- Rent growth +2.5/5.0
- Condition / age +2.5/5.0
$237,527
🖨 Deal sheet 📄 Offer letter ✓ Due diligence
Multi-family units
County records classify this as Multi-Family (5+ Unit). Listing-text estimate: 1 unit. estimate disagrees with records
5+ unit building — per-unit beds/baths from public records are typically unavailable; the breakdown below (if shown) is an estimate from the listing text.
Listing remarks MLS
Four units, each 2 bedroom, 1 bath.
Key facts
- Updated kitchens
- Solid brick exterior
- 0.23 acre lot
Tags
Property features AI
Finance
- Other: Owner pays gas, sewer, taxes, trash collection, and water; tenants pay electricity
- Financial info: Gross income: $39,000; Reported unit rents: $700 and $850 for listed two-bedroom units
Exterior
- Parking: Has garage; Has carport with 4 carport spaces; Carport and paved parking
- Utilities: Public water; Public sewer
- Home design: 2-story building; One building on the lot
- Construction: Brick construction; Asphalt/fiberglass roof
- Exterior features: Paved parking
Interior
- Kitchen: Range; Refrigerator
- Bedrooms: Two-bedroom units
- Bathrooms: Each unit has 1 full bathroom (total 4 full bathrooms in the building)
- Heating & cooling: Gas heating; Hot water heating; Steam heating
- Interior features: Two 2-bedroom units (each with 1 bathroom); Gross annual income reported as $39,000
- Laundry & utility: Tenant pays electricity; owner pays gas, water, sewer, trash collection, and taxes
Neighborhood map
What this means for you Summary
Snapshot
- This is a 8-bed/4.0-bath multifamily listed at $238k.
Deal economics
- At list price, monthly cash flow is $1k ($15k/yr) — positive.
- The deal already cash-flows at list — no discount required.
- Meets the 1% rule at list price ($4k rent vs $238k).
Location & tenants
- Location reads 71/100 on livability (#425 in OH) — a middle-class / working-renter tenant base. Strengths: commute A+, cost of living A+, housing A+; Watch: crime C-, schools D, amenities F.
- Campbell City (suburban): math 28% / reading 35% proficiency, ranked #580 of 656 in OH (top 88%) — families likely to look elsewhere, expect single-tenant / working-renter base with shorter leases; 80% free/reduced lunch — lower-income household profile, screen leases tightly.
- Market conditions: 21 active listings in the ZIP; lower-income renter base — watch delinquency; 147 units permitted in Mahoning County in 2024 (0 in 5+ unit buildings).
- At $3,682/mo this rent would consume 107% of the median local household income ($41k/yr) (locally 19% of renters already pay >50% of income on rent) — very limited rent-growth headroom before tenants either downsize or default.
Forward outlook
- In year one you build about $25k of equity ($2k loan paydown + $24k appreciation (10.0% local appreciation)).
- Mahoning County population projected at -14% by 2050 — secular population decline; favor cash flow + early exit over multi-decade hold.
- At projected returns (10.0% appreciation + 3.0% rent growth), your $67k cash investment doubles in ~2 years — after that, you're playing with house money.
- By year 2, paydown + projected appreciation supports a ~$41k cash-out refi (75% LTV) — recoverable capital for the next deal without selling this one.
Negotiation context
- Only 2 days on market — expect competitive offers; lowballing is unlikely to land.
- 5 sale attempts since 26y ago with the ask held roughly flat each time — persistent listings suggest the price (not the market) is what's stuck; bring a comps-based counter.
- Current owner paid $44k; list at $238k implies a 434% gain — meaningful room to come down on a strong offer.
Questions for the listing agent
- Built in 1971 — when were the roof, HVAC, electrical panel, plumbing, and water heater last replaced?
- Is there a deadline driving the sale (1031 exchange, divorce, estate, relocation)? That informs how much negotiation room exists.
- Schools are D-rated, which usually means shorter tenancies and higher turnover. Who's the typical renter profile here, and what's been the actual vacancy rate?
- What's the average days-on-market for RENTAL listings here right now (not sales)? A rising rental-DOM trend means longer vacancies and softer asking-rent achievability than the comps imply.
- What's the recent tenant-quality profile in this submarket — average credit score on applications, eviction rate, late-payment / NSF rate, and stable-employment percentage? A property-management company in the area should have these aggregated.
- How much new apartment / multifamily construction is in the pipeline within 1–3 miles? Heavy new supply (>2% of stock underway) typically softens rents 12–24 months out; light construction supports rent growth.
Investment metrics
- 1% rule
- 1.55% ✓
- Cap rate
- 12.60%
- Cash-on-cash
- 22.53%
- DSCR
- 2.00
- GRM
- 5.4
CMA / ARV
No comps found within radius.
Projected returns pro-forma
10.0% appreciation · 3.0% rent growth · sell at horizon
- IRR
- 41.2%
- Equity multiple
- 4.14×
- Total profit
- $208,969
- Equity at exit
- $213,983
- IRR
- 35.5%
- Equity multiple
- 9.31×
- Total profit
- $552,964
- Equity at exit
- $461,463
Cash invested: $66,508 (down + closing). Projections, not guarantees.
Landlord ↔ Tenant lean methodology
- Overall (STATE)
- 73 Landlord-Friendly
- State Ohio
- 73 Landlord-Friendly · R+6
- County
- — inherits STATE
- City
- — inherits STATE
ZIP-level market 44405
- Home prices YoY
- 26.4%
- Active inventory
- 21
- Price-to-rent
- 21.5×
Monthly cashflow live
- Estimated rent
- $3,682 medium interval (Pro) →
- Mortgage (P&I)
- −$1,246
- Tax from tax record
- −$315 /mo · $3,784/yr
- Insurance
- −$99
- HOA
- −$0
- Vacancy / Maint / Mgmt
- −$773
- Net cashflow
- $1,249
Break-even live
4-unit breakdown (identical units grouped — click to expand)
| Units | Beds | Baths | Est. rent |
|---|---|---|---|
| 4× units | 2 | 1 | $3,680 |
| #1 | 2 | 1 | $920 |
| #2 | 2 | 1 | $920 |
| #3 | 2 | 1 | $920 |
| #4 | 2 | 1 | $920 |
| Total (4 units) | $3,682 | ||
UW: 25.0% down · 7.5% · 30yr · 1.5% tax · 5.0% vac · 8.0% maint · 8.0% mgmt
Financing live
Cash to close
- Down payment
- $59,382
- Closing costs
- $7,126
- Reserves months
- —
- Total cash needed
- —
Loan-product check · same deal, 3 products live
Conventional
25% down · 7.5% · 30yr
- Down + closing
- —
- Monthly P&I
- —
- Monthly cashflow
- —
- DSCR
- —
- Eligible?
- —
Personal DTI + credit; lowest rate.
DSCR
20% down · 8.5% · 30yr
- Down + closing
- —
- Monthly P&I
- —
- Monthly cashflow
- —
- DSCR
- —
- Eligible?
- —
No personal income docs; deal must DSCR.
Hard money
10% down · 12.0% · 12mo
- Down + closing
- —
- Monthly P&I
- —
- Monthly cashflow
- —
- DSCR
- —
- Eligible?
- —
Short-term bridge; refi at stabilization.
Listing history 14 events
-
2026-05-05status Pending
-
2026-05-03$237,527 Active
-
2019-02-21soldstatus $44,500
-
2018-04-26soldstatus $21,900 Sold 35-char remark
Show marketing remark (35 chars)
Four units, each 2 bedroom, 1 bath.
-
2018-04-26soldstatus $21,900
Show marketing remark (35 chars)
Four units, each 2 bedroom, 1 bath.
-
2018-04-12status Pending 35-char remark
Show marketing remark (35 chars)
Four units, each 2 bedroom, 1 bath.
-
2018-04-10$20,000 Active 35-char remark
Show marketing remark (35 chars)
Four units, each 2 bedroom, 1 bath.
-
2012-03-05historical
-
2011-11-10$59,000
-
2003-07-23soldstatus $136,800
-
2002-09-16soldstatus $148,500
-
2001-02-19$105,000
-
2000-12-18historical
-
2000-08-24$125,000
ⓘ Source: listings_history table (triggers on properties + properties_extension) + one-shot
backfill from property_details.listing_events for pre-trigger history.
Tax reassessment forecast OH · Partial reset (capped growth)
- Current annual tax
- $3,784 · $315/mo
- Projected year-2 tax
- $3,784 · $315/mo
- Expected delta
- $0/yr ($0/mo · 0.0%)
ⓘ Screening estimate from a state-policy table — verify with the county assessor before closing.
Climate risk First Street
- Flood 1/10 Low FEMA zone X (unshaded) · 0% chance over 30 yrs
- Wildfire 1/10 Low
- Heat 2/10 Low 7 d/yr ≥96°F today · 16 d/yr by 30 yrs out
- Wind 1/10 Low
- Air quality 3/10 Moderate 1 unhealthy d/yr today · 4 by 30 yrs out
Nearby sold comps map
Loading sold comps map…
Walkable amenities ~0.75 mi
Loading nearby amenities…
Taxation est. · year 1
- Rental income
- $44,184
- − Mortgage interest
- −$13,305
- − Property taxes
- −$3,784
- − Insurance
- −$1,188
- − Repairs & maintenance
- −$3,535
- − Management
- −$3,535
- − Depreciation
- −$6,910
- Taxable income
- $11,928
- Est. tax owed @ 24.0%
- −$2,863
- After-tax cash flow
- $12,123/yr
For passive investors: Depreciation is non-cash, so a rental often shows a tax loss while cash-flowing — sheltering income. Rental losses are passive: they offset passive income freely, and up to $25,000/yr can offset ordinary (W-2) income if you actively participate and your MAGI is under $100k (phasing out to $0 by $150k); unused losses carry forward. On sale, claimed depreciation is recaptured at up to 25%, and gains may owe capital-gains tax (a 1031 exchange can defer both). Figures are a year-1 estimate at your 24.0% rate — not tax advice; consult a CPA.
Schools (NCES district)
- District
- Campbell City
- NCES district ID
- 3904370
- Math proficiency
- 28% ▼ -11.00%
- Reading proficiency
- 35% ▼ -10.00%
- Median HH income
- $31,251
- Composite
- 25.64/100
- National rank
- #7403
- State rank
- #580 of 656 in OH
Livability — Campbell
- Score
- 71/100
- State rank
- #425
- US rank
- #6961
Category grades
Schools grade is shown separately in the Schools card above.
Census & demographics
- Census place
- Campbell, OH
- County
- Mahoning · 224,175 people
- City population
- 7,834
- Metro
- Youngstown-Warren, OH
- Population (ZIP)
- 7,834
- Household income
- $41,156
- Rent vs Own
- Severe rent burden
- 19.4
Population outlook (Mahoning County) Hauer SSP2
- Today (2025)
- 223,932 people
- By 2030
- 218,387 · -2.5%
- By 2040
- 205,367 · -8.3%
- By 2050
- 193,606 · -13.5%
- By 2075
- 173,694 · -22.4%
- By 2100
- 151,147 · -32.5%
Race, ethnicity, and origin ACS 2023
- Neighborhood character
- Diverse neighborhood (Simpson 0.65)
- Race & ethnicity
- White 50% Hispanic / Latino 25% Black 19% Two or more races 15%
- Hispanic origin (detail)
- Puerto Rican 22%
- Common ancestry
- Romanian 3% Slovak 1% Lithuanian 1%
- Foreign-born
- 4% · Canada
- Languages at home
- 75% English-only · Spanish 14% Other Indo-European 10% Arabic 1%
Political lean MEDSL · Mahoning
- 2024 margin
- Lean R (+9.4) · D 44.9% · R 54.4%
- 2008→2024 swing
- -36.1pp toward R · 2008: 26.6pp · 2024: -9.4pp
- All cycles
- 2024: R+9.4 2020: R+1.9 2016: D+3.0 2012: D+27.7 2008: D+26.6
Not yet ingested
- Civics
- —
Market trends
- HPI YoY
- ▲ 70.82%
- Current HPI
- 338.7174
- Rent YoY
- —
- Metro
- —
- State GDP YoY
- ▲ 1.98%
- F500 in state
- 48
Industry mix (Fortune 500 HQ in OH)
| Industry | F500 HQs | Revenue |
|---|---|---|
| Insurance | 3 | $145B |
|
||
| Industrial Machinery | 3 | $49B |
|
||
| Financial Services | 3 | $24B |
|
||
| Consumer Goods | 2 | $93B |
|
||
| Aerospace / Defense | 2 | $47B |
|
||
| Utilities | 2 | $33B |
|
||
Price history
+90.0% since first listed14 events — show timeline
- 2026-05-05 Pending — MLSNOW
- 2026-05-03 Listed $237,527 MLSNOW
- 2019-02-21 Sold (Public Records) $44,500 Public Records
- 2018-04-26 Sold (Public Records) $21,900 Public Records
- 2018-04-26 Sold (MLS) $21,900 MLSNOW
- 2018-04-12 Pending — MLSNOW
- 2018-04-10 Listed $20,000 MLSNOW
- 2012-03-05 Listing Removed — MLSNOW
- 2011-11-10 Listed $59,000 MLSNOW
- 2003-07-23 Sold (Public Records) $136,800 Public Records
- 2002-09-16 Sold (Public Records) $148,500 Public Records
- 2001-02-19 Listed $105,000 MLSNOW
- 2000-12-18 Listing Removed — MLSNOW
- 2000-08-24 Listed $125,000 MLSNOW
Property tax history
+8.7%/yrLatest (2025): $3,784 · +19.1% YoY. Source: county tax records.
Cash-flow waterfall
monthlySold comps — $/sqft
last 12 mo · ≤1 miLoading sold comps…