 🏗️ New Construction
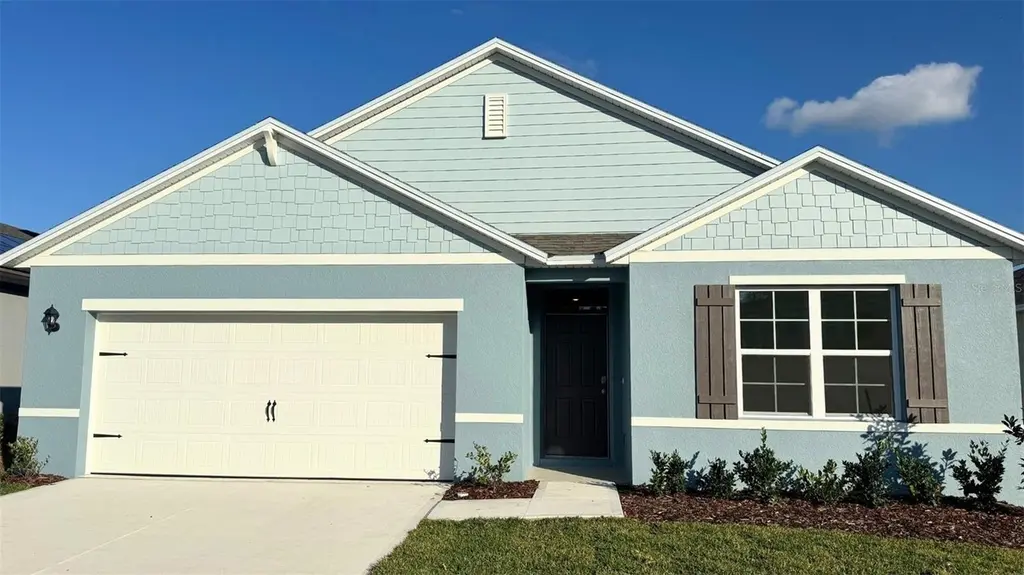
2958 Elio Hammock Dr · St. Cloud, FL
Flood risk No data
- FEMA flood zone
- —
- Chance of flooding over 30 yrs
- —
- Est. flood insurance / yr
- —
Fire risk No data
- Est. fire insurance / yr
- —
Heat risk No data
- Hot days now (above threshold)
- —
- Hot days in 30 yrs
- —
Wind risk No data
- Chance of severe wind over 30 yrs
- —
Air-quality risk No data
- Unhealthy air days now
- —
- Unhealthy air days in 30 yrs
- —
Risk factors via First Street. Map © Google.
Why this score? — see what drove the F grade
The composite is a weighted blend of 9 inputs, each scored 0–100. Each bar is that input's sub-score; the figure is the points it added to the 100-point composite (weight × sub-score).
- ARV discount +7.5/15.0
- Cash flow +7.4/30.0
- Appreciation +4.8/10.0
- Schools +3.6/10.0
- Rent growth +2.9/5.0
- Livability +2.5/5.0
- Condition / age +2.5/5.0
- 1% rule +1.5/10.0
- DSCR +1.5/10.0
$415,990
🖨 Deal sheet (PDF) 📄 Offer letter ✓ Due diligence
Listing remarks
Under Construction. The popular one-story Cali floorplan offers 4-bedrooms, 2-bathrooms, a 2-car garage with 1,882 sq ft of living space. The open layout connects the living room, dining area, and kitchen, ideal for entertaining. The kitchen boasts quartz countertops, stainless-steel appliances, a walk in pantry and a spacious island. The four spacious bedrooms gives flexibility for various lifestyles. The primary suite located in the rear of the home features a private ensuite bathroom with dual sinks, a separate shower, and a walk-in closet. The remaining three bedrooms share one well-appointed bathroom, making morning routines a breeze. Laundry room is convenient to all bedrooms. This al
Key facts
- 8,276 sq ft lot
- 2 garage spots
- Community pool
Neighborhood map
What this means for you Summary
Snapshot
- This is a 4-bed/2.0-bath land listed at $416k.
Deal economics
- At list price, monthly cash flow is $-542 ($-7k/yr) — negative.
- To cash-flow at today's rent, offer at most $320k (23.0% below list).
- To meet the 1% rule (rent ≥ 1% of price), the offer needs to be $269k (35.4% below list).
- Recommended offer: $269k (35.4% below list) — sets the bar for 1% rule.
Location & tenants
- Location reads: area grade F — affects rentability + tenant quality, not the cash-flow math above.
- Osceola (suburban): math 39% / reading 45% proficiency, ranked #60 of 73 in FL (top 82%) — families likely to look elsewhere, expect single-tenant / working-renter base with shorter leases; 60% free/reduced lunch — lower-income household profile, screen leases tightly.
- Zoned schools: Harmony Community School (math 70% / reading 64%, grade B+, #450 of 2,144 statewide, top 22%, 1,012 students, 38% FRL); Narcoossee Middle School (math 55% / reading 57%, grade B-, #175 of 571 statewide, top 31%, 1,371 students, 46% FRL); Harmony High School (math 40% / reading 46%, grade F, #255 of 667 statewide, top 39%, 2,822 students, 42% FRL) — zoned schools average 42% FRL vs 60% district-wide (18 pts lower); this property's tenant base skews higher-income than the district average.
- Zoned-school proficiency averages 55% at this address vs 42% district-wide (+13 pts) — the actual schools serving this property are materially stronger than the Osceola average implies; a family-tenant draw the district grade alone would hide.
- Market conditions: Rents rising (+1.8%/yr); 388 active listings in the ZIP; 10 comparable units currently listed for rent nearby; rentals at typical pace (median 26d on market — plan ~3-4 weeks tenant-placement turnaround); solid renter incomes; 8,813 units permitted in Osceola County in 2024 (3,072 in 5+ unit buildings).
- This rent runs 40% of the median local income ($81k/yr) — at the standard rent-burdened threshold; future hikes will face affordability resistance.
Forward outlook
- In year one you build about $935 of equity ($3k loan paydown + $-2k appreciation (-0.5% local appreciation)).
- Osceola County population projected at +73% by 2050 — long-run rental-demand tailwind backs the buy-and-hold thesis.
Negotiation context
- Only 1 days on market — expect competitive offers; lowballing is unlikely to land.
Questions for the listing agent
- What do current leases actually rent for vs. the listed asking? Can we see a recent rent roll and the last 12 months of T-12 income?
- What does the HOA fee cover, when was the last increase, and are there any pending special assessments or reserve-fund shortfalls?
- Is there a deadline driving the sale (1031 exchange, divorce, estate, relocation)? That informs how much negotiation room exists.
- The area grade is low — what's the realistic commute time and amenity access for the typical tenant pool here? Any planned neighborhood developments (good or bad) we should know about?
- What's the average days-on-market for RENTAL listings here right now (not sales)? A rising rental-DOM trend means longer vacancies and softer asking-rent achievability than the comps imply.
- What's the recent tenant-quality profile in this submarket — average credit score on applications, eviction rate, late-payment / NSF rate, and stable-employment percentage? A property-management company in the area should have these aggregated.
- How much new for-sale + rental construction is in the pipeline within 1–3 miles? Heavy new supply typically softens prices + rents 12–24 months out; constrained supply supports both.
Investment metrics
- 1% rule
- 0.65% ✗
- Cap rate
- 4.73%
- Cash-on-cash
- -5.58%
- DSCR
- 0.75
- GRM
- 12.9
CMA / ARV
No comps found within radius.
Projected returns pro-forma
-0.47% appreciation · 1.79% rent growth · sell at horizon
- IRR
- -11.4%
- Equity multiple
- 0.49×
- Total profit
- $-59,037
- Equity at exit
- $111,176
- IRR
- -5.8%
- Equity multiple
- 0.45×
- Total profit
- $-64,571
- Equity at exit
- $126,189
Cash invested: $116,477 (down + closing). Projections, not guarantees.
Landlord ↔ Tenant lean methodology
- Overall (STATE)
- 87 Strongly Landlord-Friendly
- State Florida
- 87 Strongly Landlord-Friendly · R+3
- County
- — inherits STATE
- City
- — inherits STATE
ZIP-level market 34773
- Home prices YoY
- -0.2%
- Rents YoY
- 1.8%
- Active inventory
- 388
- Price-to-rent
- 12.9×
Monthly cashflow live
- Estimated rent
- $2,686 high interval (Pro) →
- Mortgage (P&I)
- −$2,181
- Tax from tax record
- −$265 /mo · $3,183/yr
- Insurance
- −$173
- HOA
- −$44
- Vacancy / Maint / Mgmt
- −$564
- Net cashflow
- $-542
Break-even live
Sensitivity live
| Price | -10% $-306 | -5% $-424 | +0% $-542 | +5% $-660 | +10% $-777 |
|---|---|---|---|---|---|
| Rent | -10% $-754 | -5% $-648 | +0% $-542 | +5% $-436 | +10% $-330 |
| Rate | -1.0pp $-332 | -0.5pp $-436 | base $-542 | +0.5pp $-650 | +1.0pp $-759 |
UW: 25.0% down · 7.5% · 30yr · 1.5% tax · 5.0% vac · 8.0% maint · 8.0% mgmt
Financing live
Cash to close
- Down payment
- $103,998
- Closing costs
- $12,480
- Reserves months
- —
- Total cash needed
- —
Loan-product check · same deal, 3 products live
Conventional
25% down · 7.5% · 30yr
- Down + closing
- —
- Monthly P&I
- —
- Monthly cashflow
- —
- DSCR
- —
- Eligible?
- —
Personal DTI + credit; lowest rate.
DSCR
20% down · 8.5% · 30yr
- Down + closing
- —
- Monthly P&I
- —
- Monthly cashflow
- —
- DSCR
- —
- Eligible?
- —
No personal income docs; deal must DSCR.
Hard money
10% down · 12.0% · 12mo
- Down + closing
- —
- Monthly P&I
- —
- Monthly cashflow
- —
- DSCR
- —
- Eligible?
- —
Short-term bridge; refi at stabilization.
Rent comps 10 comps
| Address | Beds | Baths | Sqft | Rent | $/sqft | DOM | Units | Dist |
|---|---|---|---|---|---|---|---|---|
| 7110 Sandhill Crane Way Unit 1 St Cloud, FL | 4.0 | 2.0 | 1828 | $2,722 | $1.49 | 26d | 1 | 0.42mi |
| 7086 Cattle Egret Dr Harmony, FL | 3.0 | 2.0 | 1614 | $2,099 | $1.30 | 22d | 1 | 0.47mi |
| 7086 Cattle Egret Dr Harmony, FL | 3.0 | 2.0 | 1620 | $2,299 | $1.42 | 9d | 1 | 0.47mi |
| 6877 Botanic Blvd Harmony, FL | 3.0 | 2.0 | 1570 | $2,500 | $1.59 | 26d | 1 | 0.94mi |
| 6847 Botanic Blvd Harmony, FL | 4.0 | 2.5 | 2306 | $2,600 | $1.13 | 26d | 1 | 0.98mi |
| 2639 Bittern Bnd Harmony, FL | 3.0 | 2.0 | 1758 | $2,395 | $1.36 | 26d | 1 | 1.00mi |
| 6833 Cranes Roost Rd Harmony, FL | 4.0 | 2.0 | 1830 | $2,350 | $1.28 | 26d | 1 | 1.11mi |
| 6792 Huntleigh Hammock Rd Harmony, FL | 4.0 | 2.5 | 2268 | $2,900 | $1.28 | 19d | 1 | 1.35mi |
| 6766 Grace Hammock Rd Harmony, FL | 4.0 | 2.0 | 1828 | $2,400 | $1.31 | 0d | 1 | 1.42mi |
| 6731 Grace Hammock Rd Harmony, FL | 4.0 | 2.5 | 2208 | $2,331 | $1.06 | 9d | 1 | 1.48mi |
HOA detail
- Monthly dues
- $44 · $528/yr
Listing history 2 events
-
2026-04-07status Pending
-
2026-04-07$415,990 Active
ⓘ Source: listings_history table (triggers on properties + properties_extension) + one-shot
backfill from property_details.listing_events for pre-trigger history.
Tax reassessment forecast FL · Resets to sale price
- Current annual tax
- $3,183 · $265/mo
- Projected year-2 tax
- $3,453 · $288/mo
- Expected delta
- +$270/yr (+$22/mo · 8.5%)
ⓘ Screening estimate from a state-policy table — verify with the county assessor before closing.
Nearby sold comps map
Loading sold comps map…
Walkable amenities ~0.75 mi
Loading nearby amenities…
Taxation est. · year 1
- Rental income
- $32,237
- − Mortgage interest
- −$23,302
- − Property taxes
- −$3,183
- − Insurance
- −$2,080
- − Repairs & maintenance
- −$2,579
- − Management
- −$2,579
- − HOA
- −$528
- − Depreciation
- −$12,102
- Taxable loss
- −$14,116
- Est. tax savings @ 24.0%
- +$3,388
- After-tax cash flow
- $-3,114/yr
For passive investors: Depreciation is non-cash, so a rental often shows a tax loss while cash-flowing — sheltering income. Rental losses are passive: they offset passive income freely, and up to $25,000/yr can offset ordinary (W-2) income if you actively participate and your MAGI is under $100k (phasing out to $0 by $150k); unused losses carry forward. On sale, claimed depreciation is recaptured at up to 25%, and gains may owe capital-gains tax (a 1031 exchange can defer both). Figures are a year-1 estimate at your 24.0% rate — not tax advice; consult a CPA.
Schools (NCES district)
- District
- Osceola
- NCES district ID
- 1201470
- Math proficiency
- 39% ▼ -9.00%
- Reading proficiency
- 45% ▼ -4.00%
- Median HH income
- $45,528
- Composite
- 35.7/100
- National rank
- #4865
- State rank
- #60 of 73 in FL
Livability — St. Cloud
No livability data for this city. (Only ~50 U.S. cities are tracked.)
Census & demographics
- County
- Osceola County · 410,217 people
- City population
- 29,247
- Metro
- Orlando-Kissimmee-Sanford, FL
- Population (ZIP)
- 5,816
- Household income
- $80,524
- Rent vs Own
- Severe rent burden
- 47.0
Population outlook (Osceola County) Hauer SSP2
- Today (2025)
- 447,624 people
- By 2030
- 511,823 · +14.3%
- By 2040
- 642,986 · +43.6%
- By 2050
- 774,552 · +73.0%
- By 2075
- 1,078,144 · +140.9%
- By 2100
- 1,269,660 · +183.6%
Race, ethnicity, and origin ACS 2023
- Neighborhood character
- Majority White (59%)
- Race & ethnicity
- White 59% Hispanic / Latino 33% Two or more races 11%
- Hispanic origin (detail)
- Puerto Rican 20%
- Common ancestry
- Portuguese 5% Slovak 3% Romanian 2%
- Foreign-born
- 12% · Canada, South Korea
- Languages at home
- 67% English-only · Spanish 27% Other Indo-European 4% German/W. Germanic 1%
Political lean MEDSL · Osceola
- 2024 margin
- Toss-up / Even · D 48.7% · R 50.2% · Other 1.1%
- 2008→2024 swing
- -21.2pp toward R · 2008: 19.7pp · 2024: -1.4pp
- All cycles
- 2024: R+1.4 2020: D+13.8 2016: D+25.0 2012: D+24.5 2008: D+19.7
Not yet ingested
- Civics
- —
Market trends
- HPI YoY
- ▼ -0.47%
- Current HPI
- 279.5662
- Rent YoY
- ▲ 1.79%
- Metro
- Orlando-Kissimmee-Sanford, FL
- State GDP YoY
- ▲ 3.28%
- F500 in state
- 36
Industry mix (Fortune 500 HQ in FL)
| Industry | F500 HQs | Revenue |
|---|---|---|
| Industrial Technology | 2 | $29B |
|
||
| Insurance | 2 | $17B |
|
||
| Retail | 1 | $60B |
|
||
| Technology Distribution | 1 | $58B |
|
||
| Homebuilding | 1 | $35B |
|
||
| Technology Manufacturing | 1 | $35B |
|
||
Price history
2 events — show timeline
- 2026-04-07 Pending — Stellar MLS as Distributed by MLS Grid
- 2026-04-07 Listed $415,990 Stellar MLS as Distributed by MLS Grid
Cash-flow waterfall
monthlySold comps — $/sqft
last 12 mo · ≤1 miLoading sold comps…