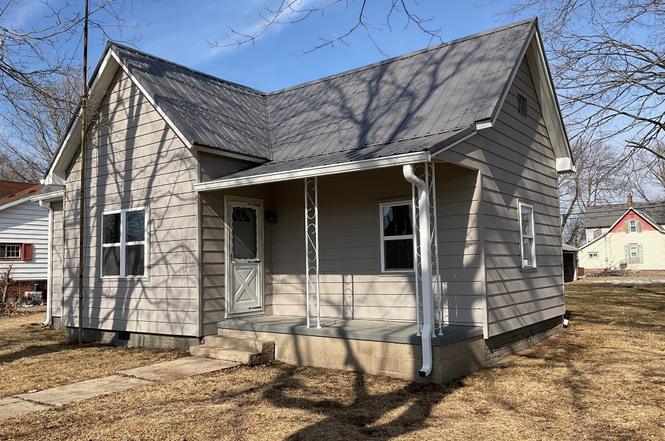
577 E Blue St · Montezuma, IN
Flood risk 1/10 · Minimal
- FEMA flood zone
- X (unshaded)
- Chance of flooding over 30 yrs
- 0.0%
- Est. flood insurance / yr
- $473 – $860
Fire risk 1/10 · Minimal
- Est. fire insurance / yr
- $717 – $1,331
Heat risk 4/10 · Minor
- Hot days now (above 105°F)
- 7 days/yr
- Hot days in 30 yrs
- 18 days/yr
Wind risk 2/10 · Minimal
- Chance of severe wind over 30 yrs
- 1.0%
Air-quality risk 2/10 · Minimal
- Unhealthy air days now
- 1 days/yr
- Unhealthy air days in 30 yrs
- 2 days/yr
Risk factors via First Street. Map © Google.
Why this score? — see what drove the D grade
The composite is a weighted blend of 9 inputs, each scored 0–100. Each bar is that input's sub-score; the figure is the points it added to the 100-point composite (weight × sub-score).
- Cash flow +12.6/30.0
- ARV discount +6.3/15.0
- Appreciation +5.5/10.0
- DSCR +3.7/10.0
- Livability +3.2/5.0
- 1% rule +3.0/10.0
- Schools +3.0/10.0
- Rent growth +2.5/5.0
- Condition / age +2.5/5.0
$109,900
🖨 Deal sheet 📄 Offer letter ✓ Due diligence
Listing remarks
Checkout this nice, updated 2 bedroom home on a large corner lot in Montezuma. Large, spacious rooms throughout plus a nice new kitchen. This home is move in ready. Come take a look!!
Key facts
- 6,970 sq ft lot
- 2 garage spots
- Built 1954
Property features AI
Exterior
- Parking: Detached 2-car garage
- Utilities: Public water; Municipal sewer connected
- Home design: Single family residence; One level
- Construction: Aluminum siding; Block foundation
- Exterior features: Covered patio/porch; Corner city lot
Interior
- Kitchen: Kitchen on main level
- Bedrooms: 2 bedrooms on the main level
- Bathrooms: 1 full bathroom on the main level
- Heating & cooling: Forced air heating (natural gas); Central air conditioning
- Interior features: Updated/remodeled condition; Laundry in unit; Unfinished basement
- Laundry & utility: Laundry in unit
Neighborhood map
What this means for you Summary
Snapshot
- This is a 2-bed/1.0-bath single-family listed at $110k.
Deal economics
- At list price, monthly cash flow is $-15 ($-176/yr) — negative.
- To cash-flow at today's rent, offer at most $107k (2.4% below list).
- To meet the 1% rule (rent ≥ 1% of price), the offer needs to be $88k (19.7% below list).
- Recommended offer: $88k (19.7% below list) — sets the bar for 1% rule.
Location & tenants
- Location reads 65/100 on livability (#314 in IN) — a middle-class / working-renter tenant base. Strengths: cost of living A+, housing A+, health & safety A; Watch: employment C-, crime D+, amenities F.
- Southwest Parke Community School Corporation (rural): math 34% / reading 36% proficiency, ranked #195 of 301 in IN (top 65%) — families likely to look elsewhere, expect single-tenant / working-renter base with shorter leases.
- Zoned schools: Montezuma Elementary School (math 47% / reading 37%, grade F, #434 of 994 statewide, top 48%, 232 students, 66% FRL); Riverton Parke Jr-Sr High School (math 23% / reading 39%, grade F, #303 of 369 statewide, top 82%, 472 students, 53% FRL).
- Market conditions: 10 active listings in the ZIP; 61 units permitted in Parke County in 2024 (0 in 5+ unit buildings).
Forward outlook
- In year one you build about $2k of equity ($760 loan paydown + $1k appreciation (1.1% local appreciation)).
- Parke County population projected at -10% by 2050 — secular population decline; favor cash flow + early exit over multi-decade hold.
- At projected returns (1.1% appreciation + 3.0% rent growth), your $31k cash investment doubles in ~10 years — after that, you're playing with house money.
Negotiation context
- It's been on market 99 days — a 9% lower offer ($100k) is reasonable based on typical stale-listing flexibility.
- 4 sale attempts since 3y ago; this cycle's ask has dropped $10k (8%) from the opening price — seller is motivated, your offer sets the floor, not the list.
Risks & watch-outs
- Watch-outs: built in 1954 — expect roof / HVAC / electrical / plumbing capex.
Questions for the listing agent
- What do current leases actually rent for vs. the listed asking? Can we see a recent rent roll and the last 12 months of T-12 income?
- It's been on market 99 days. Have you received any prior offers? Is the seller open to a 20% concession, seller financing, or rate buy-down credit?
- Built in 1954 — when were the roof, HVAC, electrical panel, plumbing, and water heater last replaced?
- Why hasn't it sold? Are there any deal-killer items the seller is aware of (foundation, flood, title, zoning, code violations)?
- Is there a deadline driving the sale (1031 exchange, divorce, estate, relocation)? That informs how much negotiation room exists.
- Schools are D-rated, which usually means shorter tenancies and higher turnover. Who's the typical renter profile here, and what's been the actual vacancy rate?
- Crime grade is D in this area — have there been break-ins, vandalism, or insurance claims at this property in the last 3 years? What carrier currently insures it and at what premium?
- The area grade is low — what's the realistic commute time and amenity access for the typical tenant pool here? Any planned neighborhood developments (good or bad) we should know about?
- What's the average days-on-market for RENTAL listings here right now (not sales)? A rising rental-DOM trend means longer vacancies and softer asking-rent achievability than the comps imply.
- What's the recent tenant-quality profile in this submarket — average credit score on applications, eviction rate, late-payment / NSF rate, and stable-employment percentage? A property-management company in the area should have these aggregated.
- How much new for-sale + rental construction is in the pipeline within 1–3 miles? Heavy new supply typically softens prices + rents 12–24 months out; constrained supply supports both.
Investment metrics
- 1% rule
- 0.80% ✗
- Cap rate
- 6.13%
- Cash-on-cash
- -0.57%
- DSCR
- 0.97
- GRM
- 10.4
CMA / ARV
- ARV (on-the-fly)
- $106,932
- Comps found
- 2
Show comp detail 2 sales within ~0.75 mi
| Address | Dist | Beds/Ba | Sqft | Sold | Price | $/sf | Match |
|---|---|---|---|---|---|---|---|
| 538 Madison St | 0.17mi | 2/1.0 | 1,066 (+14%) | 14mo | $20,500 | $19 | 58 |
| 143 N Water St | 0.48mi | 2/2.5 | 1,044 (+11%) | 3mo | $119,000 | $114 | 50 |
Match score weights: distance 35% · size 25% · config 20% · recency 20%. Top-matched comps best support the ARV.
Projected returns pro-forma
1.09% appreciation · 3.0% rent growth · sell at horizon
- IRR
- 1.0%
- Equity multiple
- 1.05×
- Total profit
- $1,606
- Equity at exit
- $38,053
- IRR
- 5.6%
- Equity multiple
- 1.70×
- Total profit
- $21,388
- Equity at exit
- $50,986
Cash invested: $30,772 (down + closing). Projections, not guarantees.
Landlord ↔ Tenant lean methodology
- Overall (STATE)
- 90 Strongly Landlord-Friendly
- State Indiana
- 90 Strongly Landlord-Friendly · R+11
- County
- — inherits STATE
- City
- — inherits STATE
ZIP-level market 47862
- Home prices YoY
- 0.5%
- Active inventory
- 10
- Price-to-rent
- 10.4×
Monthly cashflow live
- Estimated rent
- $883 medium interval (Pro) →
- Mortgage (P&I)
- −$576
- Tax from tax record
- −$90 /mo · $1,078/yr
- Insurance
- −$46
- HOA
- −$0
- Vacancy / Maint / Mgmt
- −$185
- Net cashflow
- $-15
Break-even live
UW: 25.0% down · 7.5% · 30yr · 1.5% tax · 5.0% vac · 8.0% maint · 8.0% mgmt
Financing live
Cash to close
- Down payment
- $27,475
- Closing costs
- $3,297
- Reserves months
- —
- Total cash needed
- —
Loan-product check · same deal, 3 products live
Conventional
25% down · 7.5% · 30yr
- Down + closing
- —
- Monthly P&I
- —
- Monthly cashflow
- —
- DSCR
- —
- Eligible?
- —
Personal DTI + credit; lowest rate.
DSCR
20% down · 8.5% · 30yr
- Down + closing
- —
- Monthly P&I
- —
- Monthly cashflow
- —
- DSCR
- —
- Eligible?
- —
No personal income docs; deal must DSCR.
Hard money
10% down · 12.0% · 12mo
- Down + closing
- —
- Monthly P&I
- —
- Monthly cashflow
- —
- DSCR
- —
- Eligible?
- —
Short-term bridge; refi at stabilization.
Listing history 15 events
-
2026-06-03status $109,900 Pending 99 DOM
-
2026-06-02days on market $109,900 Active 99 DOM
-
2026-06-01days on market $109,900 Active 98 DOM
-
2026-05-31days on market $109,900 Active 97 DOM
-
2026-05-30days on market $109,900 Active 96 DOM
-
2026-05-11price $109,900
-
2026-02-23$119,900 Active
-
2025-11-30historical
-
2025-10-31price $119,900
-
2025-08-18price $124,900
-
2025-07-16$129,900 Active
-
2024-03-22price $45,000
-
2024-01-30price $47,900
-
2023-11-21$49,900 Active
-
2023-08-11$49,900 Active
ⓘ Source: listings_history table (triggers on properties + properties_extension) + one-shot
backfill from property_details.listing_events for pre-trigger history.
Tax reassessment forecast IN · Partial reset (capped growth)
- Current annual tax
- $1,078 · $90/mo
- Projected year-2 tax
- $1,078 · $90/mo
- Expected delta
- $0/yr ($0/mo · 0.0%)
ⓘ Screening estimate from a state-policy table — verify with the county assessor before closing.
Climate risk First Street
- Flood 1/10 Low FEMA zone X (unshaded) · 0% chance over 30 yrs
- Wildfire 1/10 Low
- Heat 4/10 Moderate 7 d/yr ≥105°F today · 18 d/yr by 30 yrs out
- Wind 2/10 Low 100% chance of damaging wind over 30 yrs
- Air quality 2/10 Low 1 unhealthy d/yr today · 2 by 30 yrs out
Nearby sold comps map
Loading sold comps map…
Walkable amenities ~0.75 mi
Loading nearby amenities…
Taxation est. · year 1
- Rental income
- $10,591
- − Mortgage interest
- −$6,156
- − Property taxes
- −$1,078
- − Insurance
- −$550
- − Repairs & maintenance
- −$847
- − Management
- −$847
- − Depreciation
- −$3,197
- Taxable loss
- −$2,084
- Est. tax savings @ 24.0%
- +$500
- After-tax cash flow
- $324/yr
For passive investors: Depreciation is non-cash, so a rental often shows a tax loss while cash-flowing — sheltering income. Rental losses are passive: they offset passive income freely, and up to $25,000/yr can offset ordinary (W-2) income if you actively participate and your MAGI is under $100k (phasing out to $0 by $150k); unused losses carry forward. On sale, claimed depreciation is recaptured at up to 25%, and gains may owe capital-gains tax (a 1031 exchange can defer both). Figures are a year-1 estimate at your 24.0% rate — not tax advice; consult a CPA.
Schools (NCES district)
- District
- Southwest Parke Community School Corporation
- NCES district ID
- 1810900
- Math proficiency
- 34% ▼ -4.00%
- Reading proficiency
- 36% ▼ -6.00%
- Median HH income
- $42,288
- Composite
- 29.61/100
- National rank
- #6474
- State rank
- #195 of 301 in IN
Livability — Montezuma
- Score
- 65/100
- State rank
- #314
- US rank
- #12442
Category grades
Schools grade is shown separately in the Schools card above.
Census & demographics
- Census place
- Montezuma, IN
- Population (ZIP)
- 1,262
Population outlook (Parke County) Hauer SSP2
- Today (2025)
- 15,937 people
- By 2030
- 15,467 · -2.9%
- By 2040
- 14,793 · -7.2%
- By 2050
- 14,318 · -10.2%
- By 2075
- 13,484 · -15.4%
- By 2100
- 12,236 · -23.2%
Race, ethnicity, and origin ACS 2023
- Neighborhood character
- Predominantly White (87%)
- Race & ethnicity
- White 87% Two or more races 10% Hispanic / Latino 10% Black 2%
- Hispanic origin (detail)
- Mexican 10%
- Common ancestry
- Iranian 2% Slovak 2% Romanian 2%
- Foreign-born
- 2% · Canada, Jamaica
- Languages at home
- 95% English-only · Spanish 5%
Political lean MEDSL · Parke
- 2024 margin
- Solid R (+56.9) · D 20.6% · R 77.5% · Other 1.9%
- 2008→2024 swing
- -42.8pp toward R · 2008: -14.1pp · 2024: -56.9pp
- All cycles
- 2024: R+56.9 2020: R+55.5 2016: R+52.0 2012: R+32.6 2008: R+14.1
Not yet ingested
- Civics
- —
Market trends
- HPI YoY
- ▲ 1.09%
- Current HPI
- 212.829
- Rent YoY
- —
- Metro
- —
- State GDP YoY
- ▲ 2.90%
- F500 in state
- 18
Industry mix (Fortune 500 HQ in IN)
| Industry | F500 HQs | Revenue |
|---|---|---|
| Industrial Machinery | 2 | $37B |
|
||
| Healthcare | 1 | $177B |
|
||
| Pharmaceuticals | 1 | $45B |
|
||
| Metals / Steel | 1 | $18B |
|
||
| Agriculture | 1 | $17B |
|
||
| Packaging | 1 | $12B |
|
||
Price history
+120.2% since first listed10 events — show timeline
- 2026-05-11 Price Changed $109,900 MIBOR as Distributed by MLS Grid
- 2026-02-23 Listed $119,900 MIBOR as Distributed by MLS Grid
- 2025-11-30 Listing Removed — MIBOR as Distributed by MLS Grid
- 2025-10-31 Price Changed $119,900 MIBOR as Distributed by MLS Grid
- 2025-08-18 Price Changed $124,900 MIBOR as Distributed by MLS Grid
- 2025-07-16 Listed $129,900 MIBOR as Distributed by MLS Grid
- 2024-03-22 Price Changed $45,000 THAAR
- 2024-01-30 Price Changed $47,900 THAAR
- 2023-11-21 Listed $49,900 THAAR
- 2023-08-11 Listed $49,900 THAAR
Property tax history
+1.7%/yrLatest (2024): $1,078 · +0.4% YoY. Source: county tax records.
Cash-flow waterfall
monthlySold comps — $/sqft
last 12 mo · ≤1 miLoading sold comps…