 🏷️ Likely Rental
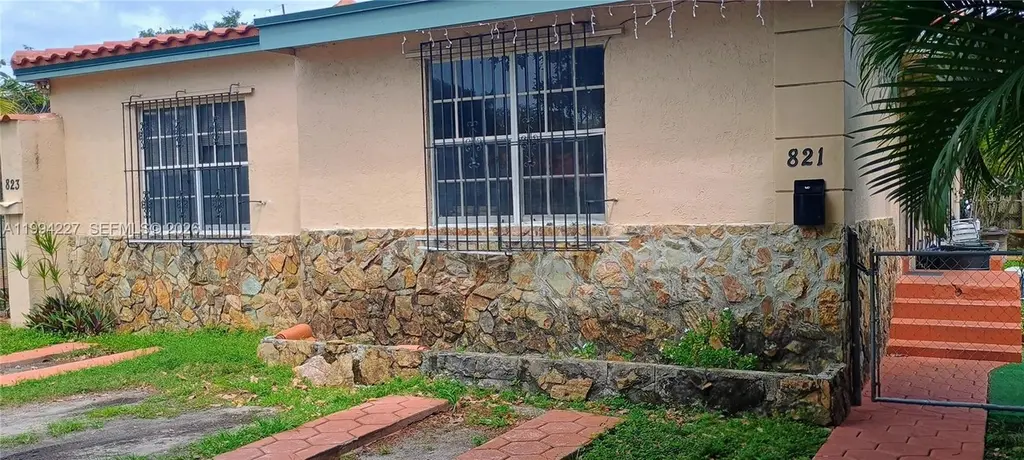
821 SW 11th St · Miami, FL
Flood risk 3/10 · Minor
- FEMA flood zone
- X (unshaded)
- Chance of flooding over 30 yrs
- 0.13%
- Est. flood insurance / yr
- $507 – $1,088
Fire risk 1/10 · Minimal
- Est. fire insurance / yr
- $947 – $1,759
Heat risk 10/10 · Severe
- Hot days now (above 103°F)
- 8 days/yr
- Hot days in 30 yrs
- 32 days/yr
Wind risk 10/10 · Severe
- Chance of severe wind over 30 yrs
- 99.0%
Air-quality risk 2/10 · Minimal
- Unhealthy air days now
- 1 days/yr
- Unhealthy air days in 30 yrs
- 1 days/yr
Risk factors via First Street. Map © Google.
Why this score? — see what drove the B- grade
The composite is a weighted blend of 9 inputs, each scored 0–100. Each bar is that input's sub-score; the figure is the points it added to the 100-point composite (weight × sub-score).
- Cash flow +23.1/30.0
- ARV discount +15.0/15.0
- DSCR +7.4/10.0
- 1% rule +6.2/10.0
- Appreciation +4.4/10.0
- Schools +4.2/10.0
- Livability +3.9/5.0
- Rent growth +3.1/5.0
- Condition / age +2.5/5.0
$738,000
🖨 Deal sheet 📄 Offer letter ✓ Due diligence
Multi-family units
County records classify this as Multi-Family (2-4 Unit). Listing-text estimate: 2 units. confirmed
Listing remarks
$4,450.00 RENTAL INCOME PRODUCING DUPLEX. GREAT PAYING TENANTS. ONE 2 BEDS+DEN (AS ROOM 3) / 1 BATH UNIT IN SECTION 8 (7/30/25lease begin$2,500/m) 1 BEDS+ DEN (AS ROOM 2) /1 BATH UNIT ($1,950 m/m) . SUPERB LOCATION . NEAR BRICKELL. 2023 NEWER ROOF ALL PAID OFF. USE SHOWING ASSIST. WED & FRI between 11-12 noon SHOWINGS ONLY. 48 hrs Advance notice. TENANT OCCUPIED. SEPARATE METERS TENANTS PAY ELECTRICAL. SERIOUS BUYERS ONLY. NO LOW BALLERS. DONT WASTE TIME. All offers must have PROOF OF FUNDS/SOLID PRE APPROVAL. Thanks
Key facts
- Newer roof
- 3 parking spots
- Built 1947
Tags
Property features AI
Finance
- Financial info: Rent includes water, sewer, and trash collection; Unit rents listed: one unit at $1,950 and one unit at $2,500 (both units are leased)
Exterior
- Parking: Three parking spaces
- Security: Smoke detectors
- Utilities: Public water; Public sewer; Cable not available
- Home design: Single-story building; Block construction; Spanish tile roof; Effective year built
- Construction: Block construction; Spanish tile roof; Single-story
- Exterior features: Fenced yard; Patio
Interior
- Kitchen: Microwave; Range; Refrigerator
- Bedrooms: Two-bedroom units (each unit has 2 bedrooms)
- Flooring: Hardwood; Tile; Wood
- Bathrooms: Each unit has one full bathroom
- Heating & cooling: Central air; Ceiling fans; Electric cooling
- Interior features: Hardwood, tile, and wood flooring; Family room; Patio/porch; Smoke detector; Circuit breaker
- Laundry & utility: Electric meter
Neighborhood map
What this means for you Summary
Snapshot
- This is a 1×2bd/1.0ba + 1×1bd/1.0ba units multifamily listed at $738k.
Deal economics
- At list price, monthly cash flow is $1k ($16k/yr) — positive. Per door: $665/mo.
- The deal already cash-flows at list — no discount required.
- Meets the 1% rule at list price ($8k rent vs $738k).
- Recommended offer: $727k (1.5% below list) — sets the bar for market timing.
- Cap rate 8.5% vs local median 1.9% in Miami — top-decile yield for the area; either an underpriced asset or a hidden risk that comps aren't pricing in. Stress-test before assuming the spread holds.
Location & tenants
- Location reads 78/100 on livability (#177 in FL, #2,724 nationally) — a middle-class / working-renter tenant base. Strengths: amenities A+, commute A+, health & safety A+; Watch: employment C-, crime F, cost of living F.
- Miami-Dade (suburban): math 45% / reading 54% proficiency, ranked #40 of 73 in FL (top 55%) — families likely to look elsewhere, expect single-tenant / working-renter base with shorter leases; 64% free/reduced lunch — lower-income household profile, screen leases tightly.
- Market conditions: Rents rising (+2.2%/yr); 234 active listings in the ZIP; 16 comparable units currently listed for rent nearby; rentals at typical pace (median 17d on market — plan ~3-4 weeks tenant-placement turnaround); high-income renter base; 10,051 units permitted in Miami-Dade County in 2024 (7,758 in 5+ unit buildings).
- At $8,243/mo this rent would consume 87% of the median local household income ($113k/yr) (locally 655% of renters already pay >50% of income on rent) — very limited rent-growth headroom before tenants either downsize or default.
Forward outlook
- Local home prices are declining (-1.2%/yr); year-one equity from $5k of loan paydown is wiped out by about $9k of value loss. Plan a longer hold.
- Miami-Dade County population projected at +28% by 2050 — long-run rental-demand tailwind backs the buy-and-hold thesis.
- At projected returns (-1.2% appreciation + 2.2% rent growth), your $207k cash investment doubles in ~10 years — after that, you're playing with house money.
Negotiation context
- It's been on market 18 days — a 2% lower offer ($727k) is reasonable based on typical stale-listing flexibility.
- 2 sale attempts; this cycle's ask has dropped $52k (7%) from the opening price — seller is motivated, your offer sets the floor, not the list.
- Current owner paid $95k; list at $738k implies a 677% gain — meaningful room to come down on a strong offer.
Risks & watch-outs
- Watch-outs: built in 1947 — expect roof / HVAC / electrical / plumbing capex.
- Climate carrying-cost: severe wind risk, 99% chance of damaging wind over 30y; extreme-heat days projected 8→32/yr by 2055 (HVAC capex compounding) — expect insurance premiums to compound above CPI over the hold.
Questions for the listing agent
- Can we see the unit-by-unit rent roll, current vacancy, and any below-market leases? What's the average tenancy length?
- What capital expenditures (roof, boiler, parking lot, exteriors) have been made in the last 5 years, and what's planned in the next 2?
- Built in 1947 — when were the roof, HVAC, electrical panel, plumbing, and water heater last replaced?
- Is there a deadline driving the sale (1031 exchange, divorce, estate, relocation)? That informs how much negotiation room exists.
- Schools are B-rated — typically a magnet for longer-tenancy family renters. What's the average tenant stay here, and is there a school-zone premium baked into asking?
- Crime grade is F in this area — have there been break-ins, vandalism, or insurance claims at this property in the last 3 years? What carrier currently insures it and at what premium?
- What's the average days-on-market for RENTAL listings here right now (not sales)? A rising rental-DOM trend means longer vacancies and softer asking-rent achievability than the comps imply.
- What's the recent tenant-quality profile in this submarket — average credit score on applications, eviction rate, late-payment / NSF rate, and stable-employment percentage? A property-management company in the area should have these aggregated.
- How much new apartment / multifamily construction is in the pipeline within 1–3 miles? Heavy new supply (>2% of stock underway) typically softens rents 12–24 months out; light construction supports rent growth.
Investment metrics
- 1% rule
- 1.12% ✓
- Cap rate
- 8.46%
- Cash-on-cash
- 7.72%
- DSCR
- 1.34
- GRM
- 7.5
CMA / ARV
- ARV (on-the-fly)
- $1,315,902
- Comps found
- 1
Show comp detail 1 sale within ~0.75 mi
| Address | Dist | Beds/Ba | Sqft | Sold | Price | $/sf | Match |
|---|---|---|---|---|---|---|---|
| 444 SW 26th Rd | 0.44mi | 4/3.0 | 1,812 (-6%) | 11mo | $1,230,000 | $679 | 55 |
Match score weights: distance 35% · size 25% · config 20% · recency 20%. Top-matched comps best support the ARV.
Projected returns pro-forma
-1.16% appreciation · 2.23% rent growth · sell at horizon
- IRR
- 2.0%
- Equity multiple
- 1.09×
- Total profit
- $17,772
- Equity at exit
- $172,611
- IRR
- 8.1%
- Equity multiple
- 1.75×
- Total profit
- $154,437
- Equity at exit
- $176,581
Cash invested: $206,640 (down + closing). Projections, not guarantees.
Landlord ↔ Tenant lean methodology
- Overall (STATE)
- 87 Strongly Landlord-Friendly
- State Florida
- 87 Strongly Landlord-Friendly · R+3
- County
- — inherits STATE
- City
- — inherits STATE
ZIP-level market 33129
- Home prices YoY
- -0.3%
- Rents YoY
- 2.2%
- Active inventory
- 234
- Price-to-rent
- 15.3×
Monthly cashflow live
- Estimated rent
- $8,243 medium interval (Pro) →
- Mortgage (P&I)
- −$3,870
- Tax from tax record
- −$1,004 /mo · $12,053/yr
- Insurance
- −$308
- HOA
- −$0
- Vacancy / Maint / Mgmt
- −$1,731
- Net cashflow
- $1,330
Break-even live
2-unit breakdown (identical units grouped — click to expand)
| Units | Beds | Baths | Est. rent |
|---|---|---|---|
| 1× unit | 2 | 1 | $4,026 |
| 1× unit | 1 | 1 | $4,217 |
| Total (2 units) | $8,243 | ||
UW: 25.0% down · 7.5% · 30yr · 1.5% tax · 5.0% vac · 8.0% maint · 8.0% mgmt
Financing live
Cash to close
- Down payment
- $184,500
- Closing costs
- $22,140
- Reserves months
- —
- Total cash needed
- —
Loan-product check · same deal, 3 products live
Conventional
25% down · 7.5% · 30yr
- Down + closing
- —
- Monthly P&I
- —
- Monthly cashflow
- —
- DSCR
- —
- Eligible?
- —
Personal DTI + credit; lowest rate.
DSCR
20% down · 8.5% · 30yr
- Down + closing
- —
- Monthly P&I
- —
- Monthly cashflow
- —
- DSCR
- —
- Eligible?
- —
No personal income docs; deal must DSCR.
Hard money
10% down · 12.0% · 12mo
- Down + closing
- —
- Monthly P&I
- —
- Monthly cashflow
- —
- DSCR
- —
- Eligible?
- —
Short-term bridge; refi at stabilization.
Rent comps 16 comps
| Address | Beds | Baths | Sqft | Rent | $/sqft | DOM | Units | Dist |
|---|---|---|---|---|---|---|---|---|
| 90 SW 3rd St #12 Miami, FL | 3.0 | 3.5 | 2418 | $18,000 | $7.44 | 4d | 1 | 0.94mi |
| 1000 Brickell Plz Miami, FL | 3.0–6.0 | 3.5–5.5 | 3692 | $29,867 | $8.09 | 10d | 2 | 0.96mi |
| 1000 Brickell Plz Miami, FL | 3.0–6.0 | 3.5–5.5 | 3486 | $31,333 | $8.99 | 24d | 2 | 0.96mi |
| 1000 Brickell Plz Miami, FL | 3.0–6.0 | 4.5–5.5 | 3795 | $28,667 | $7.55 | 2d | 2 | 0.96mi |
| 175 SE 25th Rd #3403 Miami, FL | 3.0 | 3.5 | 1946 | $21,000 | $10.79 | 14d | 1 | 1.03mi |
| 175 SE 25th Rd Unit 3104 Miami, FL | 3.0 | 3.5 | 1946 | $25,000 | $12.85 | 7d | 1 | 1.04mi |
| 175 SE 25th Rd Unit 3104 Miami, FL | 3.0 | 3.5 | 1946 | $25,000 | $12.85 | 24d | 1 | 1.04mi |
| 175 SE 25th Rd Apt 602 Miami, FL | 3.0 | 3.5 | 2105 | $20,000 | $9.50 | 24d | 1 | 1.04mi |
| 175 SE 25th Rd Unit 1904 Miami, FL | 3.0 | 3.5 | 1946 | $18,900 | $9.71 | 16d | 1 | 1.04mi |
| 290 Shore Dr E #290 Miami, FL | 4.0 | 4.0 | 2314 | $18,500 | $7.99 | 10d | 1 | 1.24mi |
| 200 Biscayne Boulevard Way #5001 Miami, FL | 3.0 | 3.5 | 2457 | $20,000 | $8.14 | 24d | 1 | 1.29mi |
| 300 Biscayne Boulevard Way Unit 4502E Miami, FL | 3.0 | 3.5 | 2220 | $25,000 | $11.26 | 20d | 1 | 1.38mi |
| 300 Biscayne Boulevard Way #2306 Miami, FL | 3.0 | 3.0 | 1600 | $19,000 | $11.88 | 11d | 1 | 1.38mi |
| 300 Biscayne Boulevard Way Unit 4007W Miami, FL | 3.0 | 3.0 | 2126 | $19,000 | $8.94 | 24d | 1 | 1.38mi |
| 300 Biscayne Boulevard Way Unit 2802E Miami, FL | 3.0 | 3.5 | 2220 | $21,000 | $9.46 | 24d | 1 | 1.38mi |
| 300 Biscayne Boulevard Way Unit 1902E Miami, FL | 3.0 | 3.5 | 2220 | $18,000 | $8.11 | 2d | 1 | 1.38mi |
Listing history 8 events
-
2026-05-04status Pending
-
2026-04-28price $738,000
-
2026-04-27status Active
-
2026-04-13status Pending
-
2026-04-02$790,000 Active
-
1990-08-16soldstatus $95,000
-
1986-03-01soldstatus $60,000
-
1978-09-01soldstatus $50,000
ⓘ Source: listings_history table (triggers on properties + properties_extension) + one-shot
backfill from property_details.listing_events for pre-trigger history.
Tax reassessment forecast FL · Resets to sale price
- Current annual tax
- $12,053 · $1,004/mo
- Projected year-2 tax
- $12,053 · $1,004/mo
- Expected delta
- $0/yr ($0/mo · 0.0%)
ⓘ Screening estimate from a state-policy table — verify with the county assessor before closing.
Climate risk First Street
- Flood 3/10 Moderate FEMA zone X (unshaded) · 13% chance over 30 yrs
- Wildfire 1/10 Low
- Heat 10/10 Extreme 8 d/yr ≥103°F today · 32 d/yr by 30 yrs out
- Wind 10/10 Extreme 99% chance of damaging wind over 30 yrs
- Air quality 2/10 Low 1 unhealthy d/yr today · 1 by 30 yrs out
Nearby sold comps map
Loading sold comps map…
Walkable amenities ~0.75 mi
Loading nearby amenities…
Taxation est. · year 1
- Rental income
- $98,916
- − Mortgage interest
- −$41,339
- − Property taxes
- −$12,053
- − Insurance
- −$3,690
- − Repairs & maintenance
- −$7,913
- − Management
- −$7,913
- − Depreciation
- −$21,469
- Taxable income
- $4,538
- Est. tax owed @ 24.0%
- −$1,089
- After-tax cash flow
- $14,870/yr
For passive investors: Depreciation is non-cash, so a rental often shows a tax loss while cash-flowing — sheltering income. Rental losses are passive: they offset passive income freely, and up to $25,000/yr can offset ordinary (W-2) income if you actively participate and your MAGI is under $100k (phasing out to $0 by $150k); unused losses carry forward. On sale, claimed depreciation is recaptured at up to 25%, and gains may owe capital-gains tax (a 1031 exchange can defer both). Figures are a year-1 estimate at your 24.0% rate — not tax advice; consult a CPA.
Schools (NCES district)
- District
- Miami-Dade
- NCES district ID
- 1200390
- Math proficiency
- 45% ▼ -16.00%
- Reading proficiency
- 54% ▼ -5.00%
- Median HH income
- $43,928
- Composite
- 41.76/100
- National rank
- #3397
- State rank
- #40 of 73 in FL
Livability — Miami
- Score
- 78/100
- State rank
- #177
- US rank
- #2724
Category grades
Schools grade is shown separately in the Schools card above.
Census & demographics
- Census place
- Miami, FL
- County
- Miami-Dade County · 2,697,751 people
- City population
- 827,308
- Metro
- Miami-Fort Lauderdale-Pompano Beach, FL
- Population (ZIP)
- 14,702
- Household income
- $113,367
- Rent vs Own
- Severe rent burden
- 655.0
Population outlook (Miami-Dade County) Hauer SSP2
- Today (2025)
- 3,126,439 people
- By 2030
- 3,325,765 · +6.4%
- By 2040
- 3,697,561 · +18.3%
- By 2050
- 4,012,134 · +28.3%
- By 2075
- 4,605,612 · +47.3%
- By 2100
- 4,866,598 · +55.7%
Race, ethnicity, and origin ACS 2023
- Neighborhood character
- Predominantly Hispanic (74%)
- Race & ethnicity
- Hispanic / Latino 74% Two or more races 48% White 19% Asian 3% Black 2%
- Hispanic origin (detail)
- Mexican 3% Puerto Rican 5% Cuban 25% Dominican 2% Salvadoran 3%
- Common ancestry
- Lithuanian 3% Estonian 3% Italian 1%
- Foreign-born
- 58% · Canada, Jamaica, Dominican Republic
- Languages at home
- 15% English-only · Spanish 73% Other Indo-European 5% French/Haitian/Cajun 4%
Political lean MEDSL · Miami-Dade
- 2024 margin
- R (+11.4) · D 43.9% · R 55.4%
- 2008→2024 swing
- -27.6pp toward R · 2008: 16.1pp · 2024: -11.4pp
- All cycles
- 2024: R+11.4 2020: D+7.3 2016: D+29.6 2012: D+23.7 2008: D+16.1
Not yet ingested
- Civics
- —
Market trends
- HPI YoY
- ▼ -1.16%
- Current HPI
- 366.9874
- Rent YoY
- ▲ 2.23%
- Metro
- Miami-Fort Lauderdale-Pompano Beach, FL
- State GDP YoY
- ▲ 3.28%
- F500 in state
- 36
Industry mix (Fortune 500 HQ in FL)
| Industry | F500 HQs | Revenue |
|---|---|---|
| Industrial Technology | 2 | $29B |
|
||
| Insurance | 2 | $17B |
|
||
| Retail | 1 | $60B |
|
||
| Technology Distribution | 1 | $58B |
|
||
| Homebuilding | 1 | $35B |
|
||
| Technology Manufacturing | 1 | $35B |
|
||
Price history
+1376.0% since first listed8 events — show timeline
- 2026-05-04 Pending — MARMLS
- 2026-04-28 Price Changed $738,000 MARMLS
- 2026-04-27 Relisted — MARMLS
- 2026-04-13 Pending — MARMLS
- 2026-04-02 Listed $790,000 MARMLS
- 1990-08-16 Sold (Public Records) $95,000 Public Records
- 1986-03-01 Sold (Public Records) $60,000 Public Records
- 1978-09-01 Sold (Public Records) $50,000 Public Records
Property tax history
+9.1%/yrLatest (2025): $12,053 · +1.4% YoY. Source: county tax records.
Cash-flow waterfall
monthlySold comps — $/sqft
last 12 mo · ≤1 miLoading sold comps…