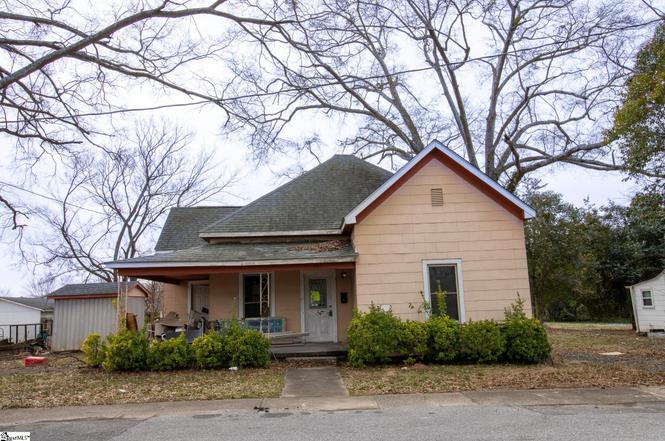
607 Holmes St · Gaffney, SC
Flood risk 1/10 · Minimal
- FEMA flood zone
- X (unshaded)
- Chance of flooding over 30 yrs
- 0.0%
- Est. flood insurance / yr
- $507 – $1,088
Fire risk 3/10 · Minor
- Est. fire insurance / yr
- $783 – $1,453
Heat risk 6/10 · Moderate
- Hot days now (above 103°F)
- 7 days/yr
- Hot days in 30 yrs
- 16 days/yr
Wind risk 3/10 · Minor
- Chance of severe wind over 30 yrs
- 4.0%
Air-quality risk 4/10 · Minor
- Unhealthy air days now
- 4 days/yr
- Unhealthy air days in 30 yrs
- 4 days/yr
Risk factors via First Street. Map © Google.
Why this score? — see what drove the C+ grade
The composite is a weighted blend of 9 inputs, each scored 0–100. Each bar is that input's sub-score; the figure is the points it added to the 100-point composite (weight × sub-score).
- Cash flow +20.9/30.0
- ARV discount +15.0/15.0
- 1% rule +7.7/10.0
- DSCR +6.6/10.0
- Livability +3.3/5.0
- Schools +2.8/10.0
- Rent growth +2.5/5.0
- Condition / age +2.5/5.0
- Appreciation +0.0/10.0
$89,000
🖨 Deal sheet 📄 Offer letter ✓ Due diligence
Listing remarks
INVESTOR OPPORTUNITY! Bring your vision to this 1941 bungalow located in the heart of Gaffney. This property is currently mid-renovation and is being sold as-is, offering a blank canvas for a savvy flipper or rental portfolio builder. With 1,405 sq. ft. of potential and situated just steps from B. D. Lee Elementary, the bones are here to create a high-value asset. Priced for an immediate sale and significant built-in equity! Cash or renovation loans only due to unfinished interior. All room dimensions, square footage, and features are approximate and not guaranteed. Buyer or Buyer’s Agent to verify all information, including school zones and property condition.
Key facts
- Mid-renovation
- 1941 bungalow
- High-value asset
Tags
Property features AI
Finance
- HOA & community: No HOA fees
Exterior
- Parking: Unpaved driveway; No garage
- Utilities: Public water; Septic sewer; Public garbage pickup
- Home design: One-story residence; Built circa 1941; Lead-based paint disclosure required; Residential property disclosure required
- Construction: Composition shingle roof; Exterior finish: Other (see remarks); Crawl space foundation; Approximate age over 50 years
- Exterior features: Front porch; Level lot with some trees; Outbuilding for storage
Interior
- Kitchen: Kitchen approx. 10 x 12; Dining area approx. 10 x 11
- Bedrooms: Three bedrooms on the main level; Primary bedroom with walk-in closet; Primary bedroom approx. 12 x 14; Second bedroom approx. 10 x 11; Third bedroom approx. 10 x 10
- Flooring: Hardwood floors; Hardwood/pine under carpet
- Bathrooms: One full bathroom (on main level)
- Heating & cooling: Natural gas heating; Central forced cooling; Electric water heater
- Interior features: Cable available; Ceiling fans; Three fireplaces
- Laundry & utility: Walk-in laundry; Washer connection; Electric dryer hookup
Neighborhood map
What this means for you Summary
Snapshot
- This is a 3-bed/1.0-bath single-family listed at $89k.
Deal economics
- At list price, monthly cash flow is $123 ($1k/yr) — positive.
- The deal already cash-flows at list — no discount required.
- Meets the 1% rule at list price ($1k rent vs $89k).
- Recommended offer: $81k (9.0% below list) — sets the bar for market timing.
- Cap rate 8.0% vs local median 2.6% in Gaffney — top-decile yield for the area; either an underpriced asset or a hidden risk that comps aren't pricing in. Stress-test before assuming the spread holds.
Location & tenants
- Location reads 66/100 on livability (#112 in SC) — a middle-class / working-renter tenant base. Strengths: cost of living A+, health & safety A+, housing A-; Watch: amenities D+, crime D, schools D-.
- Cherokee 01 (rural): math 29% / reading 40% proficiency, ranked #47 of 80 in SC (top 59%) — families likely to look elsewhere, expect single-tenant / working-renter base with shorter leases; 64% free/reduced lunch — lower-income household profile, screen leases tightly.
- Market conditions: 196 active listings in the ZIP; 1 comparable units currently listed for rent nearby; 200 units permitted in Cherokee County in 2024 (0 in 5+ unit buildings).
Forward outlook
- Local home prices are declining (-3.0%/yr); year-one equity from $615 of loan paydown is wiped out by about $3k of value loss. Plan a longer hold.
Negotiation context
- It's been on market 109 days — a 9% lower offer ($81k) is reasonable based on typical stale-listing flexibility.
- 2 sale attempts; this cycle's ask has dropped $26k (23%) from the opening price — seller is motivated, your offer sets the floor, not the list.
Risks & watch-outs
- Watch-outs: property tax is 3.6% of price; built in 1941 — expect roof / HVAC / electrical / plumbing capex.
- Climate carrying-cost: extreme-heat days projected 7→16/yr by 2055 (HVAC capex compounding) — expect insurance premiums to compound above CPI over the hold.
Questions for the listing agent
- It's been on market 109 days. Have you received any prior offers? Is the seller open to a 9% concession, seller financing, or rate buy-down credit?
- Built in 1941 — when were the roof, HVAC, electrical panel, plumbing, and water heater last replaced?
- Property tax is high relative to price — has the assessment been appealed recently, and will the sale trigger a re-assessment?
- Why hasn't it sold? Are there any deal-killer items the seller is aware of (foundation, flood, title, zoning, code violations)?
- Is there a deadline driving the sale (1031 exchange, divorce, estate, relocation)? That informs how much negotiation room exists.
- Schools are D-rated, which usually means shorter tenancies and higher turnover. Who's the typical renter profile here, and what's been the actual vacancy rate?
- Crime grade is D in this area — have there been break-ins, vandalism, or insurance claims at this property in the last 3 years? What carrier currently insures it and at what premium?
- What's the average days-on-market for RENTAL listings here right now (not sales)? A rising rental-DOM trend means longer vacancies and softer asking-rent achievability than the comps imply.
- What's the recent tenant-quality profile in this submarket — average credit score on applications, eviction rate, late-payment / NSF rate, and stable-employment percentage? A property-management company in the area should have these aggregated.
- How much new for-sale + rental construction is in the pipeline within 1–3 miles? Heavy new supply typically softens prices + rents 12–24 months out; constrained supply supports both.
Investment metrics
- 1% rule
- 1.27% ✓
- Cap rate
- 7.96%
- Cash-on-cash
- 5.94%
- DSCR
- 1.26
- GRM
- 6.6
CMA / ARV
- ARV (on-the-fly)
- $168,600
- Comps found
- 7
Show comp detail 7 sales within ~0.75 mi
| Address | Dist | Beds/Ba | Sqft | Sold | Price | $/sf | Match |
|---|---|---|---|---|---|---|---|
| 203 Poplar St | 0.03mi | 3/1.0 | 1,550 (+10%) | 1mo | $62,500 | $40 | 81 |
| 823 W Smith Street St | 0.13mi | 2/1.0 (-1) | 1,440 (+2%) | 11mo | $160,000 | $111 | 76 |
| 817 W Smith St | 0.12mi | 3/2.0 | 1,222 (-13%) | 3mo | $234,900 | $192 | 66 |
| 508 W Frederick St | 0.34mi | 2/1.0 (-1) | 1,316 (-6%) | 6mo | $72,000 | $55 | 63 |
| 608 Littlejohn St | 0.64mi | 3/2.0 | 1,215 (-14%) | 1mo | $170,000 | $140 | 43 |
| 1168 W Rutledge Ave | 0.67mi | 3/2.0 | 1,580 (+12%) | 4mo | $309,900 | $196 | 41 |
| 103 Calton Dr | 0.65mi | 3/2.0 | 1,548 (+10%) | 10mo | $185,000 | $120 | 40 |
Match score weights: distance 35% · size 25% · config 20% · recency 20%. Top-matched comps best support the ARV.
Projected returns pro-forma
-3.0% appreciation · 3.0% rent growth · sell at horizon
- IRR
- -7.0%
- Equity multiple
- 0.74×
- Total profit
- $-6,450
- Equity at exit
- $13,270
- IRR
- 2.8%
- Equity multiple
- 1.20×
- Total profit
- $4,960
- Equity at exit
- $7,695
Cash invested: $24,920 (down + closing). Projections, not guarantees.
Landlord ↔ Tenant lean methodology
- Overall (STATE)
- 90 Strongly Landlord-Friendly
- State South Carolina
- 90 Strongly Landlord-Friendly · R+6
- County
- — inherits STATE
- City
- — inherits STATE
ZIP-level market 29341
- Home prices YoY
- -24.1%
- Active inventory
- 196
- Price-to-rent
- 6.6×
Monthly cashflow live
- Estimated rent
- $1,130 medium interval (Pro) →
- Mortgage (P&I)
- −$467
- Tax from tax record
- −$266 /mo · $3,190/yr
- Insurance
- −$37
- HOA
- −$0
- Vacancy / Maint / Mgmt
- −$237
- Net cashflow
- $123
Break-even live
UW: 25.0% down · 7.5% · 30yr · 1.5% tax · 5.0% vac · 8.0% maint · 8.0% mgmt
Financing live
Cash to close
- Down payment
- $22,250
- Closing costs
- $2,670
- Reserves months
- —
- Total cash needed
- —
Loan-product check · same deal, 3 products live
Conventional
25% down · 7.5% · 30yr
- Down + closing
- —
- Monthly P&I
- —
- Monthly cashflow
- —
- DSCR
- —
- Eligible?
- —
Personal DTI + credit; lowest rate.
DSCR
20% down · 8.5% · 30yr
- Down + closing
- —
- Monthly P&I
- —
- Monthly cashflow
- —
- DSCR
- —
- Eligible?
- —
No personal income docs; deal must DSCR.
Hard money
10% down · 12.0% · 12mo
- Down + closing
- —
- Monthly P&I
- —
- Monthly cashflow
- —
- DSCR
- —
- Eligible?
- —
Short-term bridge; refi at stabilization.
Rent comps 1 comps
| Address | Beds | Baths | Sqft | Rent | $/sqft | DOM | Units | Dist |
|---|---|---|---|---|---|---|---|---|
| 506 S Oliver St Gaffney, SC | 1.0–2.0 | 1.0 | 900 | $955 | $1.06 | 16d | 5 | 0.41mi |
Listing history 24 events
-
2026-06-19days on market $89,000 Active 109 DOM
-
2026-06-18days on market $89,000 Active 108 DOM
-
2026-06-17days on market $89,000 Active 107 DOM
-
2026-06-16days on market $89,000 Active 106 DOM
-
2026-06-15days on market $89,000 Active 105 DOM
-
2026-06-14days on market $89,000 Active 103 DOM
-
2026-06-13pricedays on market $89,000 Active 102 DOM
-
2026-06-10days on market $105,000 Active 100 DOM
-
2026-06-09days on market $105,000 Active 99 DOM
-
2026-06-08days on market $105,000 Active 98 DOM
-
2026-06-07days on market $105,000 Active 97 DOM
-
2026-06-02days on market $105,000 Active 92 DOM
-
2026-06-01days on market $105,000 Active 91 DOM
-
2026-05-31days on market $105,000 Active 90 DOM
-
2026-05-30days on market $105,000 Active 89 DOM
-
2026-05-21price $105,000
-
2026-04-23status Active
-
2026-04-19status Pending
-
2026-04-09price $110,000
-
2026-02-26$115,000 Active
-
2024-06-13soldstatus $132,000
-
2024-02-02soldstatus $86,500
-
2005-10-13soldstatus $49,343
-
2002-04-01soldstatus $45,000
ⓘ Source: listings_history table (triggers on properties + properties_extension) + one-shot
backfill from property_details.listing_events for pre-trigger history.
Tax reassessment forecast SC · Resets to sale price
- Current annual tax
- $3,190 · $266/mo
- Projected year-2 tax
- $3,190 · $266/mo
- Expected delta
- $0/yr ($0/mo · 0.0%)
ⓘ Screening estimate from a state-policy table — verify with the county assessor before closing.
Climate risk First Street
- Flood 1/10 Low FEMA zone X (unshaded) · 0% chance over 30 yrs
- Wildfire 3/10 Moderate
- Heat 6/10 Major 7 d/yr ≥103°F today · 16 d/yr by 30 yrs out
- Wind 3/10 Moderate 4% chance of damaging wind over 30 yrs
- Air quality 4/10 Moderate 4 unhealthy d/yr today · 4 by 30 yrs out
Nearby sold comps map
Loading sold comps map…
Walkable amenities ~0.75 mi
Loading nearby amenities…
Taxation est. · year 1
- Rental income
- $13,566
- − Mortgage interest
- −$4,985
- − Property taxes
- −$3,190
- − Insurance
- −$445
- − Repairs & maintenance
- −$1,085
- − Management
- −$1,085
- − Depreciation
- −$2,589
- Taxable income
- $185
- Est. tax owed @ 24.0%
- −$45
- After-tax cash flow
- $1,436/yr
For passive investors: Depreciation is non-cash, so a rental often shows a tax loss while cash-flowing — sheltering income. Rental losses are passive: they offset passive income freely, and up to $25,000/yr can offset ordinary (W-2) income if you actively participate and your MAGI is under $100k (phasing out to $0 by $150k); unused losses carry forward. On sale, claimed depreciation is recaptured at up to 25%, and gains may owe capital-gains tax (a 1031 exchange can defer both). Figures are a year-1 estimate at your 24.0% rate — not tax advice; consult a CPA.
Schools (NCES district)
- District
- Cherokee 01
- NCES district ID
- 4501500
- Math proficiency
- 29% ▼ -9.00%
- Reading proficiency
- 40% ▼ -2.00%
- Median HH income
- $34,262
- Composite
- 28.39/100
- National rank
- #6768
- State rank
- #47 of 80 in SC
Livability — Gaffney
- Score
- 66/100
- State rank
- #112
- US rank
- #11549
Category grades
Schools grade is shown separately in the Schools card above.
Census & demographics
- Census place
- Gaffney, SC
- County
- Cherokee County · 41,410 people
- City population
- 41,410
- Metro
- Gaffney, SC
- Population (ZIP)
- 20,647
- Household income
- $58,029
- Rent vs Own
- Severe rent burden
- 452.0
Population outlook (Cherokee County) Hauer SSP2
- Today (2025)
- 58,602 people
- By 2030
- 59,336 · +1.3%
- By 2040
- 60,266 · +2.8%
- By 2050
- 60,314 · +2.9%
- By 2075
- 59,276 · +1.2%
- By 2100
- 53,788 · -8.2%
Race, ethnicity, and origin ACS 2023
- Neighborhood character
- Diverse neighborhood (Simpson 0.58)
- Race & ethnicity
- White 59% Black 26% Two or more races 9% Hispanic / Latino 8%
- Hispanic origin (detail)
- Mexican 4% Puerto Rican 1%
- Common ancestry
- Italian 2% Serbian 2% Slovak 2%
- Foreign-born
- 4% · Canada
- Languages at home
- 93% English-only · Spanish 6% Other Indo-European 1%
Political lean MEDSL · Cherokee
- 2024 margin
- Solid R (+51.4) · D 23.9% · R 75.3%
- 2008→2024 swing
- -22.0pp toward R · 2008: -29.3pp · 2024: -51.4pp
- All cycles
- 2024: R+51.4 2020: R+43.8 2016: R+41.7 2012: R+29.3 2008: R+29.3
Not yet ingested
- Civics
- —
Market trends
- HPI YoY
- ▼ -64.62%
- Current HPI
- 203.8038
- Rent YoY
- —
- Metro
- Gaffney, SC
- State GDP YoY
- ▲ 4.51%
- F500 in state
- 2
Industry mix (Fortune 500 HQ in SC)
| Industry | F500 HQs | Revenue |
|---|---|---|
| Packaging | 1 | $7B |
|
||
Price history
+133.3% since first listed9 events — show timeline
- 2026-05-21 Price Changed $105,000 Greater Greenville MLS
- 2026-04-23 Relisted — Greater Greenville MLS
- 2026-04-19 Pending — Greater Greenville MLS
- 2026-04-09 Price Changed $110,000 Greater Greenville MLS
- 2026-02-26 Listed $115,000 Greater Greenville MLS
- 2024-06-13 Sold (Public Records) $132,000 Public Records
- 2024-02-02 Sold (Public Records) $86,500 Public Records
- 2005-10-13 Sold (Public Records) $49,343 Public Records
- 2002-04-01 Sold (Public Records) $45,000 Public Records
Property tax history
+11.6%/yrLatest (2025): $3,190 · +99.3% YoY. Source: county tax records.
Cash-flow waterfall
monthlySold comps — $/sqft
last 12 mo · ≤1 miLoading sold comps…