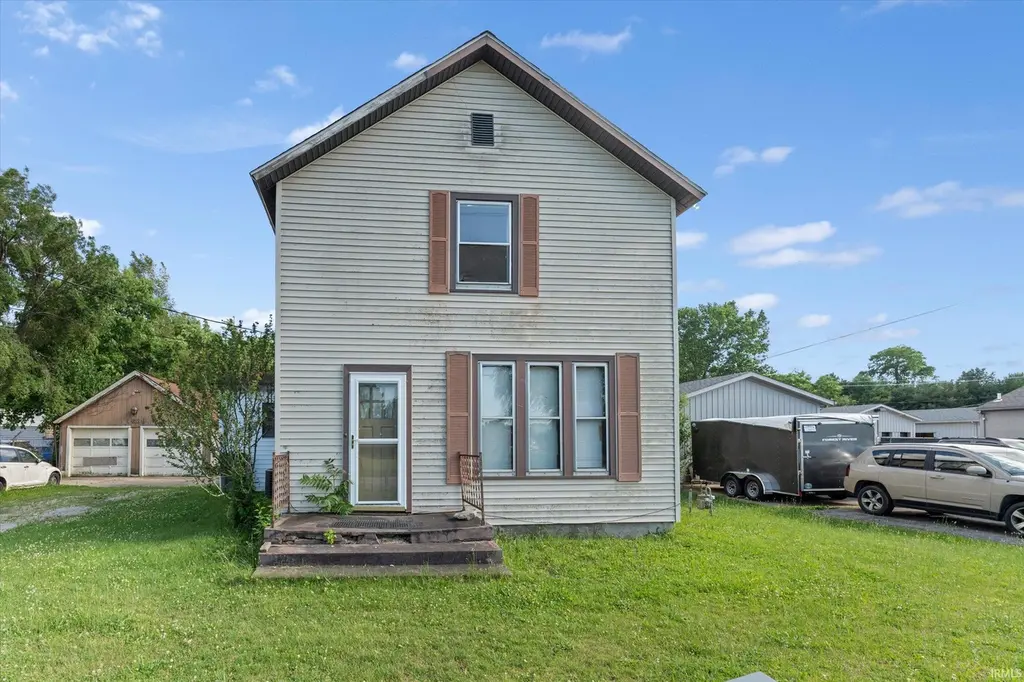
1639 Toledo Rd · Elkhart, IN
Flood risk 1/10 · Minimal
- FEMA flood zone
- X (unshaded)
- Chance of flooding over 30 yrs
- 0.0%
- Est. flood insurance / yr
- $473 – $860
Fire risk 1/10 · Minimal
- Est. fire insurance / yr
- $717 – $1,331
Heat risk 2/10 · Minimal
- Hot days now (above 101°F)
- 7 days/yr
- Hot days in 30 yrs
- 16 days/yr
Wind risk 2/10 · Minimal
- Chance of severe wind over 30 yrs
- —
Air-quality risk 2/10 · Minimal
- Unhealthy air days now
- 1 days/yr
- Unhealthy air days in 30 yrs
- 2 days/yr
Risk factors via First Street. Map © Google.
Why this score? — see what drove the D+ grade
The composite is a weighted blend of 9 inputs, each scored 0–100. Each bar is that input's sub-score; the figure is the points it added to the 100-point composite (weight × sub-score).
- ARV discount +15.0/15.0
- Cash flow +14.5/30.0
- DSCR +4.4/10.0
- 1% rule +4.2/10.0
- Livability +3.4/5.0
- Schools +2.7/10.0
- Rent growth +2.5/5.0
- Condition / age +2.5/5.0
- Appreciation +0.0/10.0
$160,000
🖨 Deal sheet 📄 Offer letter ✓ Due diligence
Listing remarks
Opportunity awaits with this spacious home situated on a generous 0.45-acre lot in Elkhart! It offers great potential for buyers looking to add their personal touch and build equity. Features include a detached 2-car garage, a newer AC unit that's only 3 years old, and plenty of outdoor space for entertaining, gardening, or future improvements. With solid bones, a large yard, and endless possibilities, this property is ready for its next owner to make it their own. Schedule your showing today!
Key facts
- Newer ac unit
- 0.45-acre lot
- Outdoor space
Tags
Property features AI
Exterior
- Parking: Detached 2-car garage
- Utilities: Public water; Public sewer
- Home design: Single-family site-built home; 2 stories
- Construction: Vinyl siding with asphalt elements; Block foundation
- Exterior features: Lot approximately 78 x 270; 0.45-acre lot
Interior
- Kitchen: Gas range
- Bedrooms: Total of 4 rooms (bedrooms included)
- Bathrooms: 2 full bathrooms; 1 main-level bathroom
- Heating & cooling: Central air
- Interior features: Gas range; Partial basement
- Laundry & utility: Laundry on main level
Neighborhood map
What this means for you Summary
Snapshot
- This is a 4-bed/1.0-bath single-family listed at $160k.
Deal economics
- At list price, monthly cash flow is $35 ($424/yr) — positive.
- The deal already cash-flows at list — no discount required.
- To meet the 1% rule (rent ≥ 1% of price), the offer needs to be $147k (7.8% below list).
- Recommended offer: $147k (7.8% below list) — sets the bar for 1% rule.
- Cap rate 6.6% vs local median 4.0% in Elkhart — top-decile yield for the area; either an underpriced asset or a hidden risk that comps aren't pricing in. Stress-test before assuming the spread holds.
Location & tenants
- Location reads 68/100 on livability (#224 in IN) — a middle-class / working-renter tenant base. Strengths: cost of living A+, housing A+, health & safety A+; Watch: amenities C-, crime F, commute F.
- Concord Community Schools (suburban): math 24% / reading 39% proficiency, ranked #226 of 301 in IN (top 75%) — families likely to look elsewhere, expect single-tenant / working-renter base with shorter leases.
- Zoned schools: Concord East Side Elementary Sch (math 45% / reading 39%, grade F, #434 of 994 statewide, top 48%, 555 students, 53% FRL); Concord Junior High School (math 19% / reading 46%, grade F, #186 of 330 statewide, top 57%, 841 students, 58% FRL); Concord Community High School (math 25% / reading 64%, grade F, #169 of 369 statewide, top 51%, 1,785 students, 51% FRL).
- Market conditions: 146 active listings in the ZIP; 484 units permitted in Elkhart County in 2024 (136 in 5+ unit buildings).
- This rent runs 31% of the median local income ($56k/yr) — at the standard rent-burdened threshold; future hikes will face affordability resistance.
Forward outlook
- Local home prices are declining (-3.0%/yr); year-one equity from $1k of loan paydown is wiped out by about $5k of value loss. Plan a longer hold.
- Elkhart County population projected at +7% by 2050 — modest demand growth; plan on rents tracking national, not racing it.
Negotiation context
- Only 6 days on market — expect competitive offers; lowballing is unlikely to land.
Risks & watch-outs
- Watch-outs: built in 1868 — expect roof / HVAC / electrical / plumbing capex.
Questions for the listing agent
- Built in 1868 — when were the roof, HVAC, electrical panel, plumbing, and water heater last replaced?
- Is there a deadline driving the sale (1031 exchange, divorce, estate, relocation)? That informs how much negotiation room exists.
- Schools are F-rated, which usually means shorter tenancies and higher turnover. Who's the typical renter profile here, and what's been the actual vacancy rate?
- Crime grade is F in this area — have there been break-ins, vandalism, or insurance claims at this property in the last 3 years? What carrier currently insures it and at what premium?
- The area grade is low — what's the realistic commute time and amenity access for the typical tenant pool here? Any planned neighborhood developments (good or bad) we should know about?
- What's the average days-on-market for RENTAL listings here right now (not sales)? A rising rental-DOM trend means longer vacancies and softer asking-rent achievability than the comps imply.
- What's the recent tenant-quality profile in this submarket — average credit score on applications, eviction rate, late-payment / NSF rate, and stable-employment percentage? A property-management company in the area should have these aggregated.
- How much new for-sale + rental construction is in the pipeline within 1–3 miles? Heavy new supply typically softens prices + rents 12–24 months out; constrained supply supports both.
Investment metrics
- 1% rule
- 0.92% ✗
- Cap rate
- 6.56%
- Cash-on-cash
- 0.95%
- DSCR
- 1.04
- GRM
- 9.0
CMA / ARV
- ARV (on-the-fly)
- $268,992
- Comps found
- 6
Show comp detail 6 sales within ~0.75 mi
| Address | Dist | Beds/Ba | Sqft | Sold | Price | $/sf | Match |
|---|---|---|---|---|---|---|---|
| 1112 Goshen Ave | 0.17mi | 3/2.0 (-1) | 1,809 (-3%) | 10mo | $215,000 | $119 | 69 |
| 56297 Silvercrest Dr | 0.24mi | 4/2.5 | 1,824 (-2%) | 15mo | $284,900 | $156 | 66 |
| 24731 County Road 16 | 0.12mi | 3/1.5 (-1) | 1,740 (-7%) | 13mo | $250,000 | $144 | 65 |
| 24307 County Road 16 | 0.55mi | 4/2.0 | 1,813 (-3%) | 12mo | $265,000 | $146 | 55 |
| 633 James St | 0.54mi | 4/1.5 | 1,605 (-14%) | 13mo | $189,000 | $118 | 39 |
| 1112 North St | 0.66mi | 3/1.5 (-1) | 1,642 (-12%) | 14mo | $159,900 | $97 | 31 |
Match score weights: distance 35% · size 25% · config 20% · recency 20%. Top-matched comps best support the ARV.
Projected returns pro-forma
-3.0% appreciation · 3.0% rent growth · sell at horizon
- IRR
- -14.8%
- Equity multiple
- 0.47×
- Total profit
- $-23,639
- Equity at exit
- $23,857
- IRR
- -6.1%
- Equity multiple
- 0.61×
- Total profit
- $-17,536
- Equity at exit
- $13,834
Cash invested: $44,800 (down + closing). Projections, not guarantees.
Landlord ↔ Tenant lean methodology
- Overall (STATE)
- 90 Strongly Landlord-Friendly
- State Indiana
- 90 Strongly Landlord-Friendly · R+11
- County
- — inherits STATE
- City
- — inherits STATE
ZIP-level market 46516
- Active inventory
- 146
- Price-to-rent
- 9.0×
Monthly cashflow live
- Estimated rent
- $1,474 medium interval (Pro) →
- Mortgage (P&I)
- −$839
- Tax from tax record
- −$224 /mo · $2,685/yr
- Insurance
- −$67
- HOA
- −$0
- Vacancy / Maint / Mgmt
- −$310
- Net cashflow
- $35
Break-even live
UW: 25.0% down · 7.5% · 30yr · 1.5% tax · 5.0% vac · 8.0% maint · 8.0% mgmt
Financing live
Cash to close
- Down payment
- $40,000
- Closing costs
- $4,800
- Reserves months
- —
- Total cash needed
- —
Loan-product check · same deal, 3 products live
Conventional
25% down · 7.5% · 30yr
- Down + closing
- —
- Monthly P&I
- —
- Monthly cashflow
- —
- DSCR
- —
- Eligible?
- —
Personal DTI + credit; lowest rate.
DSCR
20% down · 8.5% · 30yr
- Down + closing
- —
- Monthly P&I
- —
- Monthly cashflow
- —
- DSCR
- —
- Eligible?
- —
No personal income docs; deal must DSCR.
Hard money
10% down · 12.0% · 12mo
- Down + closing
- —
- Monthly P&I
- —
- Monthly cashflow
- —
- DSCR
- —
- Eligible?
- —
Short-term bridge; refi at stabilization.
Listing history 7 events
-
2026-06-19days on market $160,000 Active 6 DOM
-
2026-06-18days on market $160,000 Active 5 DOM
-
2026-06-17days on market $160,000 Active 4 DOM
-
2026-06-16days on market $160,000 Active 3 DOM
-
2026-06-15days on market $160,000 Active 2 DOM
-
2026-06-14remarks 498-char remark
-
2026-06-14$160,000 Active 1 DOM
ⓘ Source: listings_history table (triggers on properties + properties_extension) + one-shot
backfill from property_details.listing_events for pre-trigger history.
Tax reassessment forecast IN · Partial reset (capped growth)
- Current annual tax
- $2,685 · $224/mo
- Projected year-2 tax
- $2,685 · $224/mo
- Expected delta
- $0/yr ($0/mo · 0.0%)
ⓘ Screening estimate from a state-policy table — verify with the county assessor before closing.
Climate risk First Street
- Flood 1/10 Low FEMA zone X (unshaded) · 0% chance over 30 yrs
- Wildfire 1/10 Low
- Heat 2/10 Low 7 d/yr ≥101°F today · 16 d/yr by 30 yrs out
- Wind 2/10 Low
- Air quality 2/10 Low 1 unhealthy d/yr today · 2 by 30 yrs out
Nearby sold comps map
Loading sold comps map…
Walkable amenities ~0.75 mi
Loading nearby amenities…
Taxation est. · year 1
- Rental income
- $17,694
- − Mortgage interest
- −$8,962
- − Property taxes
- −$2,685
- − Insurance
- −$800
- − Repairs & maintenance
- −$1,416
- − Management
- −$1,416
- − Depreciation
- −$4,655
- Taxable loss
- −$2,239
- Est. tax savings @ 24.0%
- +$537
- After-tax cash flow
- $962/yr
For passive investors: Depreciation is non-cash, so a rental often shows a tax loss while cash-flowing — sheltering income. Rental losses are passive: they offset passive income freely, and up to $25,000/yr can offset ordinary (W-2) income if you actively participate and your MAGI is under $100k (phasing out to $0 by $150k); unused losses carry forward. On sale, claimed depreciation is recaptured at up to 25%, and gains may owe capital-gains tax (a 1031 exchange can defer both). Figures are a year-1 estimate at your 24.0% rate — not tax advice; consult a CPA.
Schools (NCES district)
- District
- Concord Community Schools
- NCES district ID
- 1802400
- Math proficiency
- 24% ▼ -21.00%
- Reading proficiency
- 39% ▼ -8.00%
- Median HH income
- $46,133
- Composite
- 27.02/100
- National rank
- #7057
- State rank
- #226 of 301 in IN
Livability — Elkhart
- Score
- 68/100
- State rank
- #224
- US rank
- #9852
Category grades
Schools grade is shown separately in the Schools card above.
Census & demographics
- County
- Elkhart County · 107,928 people
- City population
- 74,260
- Metro
- Elkhart-Goshen, IN
- Population (ZIP)
- 31,871
- Household income
- $56,492
- Rent vs Own
- Severe rent burden
- 995.0
Population outlook (Elkhart County) Hauer SSP2
- Today (2025)
- 213,761 people
- By 2030
- 218,103 · +2.0%
- By 2040
- 225,381 · +5.4%
- By 2050
- 229,447 · +7.3%
- By 2075
- 232,856 · +8.9%
- By 2100
- 214,088 · +0.2%
Race, ethnicity, and origin ACS 2023
- Neighborhood character
- Diverse neighborhood (Simpson 0.56)
- Race & ethnicity
- White 60% Hispanic / Latino 26% Black 9% Two or more races 8% Asian 1%
- Hispanic origin (detail)
- Mexican 15%
- Common ancestry
- Romanian 2% Iranian 2% Lithuanian 2%
- Foreign-born
- 15% · Canada
- Languages at home
- 77% English-only · Spanish 19% Other Indo-European 3%
Political lean MEDSL · Elkhart
- 2024 margin
- Solid R (+32.4) · D 33.1% · R 65.5% · Other 1.4%
- 2008→2024 swing
- -21.2pp toward R · 2008: -11.2pp · 2024: -32.4pp
- All cycles
- 2024: R+32.4 2020: R+28.1 2016: R+32.4 2012: R+26.5 2008: R+11.2
Not yet ingested
- Civics
- —
Market trends
- HPI YoY
- ▼ -233.42%
- Current HPI
- 239.2508
- Rent YoY
- —
- Metro
- Elkhart-Goshen, IN
- State GDP YoY
- ▲ 2.90%
- F500 in state
- 18
Industry mix (Fortune 500 HQ in IN)
| Industry | F500 HQs | Revenue |
|---|---|---|
| Industrial Machinery | 2 | $37B |
|
||
| Healthcare | 1 | $177B |
|
||
| Pharmaceuticals | 1 | $45B |
|
||
| Metals / Steel | 1 | $18B |
|
||
| Agriculture | 1 | $17B |
|
||
| Packaging | 1 | $12B |
|
||
Price history
1 event — show timeline
- 2026-06-13 Listed $160,000 IRMLS
Property tax history
+12.5%/yrLatest (2025): $2,685 · +5.2% YoY. Source: county tax records.
Cash-flow waterfall
monthlySold comps — $/sqft
last 12 mo · ≤1 miLoading sold comps…