 🏷️ Likely Rental
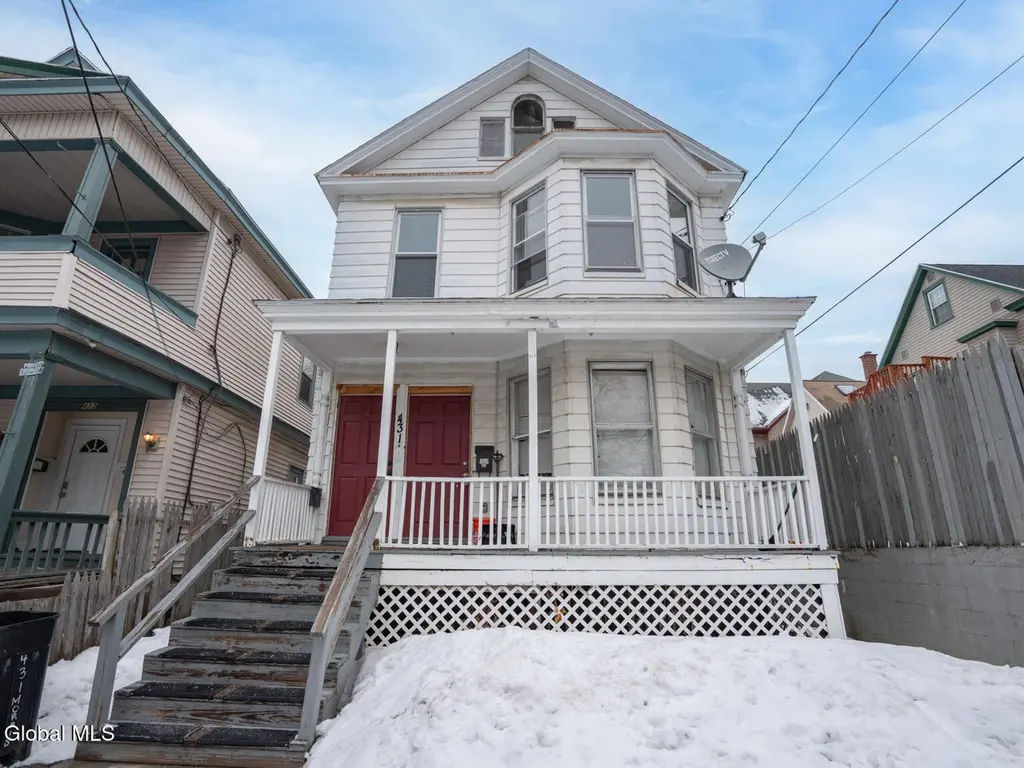
431 Morris St · Albany, NY
Flood risk 1/10 · Minimal
- FEMA flood zone
- X (unshaded)
- Chance of flooding over 30 yrs
- 0.0%
- Est. flood insurance / yr
- $473 – $860
Fire risk 1/10 · Minimal
- Est. fire insurance / yr
- $691 – $1,283
Heat risk 4/10 · Minor
- Hot days now (above 97°F)
- 7 days/yr
- Hot days in 30 yrs
- 17 days/yr
Wind risk 3/10 · Minor
- Chance of severe wind over 30 yrs
- 6.0%
Air-quality risk 1/10 · Minimal
- Unhealthy air days now
- 0 days/yr
- Unhealthy air days in 30 yrs
- 0 days/yr
Risk factors via First Street. Map © Google.
Why this score? — see what drove the B+ grade
The composite is a weighted blend of 9 inputs, each scored 0–100. Each bar is that input's sub-score; the figure is the points it added to the 100-point composite (weight × sub-score).
- Cash flow +29.9/30.0
- ARV discount +15.0/15.0
- DSCR +10.0/10.0
- 1% rule +8.9/10.0
- Livability +4.0/5.0
- Rent growth +3.8/5.0
- Schools +3.2/10.0
- Condition / age +2.5/5.0
- Appreciation +0.0/10.0
$285,000
🖨 Deal sheet 📄 Offer letter ✓ Due diligence
Multi-family units
County records classify this as Multi-Family (2-4 Unit). Listing-text estimate: 1 unit. estimate disagrees with records
Listing remarks MLS
Great opportunity for Investor or owner occupant, convenient location close to Albany Medical center, Albany Law, 4 bedroom top floor units 3 bedrooms downstairs. Recently renovated kitchen, new floors, new windows, freshly painted. Unit 1 is currently rented at $1,498/month. Unit 2 is currently rented at $1,600/month. Stabilized gross rent is approximately $3,098/month ($37,176/year). Estimated operating expenses are: taxes ($5,473/yr), insurance ($1,600/yr), and water/sewer (~$1,200/yr), for total estimated annual operating expenses of ~$8,273 and estimated NOI of ~$28,903/year (~$2,408/month). Estimated Cap rate is approximately 10.1%.
Key facts
- New floors
- Freshly painted
- Convenient location
Tags
Neighborhood map
What this means for you Summary
Snapshot
- This is a 6-bed/2.0-bath multifamily listed at $285k.
Deal economics
- At list price, monthly cash flow is $1k ($13k/yr) — positive.
- The deal already cash-flows at list — no discount required.
- Meets the 1% rule at list price ($4k rent vs $285k).
- Recommended offer: $268k (6.0% below list) — sets the bar for market timing.
- Cap rate 10.7% vs local median 5.7% in Albany — top-decile yield for the area; either an underpriced asset or a hidden risk that comps aren't pricing in. Stress-test before assuming the spread holds.
Location & tenants
- Location reads 79/100 on livability (#129 in NY, #2,083 nationally) — a middle-class / working-renter tenant base. Strengths: amenities A+, commute A+, housing A+; Watch: employment C-, crime F.
- Albany City School District (urban): math 37% / reading 40% proficiency, ranked #543 of 590 in NY (top 92%) — families likely to look elsewhere, expect single-tenant / working-renter base with shorter leases; 66% free/reduced lunch — lower-income household profile, screen leases tightly.
- Market conditions: Rents rising fast (+5.0%/yr); 99 active listings in the ZIP; 675 units permitted in Albany County in 2024 (451 in 5+ unit buildings).
- At $3,951/mo this rent would consume 67% of the median local household income ($70k/yr) (locally 1952% of renters already pay >50% of income on rent) — very limited rent-growth headroom before tenants either downsize or default.
Forward outlook
- Local home prices are declining (-3.0%/yr); year-one equity from $2k of loan paydown is wiped out by about $9k of value loss. Plan a longer hold.
- Albany County population projected at +9% by 2050 — modest demand growth; plan on rents tracking national, not racing it.
- At projected returns (-3.0% appreciation + 5.0% rent growth), your $80k cash investment doubles in ~7 years — after that, you're playing with house money.
Negotiation context
- It's been on market 90 days — a 6% lower offer ($268k) is reasonable based on typical stale-listing flexibility.
- 2 sale attempts since 5y ago with the ask held roughly flat each time — persistent listings suggest the price (not the market) is what's stuck; bring a comps-based counter.
- Current owner paid $196k; 45% above their basis — modest negotiation headroom, anchor on the comps not their cost.
Risks & watch-outs
- Watch-outs: built in 1900 — expect roof / HVAC / electrical / plumbing capex.
Questions for the listing agent
- It's been on market 90 days. Have you received any prior offers? Is the seller open to a 6% concession, seller financing, or rate buy-down credit?
- Built in 1900 — when were the roof, HVAC, electrical panel, plumbing, and water heater last replaced?
- Why hasn't it sold? Are there any deal-killer items the seller is aware of (foundation, flood, title, zoning, code violations)?
- Is there a deadline driving the sale (1031 exchange, divorce, estate, relocation)? That informs how much negotiation room exists.
- Crime grade is F in this area — have there been break-ins, vandalism, or insurance claims at this property in the last 3 years? What carrier currently insures it and at what premium?
- What's the average days-on-market for RENTAL listings here right now (not sales)? A rising rental-DOM trend means longer vacancies and softer asking-rent achievability than the comps imply.
- What's the recent tenant-quality profile in this submarket — average credit score on applications, eviction rate, late-payment / NSF rate, and stable-employment percentage? A property-management company in the area should have these aggregated.
- How much new apartment / multifamily construction is in the pipeline within 1–3 miles? Heavy new supply (>2% of stock underway) typically softens rents 12–24 months out; light construction supports rent growth.
Investment metrics
- 1% rule
- 1.39% ✓
- Cap rate
- 10.72%
- Cash-on-cash
- 15.82%
- DSCR
- 1.70
- GRM
- 6.0
CMA / ARV
- ARV (median comp)
- $431,479
- List price
- $285,000
- Delta
- -33.95%
- Verdict
- UNDERPRICED
- Comps
- 20 within 1.0 mi
Show comp detail 12 sales within ~0.75 mi
| Address | Dist | Beds/Ba | Sqft | Sold | Price | $/sf | Match |
|---|---|---|---|---|---|---|---|
| 645 Myrtle Ave | 0.09mi | 6/2.0 | 2,000 (+10%) | 5mo | $270,000 | $135 | 75 |
| 184 Quail St | 0.34mi | 6/3.0 | 1,853 (+2%) | 4mo | $231,000 | $125 | 73 |
| 454 Ontario St | 0.42mi | 5/2.0 (-1) | 1,776 (-2%) | 5mo | $290,000 | $163 | 67 |
| 680 State St | 0.38mi | 6/2.0 | 1,744 (-4%) | 19mo | $265,000 | $152 | 60 |
| 598 Morris St | 0.40mi | 6/2.0 | 2,000 (+10%) | 8mo | $220,000 | $110 | 58 |
| 106 Spring St | 0.43mi | 5/2.0 (-1) | 1,896 (+4%) | 13mo | $236,000 | $124 | 57 |
| 148 Quail St | 0.49mi | 6/2.0 | 2,058 (+13%) | 10mo | $160,000 | $78 | 47 |
| 708 State St | 0.38mi | 6/2.0 | 2,024 (+11%) | 20mo | $329,900 | $163 | 47 |
| 455 Myrtle Ave | 0.34mi | 5/2.0 (-1) | 2,040 (+12%) | 19mo | $291,000 | $143 | 43 |
| 721 State St | 0.41mi | 7/2.0 (+1) | 2,072 (+14%) | 18mo | $252,000 | $122 | 38 |
| 528 Madison Ave | 0.60mi | 5/4.0 (-1) | 1,994 (+10%) | 8mo | $330,000 | $165 | 37 |
| 951 State St | 0.72mi | 5/2.0 (-1) | 1,632 (-10%) | 13mo | $365,000 | $224 | 33 |
Match score weights: distance 35% · size 25% · config 20% · recency 20%. Top-matched comps best support the ARV.
Projected returns pro-forma
-3.0% appreciation · 5.05% rent growth · sell at horizon
- IRR
- 9.1%
- Equity multiple
- 1.37×
- Total profit
- $29,254
- Equity at exit
- $42,494
- IRR
- 20.0%
- Equity multiple
- 2.85×
- Total profit
- $147,824
- Equity at exit
- $24,642
Cash invested: $79,800 (down + closing). Projections, not guarantees.
Landlord ↔ Tenant lean methodology
- Overall (STATE)
- 15 Strongly Tenant-Friendly
- State New York
- 15 Strongly Tenant-Friendly · D+10
- County
- — inherits STATE
- City
- — inherits STATE
ZIP-level market 12208
- Home prices YoY
- -30.1%
- Rents YoY
- 5.0%
- Active inventory
- 99
- Price-to-rent
- 11.5×
Monthly cashflow live
- Estimated rent
- $3,951 high interval (Pro) →
- Mortgage (P&I)
- −$1,495
- Tax from tax record
- −$456 /mo · $5,472/yr
- Insurance
- −$119
- HOA
- −$0
- Vacancy / Maint / Mgmt
- −$830
- Net cashflow
- $1,052
Break-even live
2-unit breakdown (identical units grouped — click to expand)
| Units | Beds | Baths | Est. rent |
|---|---|---|---|
| 1× unit | 4 | 1 | $2,065 |
| 1× unit | 3 | 1 | $1,887 |
| Total (2 units) | $3,951 | ||
UW: 25.0% down · 7.5% · 30yr · 1.5% tax · 5.0% vac · 8.0% maint · 8.0% mgmt
Financing live
Cash to close
- Down payment
- $71,250
- Closing costs
- $8,550
- Reserves months
- —
- Total cash needed
- —
Loan-product check · same deal, 3 products live
Conventional
25% down · 7.5% · 30yr
- Down + closing
- —
- Monthly P&I
- —
- Monthly cashflow
- —
- DSCR
- —
- Eligible?
- —
Personal DTI + credit; lowest rate.
DSCR
20% down · 8.5% · 30yr
- Down + closing
- —
- Monthly P&I
- —
- Monthly cashflow
- —
- DSCR
- —
- Eligible?
- —
No personal income docs; deal must DSCR.
Hard money
10% down · 12.0% · 12mo
- Down + closing
- —
- Monthly P&I
- —
- Monthly cashflow
- —
- DSCR
- —
- Eligible?
- —
Short-term bridge; refi at stabilization.
Listing history 13 events
-
2026-06-03days on market $285,000 Active 90 DOM
-
2026-06-02days on market $285,000 Active 89 DOM
-
2026-06-01days on market $285,000 Active 88 DOM
-
2026-05-31days on market $285,000 Active 87 DOM
-
2026-05-31days on market $285,000 Active 86 DOM
-
2026-03-05$285,000 Active 646-char remark
Show marketing remark (646 chars)
Great opportunity for Investor or owner occupant, convenient location close to Albany Medical center, Albany Law, 4 bedroom top floor units 3 bedrooms downstairs. Recently renovated kitchen, new floors, new windows, freshly painted. Unit 1 is currently rented at $1,498/month. Unit 2 is currently rented at $1,600/month. Stabilized gross rent is approximately $3,098/month ($37,176/year). Estimated operating expenses are: taxes ($5,473/yr), insurance ($1,600/yr), and water/sewer (~$1,200/yr), for total estimated annual operating expenses of ~$8,273 and estimated NOI of ~$28,903/year (~$2,408/month). Estimated Cap rate is approximately 10.1%.
-
2022-02-22soldstatus $196,000
-
2021-12-14historical Contingent 447-char remark
Show marketing remark (447 chars)
Cash flowing 2 family walking distance to shopping and public transportation. Located in highly sought after rental area this cash flowing two family can be packaged with 62 other rental units and with several other properties within walking distance to each other. This is an Excellent opportunity for the seasoned investor or new investor looking to build their portfolio and keep management costs down! 24 hour notice required for all showings!
-
2021-09-21price $204,900 447-char remark
Show marketing remark (447 chars)
Cash flowing 2 family walking distance to shopping and public transportation. Located in highly sought after rental area this cash flowing two family can be packaged with 62 other rental units and with several other properties within walking distance to each other. This is an Excellent opportunity for the seasoned investor or new investor looking to build their portfolio and keep management costs down! 24 hour notice required for all showings!
-
2021-07-11$219,900 New 447-char remark
Show marketing remark (447 chars)
Cash flowing 2 family walking distance to shopping and public transportation. Located in highly sought after rental area this cash flowing two family can be packaged with 62 other rental units and with several other properties within walking distance to each other. This is an Excellent opportunity for the seasoned investor or new investor looking to build their portfolio and keep management costs down! 24 hour notice required for all showings!
-
2000-04-10soldstatus $77,600
-
1999-06-14soldstatus $46,000
-
1999-03-30soldstatus $25,000
ⓘ Source: listings_history table (triggers on properties + properties_extension) + one-shot
backfill from property_details.listing_events for pre-trigger history.
Tax reassessment forecast NY · Partial reset (capped growth)
- Current annual tax
- $5,472 · $456/mo
- Projected year-2 tax
- $5,472 · $456/mo
- Expected delta
- $0/yr ($0/mo · 0.0%)
ⓘ Screening estimate from a state-policy table — verify with the county assessor before closing.
Climate risk First Street
- Flood 1/10 Low FEMA zone X (unshaded) · 0% chance over 30 yrs
- Wildfire 1/10 Low
- Heat 4/10 Moderate 7 d/yr ≥97°F today · 17 d/yr by 30 yrs out
- Wind 3/10 Moderate 6% chance of damaging wind over 30 yrs
- Air quality 1/10 Low 0 unhealthy d/yr today · 0 by 30 yrs out
Nearby sold comps map
Loading sold comps map…
Walkable amenities ~0.75 mi
Loading nearby amenities…
Taxation est. · year 1
- Rental income
- $47,412
- − Mortgage interest
- −$15,964
- − Property taxes
- −$5,472
- − Insurance
- −$1,425
- − Repairs & maintenance
- −$3,793
- − Management
- −$3,793
- − Depreciation
- −$8,291
- Taxable income
- $8,674
- Est. tax owed @ 24.0%
- −$2,082
- After-tax cash flow
- $10,542/yr
For passive investors: Depreciation is non-cash, so a rental often shows a tax loss while cash-flowing — sheltering income. Rental losses are passive: they offset passive income freely, and up to $25,000/yr can offset ordinary (W-2) income if you actively participate and your MAGI is under $100k (phasing out to $0 by $150k); unused losses carry forward. On sale, claimed depreciation is recaptured at up to 25%, and gains may owe capital-gains tax (a 1031 exchange can defer both). Figures are a year-1 estimate at your 24.0% rate — not tax advice; consult a CPA.
Schools (NCES district)
- District
- Albany City School District
- NCES district ID
- 3602460
- Math proficiency
- 37% ▲ 6.00%
- Reading proficiency
- 40% ▲ 7.00%
- Median HH income
- $40,568
- Composite
- 32.34/100
- National rank
- #5744
- State rank
- #543 of 590 in NY
Livability — Albany
- Score
- 79/100
- State rank
- #129
- US rank
- #2083
Category grades
Schools grade is shown separately in the Schools card above.
Census & demographics
- Census place
- Albany, NY
- County
- Albany County · 196,626 people
- City population
- 116,921
- Metro
- Albany-Schenectady-Troy, NY
- Population (ZIP)
- 23,289
- Household income
- $70,413
- Rent vs Own
- Severe rent burden
- 1952.0
Population outlook (Albany County) Hauer SSP2
- Today (2025)
- 320,794 people
- By 2030
- 327,401 · +2.1%
- By 2040
- 338,218 · +5.4%
- By 2050
- 348,467 · +8.6%
- By 2075
- 381,693 · +19.0%
- By 2100
- 393,809 · +22.8%
Race, ethnicity, and origin ACS 2023
- Neighborhood character
- Predominantly White (66%)
- Race & ethnicity
- White 66% Black 12% Asian 10% Hispanic / Latino 7% Two or more races 7%
- Hispanic origin (detail)
- Puerto Rican 3%
- Common ancestry
- Romanian 5% Italian 3% Scotch-Irish 3%
- Foreign-born
- 16% · Canada, China, Philippines
- Languages at home
- 83% English-only · Other Indo-European 4% Other Asian/Pacific 3% French/Haitian/Cajun 2%
Political lean MEDSL · Albany
- 2024 margin
- Strong D (+25.8) · D 62.9% · R 37.1%
- 2008→2024 swing
- -3.6pp toward R · 2008: 29.4pp · 2024: 25.8pp
- All cycles
- 2024: D+25.8 2020: D+31.4 2016: D+24.3 2012: D+31.0 2008: D+29.4
Not yet ingested
- Civics
- —
Market trends
- HPI YoY
- ▼ -120.46%
- Current HPI
- 279.716
- Rent YoY
- ▲ 5.05%
- Metro
- Albany-Schenectady-Troy, NY
- State GDP YoY
- ▲ 2.60%
- F500 in state
- 92
Industry mix (Fortune 500 HQ in NY)
| Industry | F500 HQs | Revenue |
|---|---|---|
| Financial Services | 10 | $950B |
|
||
| Consumer Goods | 9 | $162B |
|
||
| Insurance | 4 | $225B |
|
||
| Telecommunications | 2 | $144B |
|
||
| Pharmaceuticals | 2 | $112B |
|
||
| Media / Entertainment | 2 | $69B |
|
||
Price history
+1040.0% since first listed8 events — show timeline
- 2026-03-05 Listed $285,000 Global MLS
- 2022-02-22 Sold (Public Records) $196,000 Public Records
- 2021-12-14 Contingent — Global MLS
- 2021-09-21 Price Changed $204,900 Global MLS
- 2021-07-11 Listed $219,900 Global MLS
- 2000-04-10 Sold (Public Records) $77,600 Public Records
- 1999-06-14 Sold (Public Records) $46,000 Public Records
- 1999-03-30 Sold (Public Records) $25,000 Public Records
Property tax history
-0.4%/yrLatest (2025): $5,472 · -0.8% YoY. Source: county tax records.
Cash-flow waterfall
monthlySold comps — $/sqft
last 12 mo · ≤1 miLoading sold comps…