872 Massachusetts Ave #304 · Cambridge, MA
Flood risk No data
- FEMA flood zone
- —
- Chance of flooding over 30 yrs
- —
- Est. flood insurance / yr
- —
Fire risk No data
- Est. fire insurance / yr
- —
Heat risk 6/10 · Moderate
- Hot days now (above threshold)
- 7 days/yr
- Hot days in 30 yrs
- 15 days/yr
Wind risk No data
- Chance of severe wind over 30 yrs
- —
Air-quality risk 3/10 · Minor
- Unhealthy air days now
- 3 days/yr
- Unhealthy air days in 30 yrs
- 3 days/yr
Risk factors via First Street. Map © Google.
Why this score? — see what drove the D- grade
The composite is a weighted blend of 9 inputs, each scored 0–100. Each bar is that input's sub-score; the figure is the points it added to the 100-point composite (weight × sub-score).
- ARV discount +15.0/15.0
- Appreciation +5.7/10.0
- Schools +4.6/10.0
- Livability +4.2/5.0
- Cash flow +3.6/30.0
- Rent growth +3.1/5.0
- Condition / age +2.5/5.0
- 1% rule +1.0/10.0
- DSCR +0.0/10.0
$615,000
🖨 Deal sheet 📄 Offer letter ✓ Due diligence
Listing remarks MLS
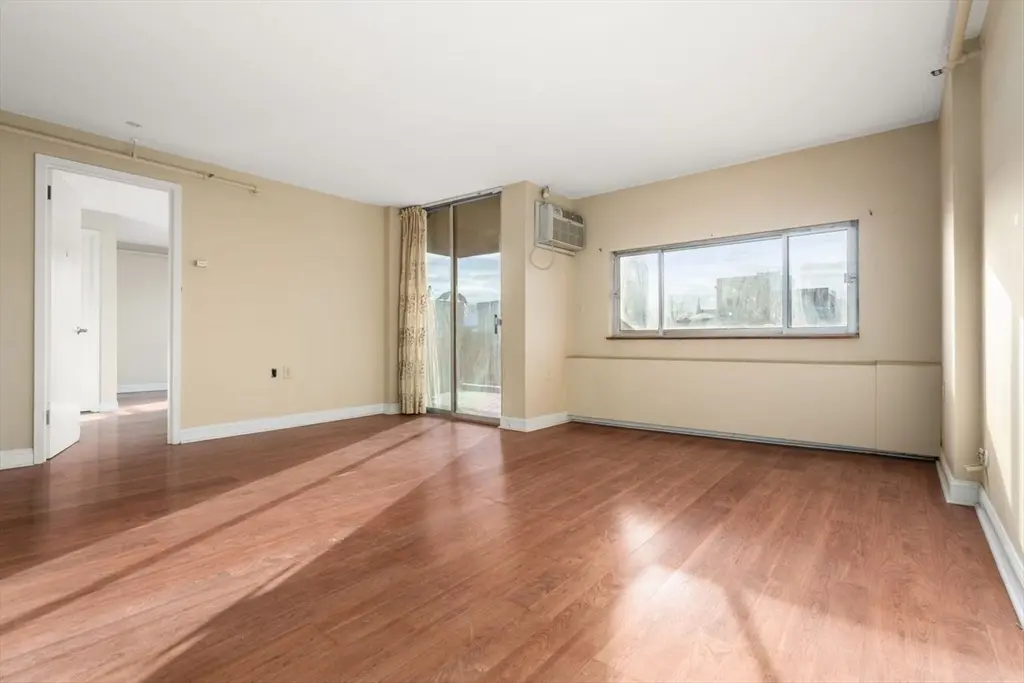
Positioned between Central and Harvard Squares, this Cambridge residence offers a well-designed layout in a highly desirable location. The bedroom provides generous closet space, a full en-suite bathroom and direct access to a private east-facing balcony—an ideal spot to enjoy fresh air from the comfort of home. The living room connects seamlessly to the kitchen featuring quartz countertops and a passthrough window, making both daily living and entertaining feel effortless. This professionally managed building includes garage parking with remote access, a monitored mailroom, dual elevators, on-site laundry, and dedicated storage. While convenient access to public transportation, several Red Line stations and bus stops within a mile, provide this location with exceptional accessibility. All of this plus easy access to Harvard, MIT, and the Charles River, make this pet friendly building perfect for owners and investors alike.
Key facts
- On site laundry
- Quartz countertops
- Monitored mailroom
Tags
Neighborhood map
What this means for you Summary
Snapshot
- This is a 1-bed/1.5-bath condo listed at $615k.
Deal economics
- At list price, monthly cash flow is $-2k ($-22k/yr) — negative.
- To cash-flow at today's rent, offer at most $421k (31.5% below list).
- To meet the 1% rule (rent ≥ 1% of price), the offer needs to be $369k (40.1% below list).
- Recommended offer: $369k (40.1% below list) — sets the bar for 1% rule.
- Cap rate 2.7% vs local median 1.8% in Cambridge — top-decile yield for the area; either an underpriced asset or a hidden risk that comps aren't pricing in. Stress-test before assuming the spread holds.
Location & tenants
- Location reads 84/100 on livability (#15 in MA, #654 nationally) — a professional / high-income tenant draw. Strengths: schools A+, amenities A+, commute A+; Watch: crime F, cost of living F.
- Cambridge (urban): math 42% / reading 59% proficiency, ranked #117 of 302 in MA (top 39%) — acceptable for families but not a draw, mixed tenant base, ~2y average lease.
- Market conditions: Rents rising (+2.5%/yr); 50 active listings in the ZIP; 40 comparable units currently listed for rent nearby; rentals at typical pace (median 22d on market — plan ~3-4 weeks tenant-placement turnaround); high-income renter base; 3,670 units permitted in Middlesex County in 2024 (2,611 in 5+ unit buildings).
- This rent runs 33% of the median local income ($135k/yr) — at the standard rent-burdened threshold; future hikes will face affordability resistance.
Forward outlook
- In year one you build about $13k of equity ($4k loan paydown + $9k appreciation (1.4% local appreciation)).
- Middlesex County population projected at +20% by 2050 — long-run rental-demand tailwind backs the buy-and-hold thesis.
- By year 4, paydown + projected appreciation supports a ~$45k cash-out refi (75% LTV) — recoverable capital for the next deal without selling this one.
Negotiation context
- It's been on market 85 days — a 6% lower offer ($578k) is reasonable based on typical stale-listing flexibility.
- 2 sale attempts since 18y ago with the ask held roughly flat each time — persistent listings suggest the price (not the market) is what's stuck; bring a comps-based counter.
- Current owner paid $225k; list at $615k implies a 173% gain — meaningful room to come down on a strong offer.
Risks & watch-outs
- Climate carrying-cost: extreme-heat days projected 7→15/yr by 2055 (HVAC capex compounding) — expect insurance premiums to compound above CPI over the hold.
Questions for the listing agent
- What do current leases actually rent for vs. the listed asking? Can we see a recent rent roll and the last 12 months of T-12 income?
- It's been on market 85 days. Have you received any prior offers? Is the seller open to a 40% concession, seller financing, or rate buy-down credit?
- Built in 1964 — when were the roof, HVAC, electrical panel, plumbing, and water heater last replaced?
- What does the HOA fee cover, when was the last increase, and are there any pending special assessments or reserve-fund shortfalls?
- Any open or pending special assessments — roof, HVAC, plumbing, elevator, façade? What's the per-unit balance and payoff schedule, and is the seller paying it off at close or rolling it to the buyer?
- Why hasn't it sold? Are there any deal-killer items the seller is aware of (foundation, flood, title, zoning, code violations)?
- Is there a deadline driving the sale (1031 exchange, divorce, estate, relocation)? That informs how much negotiation room exists.
- Schools are A-rated — typically a magnet for longer-tenancy family renters. What's the average tenant stay here, and is there a school-zone premium baked into asking?
- Crime grade is F in this area — have there been break-ins, vandalism, or insurance claims at this property in the last 3 years? What carrier currently insures it and at what premium?
- The area grade is low — what's the realistic commute time and amenity access for the typical tenant pool here? Any planned neighborhood developments (good or bad) we should know about?
- What's the average days-on-market for RENTAL listings here right now (not sales)? A rising rental-DOM trend means longer vacancies and softer asking-rent achievability than the comps imply.
- What's the recent tenant-quality profile in this submarket — average credit score on applications, eviction rate, late-payment / NSF rate, and stable-employment percentage? A property-management company in the area should have these aggregated.
- How much new apartment / multifamily construction is in the pipeline within 1–3 miles? Heavy new supply (>2% of stock underway) typically softens rents 12–24 months out; light construction supports rent growth.
Investment metrics
- 1% rule
- 0.60% ✗
- Cap rate
- 2.72%
- Cash-on-cash
- -12.77%
- DSCR
- 0.43
- GRM
- 13.9
CMA / ARV
- ARV (median comp)
- $739,841
- List price
- $615,000
- Delta
- -16.87%
- Verdict
- UNDERPRICED
- Comps
- 20 within 1.0 mi
Projected returns pro-forma
1.4% appreciation · 2.53% rent growth · sell at horizon
- IRR
- -10.6%
- Equity multiple
- 0.45×
- Total profit
- $-94,410
- Equity at exit
- $222,885
- IRR
- -4.9%
- Equity multiple
- 0.38×
- Total profit
- $-107,351
- Equity at exit
- $306,467
Cash invested: $172,200 (down + closing). Projections, not guarantees.
Landlord ↔ Tenant lean methodology
- Overall (STATE)
- 20 Strongly Tenant-Friendly
- State Massachusetts
- 20 Strongly Tenant-Friendly · D+15
- County
- — inherits STATE
- City
- — inherits STATE
ZIP-level market 02139
- Home prices YoY
- 0.4%
- Rents YoY
- 2.5%
- Active inventory
- 50
- Price-to-rent
- 13.9×
Monthly cashflow live
- Estimated rent
- $3,686 high interval (Pro) →
- Mortgage (P&I)
- −$3,225
- Tax est. 1.5%
- −$769 /mo · $9,225/yr
- Insurance
- −$256
- HOA est. from 5 same-building comps
- −$494
- Vacancy / Maint / Mgmt
- −$774
- Net cashflow
- $-1,832
Break-even live
UW: 25.0% down · 7.5% · 30yr · 1.5% tax · 5.0% vac · 8.0% maint · 8.0% mgmt
Financing live
Cash to close
- Down payment
- $153,750
- Closing costs
- $18,450
- Reserves months
- —
- Total cash needed
- —
Loan-product check · same deal, 3 products live
Conventional
25% down · 7.5% · 30yr
- Down + closing
- —
- Monthly P&I
- —
- Monthly cashflow
- —
- DSCR
- —
- Eligible?
- —
Personal DTI + credit; lowest rate.
DSCR
20% down · 8.5% · 30yr
- Down + closing
- —
- Monthly P&I
- —
- Monthly cashflow
- —
- DSCR
- —
- Eligible?
- —
No personal income docs; deal must DSCR.
Hard money
10% down · 12.0% · 12mo
- Down + closing
- —
- Monthly P&I
- —
- Monthly cashflow
- —
- DSCR
- —
- Eligible?
- —
Short-term bridge; refi at stabilization.
Rent comps 40 comps
| Address | Beds | Baths | Sqft | Rent | $/sqft | DOM | Units | Dist |
|---|---|---|---|---|---|---|---|---|
| 854 Massachusetts Ave #3 Cambridge, MA | 1.0 | 1.0 | 639 | $2,800 | $4.38 | 16d | 1 | 0.03mi |
| 345 Franklin St Cambridge, MA | 2.0 | 2.0 | 1100 | $4,100 | $3.73 | 10d | 4 | 0.06mi |
| 345 Franklin St Cambridge, MA | 2.0 | 1.5–2.0 | 1300 | $4,200 | $3.23 | 1d | 3 | 0.06mi |
| 516 Green St Cambridge, MA | 2.0 | 1.0 | 750 | $3,650 | $4.87 | 24d | 1 | 0.07mi |
| 516 Green St Cambridge, MA | 2.0 | 1.0 | 750 | $3,650 | $4.87 | 16d | 1 | 0.07mi |
| 881 Massachusetts Ave Unit 54 Cambridge, MA | 2.0 | 1.0 | 799 | $3,200 | $4.01 | 7d | 1 | 0.07mi |
| 50 Kinnaird St #1154 Cambridge, MA | 2.0–3.0 | 2.0–2.5 | 1149 | $4,540 | $3.95 | 1d | 2 | 0.08mi |
| 885 Massachusetts Ave Cambridge, MA | 2.0 | 1.0 | 1000 | $3,500 | $3.50 | 43d | 1 | 0.08mi |
| 332 Franklin St Cambridge, MA | 2.0 | 2.0 | 1089 | $4,500 | $4.13 | 14d | 1 | 0.09mi |
| 13 Pleasant St Cambridge, MA | 2.0 | 1.0 | 999 | $3,600 | $3.60 | 43d | 1 | 0.12mi |
| 88 Hancock St Cambridge, MA | 2.0 | 1.0 | 774 | $3,200 | $4.13 | 12d | 1 | 0.12mi |
| 15 Bigelow St #5 Cambridge, MA | 1.0 | 1.0 | 548 | $3,000 | $5.47 | 17d | 1 | 0.14mi |
| 929 Massachusetts Ave Cambridge, MA | 2.0 | 1.0–2.0 | 547 | $3,218 | $5.88 | 2d | 15 | 0.15mi |
| 23 Jay St Cambridge, MA | 1.0 | 1.0 | 800 | $4,995 | $6.24 | 24d | 1 | 0.16mi |
| 23 Jay St Cambridge, MA | 2.0 | 1.0 | 900 | $6,825 | $7.58 | 43d | 1 | 0.16mi |
| 23 Jay St Unit 1238102P Cambridge, MA | 1.0 | 1.5 | 893 | $3,939 | $4.41 | 14d | 1 | 0.16mi |
| 32 Bay St #32 Cambridge, MA | 2.0 | 2.0 | 710 | $3,800 | $5.35 | 43d | 1 | 0.17mi |
| 25 Jay St Unit 1238070P Cambridge, MA | 2.0 | 1.5 | 893 | $5,079 | $5.69 | 20d | 1 | 0.17mi |
| 14 Centre St Cambridge, MA | 2.0–3.0 | 1.0 | 1095 | $2,650 | $2.42 | 23d | 1 | 0.17mi |
| 5 Centre St Cambridge, MA | 2.0 | 1.0 | 874 | $4,000 | $4.58 | 7d | 1 | 0.17mi |
| 32 Bigelow St Cambridge, MA | 2.0 | 1.0 | 906 | $4,500 | $4.97 | 24d | 1 | 0.20mi |
| 17 Centre St Cambridge, MA | 1.0 | 1.0 | 780 | $3,600 | $4.62 | 24d | 1 | 0.21mi |
| 27 Magee St #1 Cambridge, MA | 1.0 | 1.0 | 600 | $2,300 | $3.83 | 21d | 1 | 0.21mi |
| 334 Harvard St #90 Cambridge, MA | 2.0 | 1.0 | 664 | $3,990 | $6.01 | 20d | 1 | 0.22mi |
| 10 Magazine St Cambridge, MA | 2.0–3.0 | 2.0–3.0 | 1011 | $4,585 | $4.53 | 1d | 3 | 0.24mi |
| 287 Harvard St Cambridge, MA | 3.0 | 1.0–2.0 | 685 | $3,467 | $5.06 | 1d | 2 | 0.25mi |
| 632 Massachusetts Ave Cambridge, MA | 2.0 | 2.0 | 1232 | $4,220 | $3.43 | 7d | 1 | 0.25mi |
| 43 Lee St #1 Cambridge, MA | 1.0 | 1.0 | 1060 | $3,700 | $3.49 | 43d | 1 | 0.25mi |
| 9 Dana St Unit 23 Cambridge, MA | 2.0 | 1.0 | 725 | $3,975 | $5.48 | 43d | 1 | 0.25mi |
| 266 Harvard St Unit 1273 Cambridge, MA | 2.0 | 1.0 | 620 | $3,560 | $5.74 | 43d | 1 | 0.26mi |
| 333 Harvard St Cambridge, MA | 2.0–3.0 | 1.0 | 813 | $3,495 | $4.30 | 43d | 1 | 0.27mi |
| 172 Auburn St #2 Cambridge, MA | 1.0 | 1.0 | 755 | $3,500 | $4.64 | 43d | 1 | 0.27mi |
| 6 West St Unit 1 Cambridge, MA | 2.0 | 1.0 | 878 | $3,150 | $3.59 | 14d | 1 | 0.27mi |
| 16 Ellery St #105 Cambridge, MA | 2.0 | 1.0 | 868 | $3,600 | $4.15 | 23d | 1 | 0.28mi |
| 350 Harvard St Cambridge, MA | 1.0 | 1.0 | 600 | $3,000 | $5.00 | 43d | 1 | 0.29mi |
| 66 Callender St Cambridge, MA | 2.0 | 1.0 | 900 | $3,500 | $3.89 | 43d | 1 | 0.29mi |
| 10 Essex St Unit 1259 Cambridge, MA | 2.0 | 1.0 | 739 | $4,840 | $6.55 | 43d | 1 | 0.30mi |
| 10 Essex St Unit 406 Cambridge, MA | 2.0 | 2.0 | 1064 | $5,500 | $5.17 | 24d | 1 | 0.30mi |
| 10 Essex St Unit 203 Cambridge, MA | 1.0 | 1.0 | 739 | $4,200 | $5.68 | 17d | 1 | 0.30mi |
| 10 Essex St Unit 407 Cambridge, MA | 1.0 | 1.0 | 557 | $3,800 | $6.82 | 17d | 1 | 0.30mi |
HOA detail condo
- Monthly dues
- $0 · $0/yr
- Assessments
- None detected in remarks — confirm with the listing agent.
Listing history 20 events
-
2026-06-18days on market $615,000 Active 85 DOM
-
2026-06-17days on market $615,000 Active 84 DOM
-
2026-06-16days on market $615,000 Active 83 DOM
-
2026-06-15days on market $615,000 Active 82 DOM
-
2026-06-13days on market $615,000 Active 80 DOM
-
2026-06-13days on market $615,000 Active 79 DOM
-
2026-06-09days on market $615,000 Active 76 DOM
-
2026-06-08days on market $615,000 Active 75 DOM
-
2026-06-07days on market $615,000 Active 74 DOM
-
2026-06-04days on market $615,000 Active 71 DOM
-
2026-06-03days on market $615,000 Active 70 DOM
-
2026-06-02days on market $615,000 Active 69 DOM
-
2026-06-01days on market $615,000 Active 68 DOM
-
2026-05-31days on market $615,000 Active 67 DOM
-
2026-03-25$615,000 New 943-char remark
Show marketing remark (943 chars)
Positioned between Central and Harvard Squares, this Cambridge residence offers a well-designed layout in a highly desirable location. The bedroom provides generous closet space, a full en-suite bathroom and direct access to a private east-facing balcony—an ideal spot to enjoy fresh air from the comfort of home. The living room connects seamlessly to the kitchen featuring quartz countertops and a passthrough window, making both daily living and entertaining feel effortless. This professionally managed building includes garage parking with remote access, a monitored mailroom, dual elevators, on-site laundry, and dedicated storage. While convenient access to public transportation, several Red Line stations and bus stops within a mile, provide this location with exceptional accessibility. All of this plus easy access to Harvard, MIT, and the Charles River, make this pet friendly building perfect for owners and investors alike.
-
2008-09-16historical 142-char remark
Show marketing remark (142 chars)
OPEN HOUSE SUNDAY JULY 13TH 11:30 - 1:00 location, location,750sq. ft., 1 1/2 bath, private balcony, laundry, elevator close to T, shops, park
-
2008-09-15soldstatus $225,000 Sold 142-char remark
Show marketing remark (142 chars)
OPEN HOUSE SUNDAY JULY 13TH 11:30 - 1:00 location, location,750sq. ft., 1 1/2 bath, private balcony, laundry, elevator close to T, shops, park
-
2008-07-24historical 142-char remark
Show marketing remark (142 chars)
OPEN HOUSE SUNDAY JULY 13TH 11:30 - 1:00 location, location,750sq. ft., 1 1/2 bath, private balcony, laundry, elevator close to T, shops, park
-
2008-07-12price $257,000 142-char remark
Show marketing remark (142 chars)
OPEN HOUSE SUNDAY JULY 13TH 11:30 - 1:00 location, location,750sq. ft., 1 1/2 bath, private balcony, laundry, elevator close to T, shops, park
-
2008-06-30$269,000 142-char remark
Show marketing remark (142 chars)
OPEN HOUSE SUNDAY JULY 13TH 11:30 - 1:00 location, location,750sq. ft., 1 1/2 bath, private balcony, laundry, elevator close to T, shops, park
ⓘ Source: listings_history table (triggers on properties + properties_extension) + one-shot
backfill from property_details.listing_events for pre-trigger history.
Climate risk First Street
- Heat 6/10 Major
- Air quality 3/10 Moderate 3 unhealthy d/yr today · 3 by 30 yrs out
Nearby sold comps map
Loading sold comps map…
Walkable amenities ~0.75 mi
Loading nearby amenities…
Taxation est. · year 1
- Rental income
- $44,232
- − Mortgage interest
- −$34,450
- − Property taxes
- −$9,225
- − Insurance
- −$3,075
- − Repairs & maintenance
- −$3,539
- − Management
- −$3,539
- − HOA
- −$5,928
- − Depreciation
- −$17,891
- Taxable loss
- −$33,414
- Est. tax savings @ 24.0%
- +$8,019
- After-tax cash flow
- $-13,967/yr
For passive investors: Depreciation is non-cash, so a rental often shows a tax loss while cash-flowing — sheltering income. Rental losses are passive: they offset passive income freely, and up to $25,000/yr can offset ordinary (W-2) income if you actively participate and your MAGI is under $100k (phasing out to $0 by $150k); unused losses carry forward. On sale, claimed depreciation is recaptured at up to 25%, and gains may owe capital-gains tax (a 1031 exchange can defer both). Figures are a year-1 estimate at your 24.0% rate — not tax advice; consult a CPA.
Schools (NCES district)
- District
- Cambridge
- NCES district ID
- 2503270
- Math proficiency
- 42% ▼ -12.00%
- Reading proficiency
- 59% ▼ -1.00%
- Median HH income
- $76,444
- Composite
- 45.66/100
- National rank
- #2580
- State rank
- #117 of 302 in MA
Livability — Cambridge
- Score
- 84/100
- State rank
- #15
- US rank
- #654
Category grades
Schools grade is shown separately in the Schools card above.
Census & demographics
- Census place
- Cambridge, MA
- County
- Middlesex County · 1,437,704 people
- City population
- 119,000
- Metro
- Boston-Cambridge-Newton, MA-NH
- Population (ZIP)
- 40,033
- Household income
- $134,586
- Rent vs Own
- Severe rent burden
- 2031.0
Population outlook (Middlesex County) Hauer SSP2
- Today (2025)
- 1,740,269 people
- By 2030
- 1,817,187 · +4.4%
- By 2040
- 1,963,195 · +12.8%
- By 2050
- 2,087,461 · +20.0%
- By 2075
- 2,344,036 · +34.7%
- By 2100
- 2,383,776 · +37.0%
Race, ethnicity, and origin ACS 2023
- Neighborhood character
- Diverse neighborhood (Simpson 0.67)
- Race & ethnicity
- White 52% Asian 20% Black 13% Two or more races 10% Hispanic / Latino 9%
- Hispanic origin (detail)
- Mexican 1% Puerto Rican 3%
- Common ancestry
- Romanian 3% Scotch-Irish 3% Italian 2%
- Foreign-born
- 28% · Canada, China, South Korea
- Languages at home
- 65% English-only · Chinese 8% Spanish 8% Other Indo-European 5%
Political lean MEDSL · Middlesex
- 2024 margin
- Solid D (+39.5) · D 68.5% · R 29.0% · Other 2.5%
- 2008→2024 swing
- +9.3pp toward D · 2008: 30.1pp · 2024: 39.5pp
- All cycles
- 2024: D+39.5 2020: D+45.2 2016: D+38.1 2012: D+26.9 2008: D+30.1
Not yet ingested
- Civics
- —
Market trends
- HPI YoY
- ▲ 1.40%
- Current HPI
- 321.947
- Rent YoY
- ▲ 2.53%
- Metro
- Boston-Cambridge-Newton, MA-NH
- State GDP YoY
- ▲ 2.28%
- F500 in state
- 38
Industry mix (Fortune 500 HQ in MA)
| Industry | F500 HQs | Revenue |
|---|---|---|
| Technology | 3 | $17B |
|
||
| Insurance | 2 | $84B |
|
||
| Retail | 2 | $76B |
|
||
| Life Sciences | 1 | $43B |
|
||
| Energy Technology | 1 | $31B |
|
||
| Aerospace / Defense | 1 | $18B |
|
||
Price history
+128.6% since first listed6 events — show timeline
- 2026-03-25 Listed $615,000 MLS PIN
- 2008-09-16 Listing Removed — MLS PIN
- 2008-09-15 Sold (MLS) $225,000 MLS PIN
- 2008-07-24 Contingent — MLS PIN
- 2008-07-12 Price Changed $257,000 MLS PIN
- 2008-06-30 Listed $269,000 MLS PIN
Cash-flow waterfall
monthlySold comps — $/sqft
last 12 mo · ≤1 miLoading sold comps…