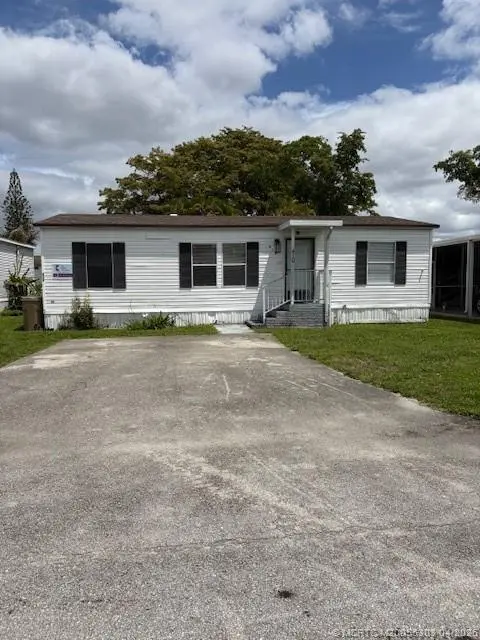
410 SW 134 Way · Davie, FL
Flood risk 1/10 · Minimal
- FEMA flood zone
- X (shaded)
- Chance of flooding over 30 yrs
- 0.0%
- Est. flood insurance / yr
- $507 – $1,088
Fire risk 1/10 · Minimal
- Est. fire insurance / yr
- $947 – $1,759
Heat risk 10/10 · Severe
- Hot days now (above 106°F)
- 7 days/yr
- Hot days in 30 yrs
- 27 days/yr
Wind risk 10/10 · Severe
- Chance of severe wind over 30 yrs
- 99.0%
Air-quality risk 3/10 · Minor
- Unhealthy air days now
- 2 days/yr
- Unhealthy air days in 30 yrs
- 3 days/yr
Risk factors via First Street. Map © Google.
Why this score? — see what drove the D+ grade
The composite is a weighted blend of 9 inputs, each scored 0–100. Each bar is that input's sub-score; the figure is the points it added to the 100-point composite (weight × sub-score).
- Cash flow +15.0/30.0
- ARV discount +7.5/15.0
- 1% rule +5.0/10.0
- DSCR +5.0/10.0
- Schools +4.1/10.0
- Livability +4.1/5.0
- Condition / age +3.8/5.0
- Rent growth +2.3/5.0
- Appreciation +0.0/10.0
$69,900
🖨 Deal sheet 📄 Offer letter ✓ Due diligence
Listing remarks
Foreclosure- Bank owned home, Updated Home, 3 bedrooms, 2 baths
Key facts
- 2 parking spots
- Built 1996
- Listed 63 days
Property features AI
Finance
- Other: Pets allowed
- HOA & community: Homeowners association present; HOA fee of $1,206; HOA covers common area maintenance and grounds maintenance
Exterior
- Parking: 2 total parking spaces; 2 covered parking spaces
- Utilities: Electricity available
- Home design: Single-story; Resale property
- Construction: Aluminum siding
- Exterior features: Street lights; Non-gated community
Interior
- Bathrooms: 2 full bathrooms
- Heating & cooling: Central heating; Central air conditioning
- Interior features: Unfurnished
Neighborhood map
What this means for you Summary
Snapshot
- This is a 3-bed/2.0-bath manufactured listed at $70k. Condition is rated good.
Deal economics
- At list price, monthly cash flow is $633 ($8k/yr) — positive.
- The deal already cash-flows at list — no discount required.
- Meets the 1% rule at list price ($3k rent vs $70k).
- Recommended offer: $66k (6.0% below list) — sets the bar for market timing.
- Cap rate 17.2% vs local median 3.4% in Davie — top-decile yield for the area; either an underpriced asset or a hidden risk that comps aren't pricing in. Stress-test before assuming the spread holds.
Location & tenants
- Location reads 82/100 on livability (#68 in FL, #1,159 nationally) — a professional / high-income tenant draw. Strengths: schools A+, crime A+, housing A+; Watch: cost of living D, amenities D-.
- Broward (suburban): math 42% / reading 53% proficiency, ranked #46 of 73 in FL (top 63%) — families likely to look elsewhere, expect single-tenant / working-renter base with shorter leases.
- Market conditions: Rents soft (-0.9%/yr); 176 active listings in the ZIP; 40 comparable units currently listed for rent nearby; rentals at typical pace (median 19d on market — plan ~3-4 weeks tenant-placement turnaround); solid renter incomes; 2,111 units permitted in Broward County in 2024 (1,265 in 5+ unit buildings).
- This rent runs 35% of the median local income ($101k/yr) — at the standard rent-burdened threshold; future hikes will face affordability resistance.
Forward outlook
- Local home prices are declining (-3.0%/yr); year-one equity from $483 of loan paydown is wiped out by about $2k of value loss. Plan a longer hold.
- Broward County population projected at +34% by 2050 — long-run rental-demand tailwind backs the buy-and-hold thesis.
- At projected returns (-3.0% appreciation + 0.0% rent growth), your $20k cash investment doubles in ~4 years — after that, you're playing with house money.
Negotiation context
- It's been on market 63 days — a 6% lower offer ($66k) is reasonable based on typical stale-listing flexibility.
Risks & watch-outs
- Watch-outs: HOA is 41% of rent.
- Climate carrying-cost: severe wind risk, 99% chance of damaging wind over 30y; extreme-heat days projected 7→27/yr by 2055 (HVAC capex compounding) — expect insurance premiums to compound above CPI over the hold.
Questions for the listing agent
- It's been on market 63 days. Have you received any prior offers? Is the seller open to a 6% concession, seller financing, or rate buy-down credit?
- What does the HOA fee cover, when was the last increase, and are there any pending special assessments or reserve-fund shortfalls?
- Why hasn't it sold? Are there any deal-killer items the seller is aware of (foundation, flood, title, zoning, code violations)?
- Is there a deadline driving the sale (1031 exchange, divorce, estate, relocation)? That informs how much negotiation room exists.
- Schools are A-rated — typically a magnet for longer-tenancy family renters. What's the average tenant stay here, and is there a school-zone premium baked into asking?
- The area grade is low — what's the realistic commute time and amenity access for the typical tenant pool here? Any planned neighborhood developments (good or bad) we should know about?
- What's the average days-on-market for RENTAL listings here right now (not sales)? A rising rental-DOM trend means longer vacancies and softer asking-rent achievability than the comps imply.
- What's the recent tenant-quality profile in this submarket — average credit score on applications, eviction rate, late-payment / NSF rate, and stable-employment percentage? A property-management company in the area should have these aggregated.
- How much new for-sale + rental construction is in the pipeline within 1–3 miles? Heavy new supply typically softens prices + rents 12–24 months out; constrained supply supports both.
Investment metrics
- 1% rule
- 4.21% ✓
- Cap rate
- 17.17%
- Cash-on-cash
- 38.84%
- DSCR
- 2.73
- GRM
- 2.0
CMA / ARV
- ARV (on-the-fly)
- $156,200
- Comps found
- 1
Show comp detail 1 sale within ~0.75 mi
| Address | Dist | Beds/Ba | Sqft | Sold | Price | $/sf | Match |
|---|---|---|---|---|---|---|---|
| 441 NW 135th Way | 0.70mi | 2/2.0 (-1) | 984 (-10%) | 13mo | $140,000 | $142 | 34 |
Match score weights: distance 35% · size 25% · config 20% · recency 20%. Top-matched comps best support the ARV.
Projected returns pro-forma
-3.0% appreciation · 0.0% rent growth · sell at horizon
- IRR
- 28.2%
- Equity multiple
- 2.08×
- Total profit
- $21,185
- Equity at exit
- $10,422
- IRR
- 31.7%
- Equity multiple
- 3.06×
- Total profit
- $40,290
- Equity at exit
- $6,044
Cash invested: $19,572 (down + closing). Projections, not guarantees.
Landlord ↔ Tenant lean methodology
- Overall (STATE)
- 87 Strongly Landlord-Friendly
- State Florida
- 87 Strongly Landlord-Friendly · R+3
- County
- — inherits STATE
- City
- — inherits STATE
ZIP-level market 33325
- Rents YoY
- -0.9%
- Active inventory
- 176
- Price-to-rent
- 2.0×
Monthly cashflow live
- Estimated rent
- $2,940 high interval (Pro) →
- Mortgage (P&I)
- −$367
- Tax est. 1.5%
- −$87 /mo · $1,048/yr
- Insurance
- −$29
- HOA
- −$1,206
- Vacancy / Maint / Mgmt
- −$617
- Net cashflow
- $633
Break-even live
UW: 25.0% down · 7.5% · 30yr · 1.5% tax · 5.0% vac · 8.0% maint · 8.0% mgmt
Financing live
Cash to close
- Down payment
- $17,475
- Closing costs
- $2,097
- Reserves months
- —
- Total cash needed
- —
Loan-product check · same deal, 3 products live
Conventional
25% down · 7.5% · 30yr
- Down + closing
- —
- Monthly P&I
- —
- Monthly cashflow
- —
- DSCR
- —
- Eligible?
- —
Personal DTI + credit; lowest rate.
DSCR
20% down · 8.5% · 30yr
- Down + closing
- —
- Monthly P&I
- —
- Monthly cashflow
- —
- DSCR
- —
- Eligible?
- —
No personal income docs; deal must DSCR.
Hard money
10% down · 12.0% · 12mo
- Down + closing
- —
- Monthly P&I
- —
- Monthly cashflow
- —
- DSCR
- —
- Eligible?
- —
Short-term bridge; refi at stabilization.
Rent comps 40 comps
| Address | Beds | Baths | Sqft | Rent | $/sqft | DOM | Units | Dist |
|---|---|---|---|---|---|---|---|---|
| 13761 Newport Mnr Davie, FL | 3.0 | 2.0 | 1249 | $3,500 | $2.80 | 24d | 1 | 0.30mi |
| 651 Shiloh Ter Unit 651 Davie, FL | 3.0 | 2.0 | 1249 | $4,700 | $3.76 | 24d | 1 | 0.37mi |
| 118 Riverwalk Cir Sunrise, FL | 3.0 | 2.5 | 1447 | $3,100 | $2.14 | 24d | 1 | 0.40mi |
| 200 Commodore Dr Plantation, FL | 2.0 | 2.0 | 1078 | $2,743 | $2.54 | 22d | 1 | 0.47mi |
| 200 Commodore Dr Plantation, FL | 3.0 | 2.0 | 1124 | $2,913 | $2.59 | 20d | 1 | 0.47mi |
| 200 Commodore Dr Plantation, FL | 3.0 | 2.0 | 1124 | $3,014 | $2.68 | 24d | 1 | 0.47mi |
| 13500 NW 3rd St Plantation, FL | 1.0–3.0 | 1.0–2.5 | 1099 | $3,725 | $3.39 | 2d | 21 | 0.50mi |
| 14025 Langley Pl Davie, FL | 3.0 | 2.0 | 1360 | $3,250 | $2.39 | 14d | 1 | 0.55mi |
| 14025 Langley Pl Davie, FL | 3.0 | 2.0 | 1360 | $3,250 | $2.39 | 12d | 1 | 0.55mi |
| 400 Commodore Dr #308 Plantation, FL | 2.0 | 2.5 | 1296 | $2,400 | $1.85 | 5d | 1 | 0.59mi |
| 430 Commodore Dr Unit 430 Plantation, FL | 2.0 | 2.5 | 1296 | $2,400 | $1.85 | 5d | 1 | 0.65mi |
| 430 Commodore Dr #210 Plantation, FL | 2.0 | 2.0 | 1130 | $2,100 | $1.86 | 24d | 1 | 0.65mi |
| 13060 Vista Isles Dr #222 Plantation, FL | 2.0 | 1.0 | 965 | $2,100 | $2.18 | 7d | 1 | 1.10mi |
| 1631 SW 129th Way Davie, FL | 3.0 | 2.0 | 1189 | $3,700 | $3.11 | 5d | 1 | 1.17mi |
| 12950 Vista Isles Dr #421 Plantation, FL | 2.0 | 2.0 | 1105 | $2,300 | $2.08 | 24d | 1 | 1.18mi |
| 595 Vista Isles Dr #1925 Plantation, FL | 2.0 | 1.0 | 965 | $2,195 | $2.27 | 18d | 1 | 1.20mi |
| 785 SW 148th Ave #1406 Davie, FL | 3.0 | 3.0 | 1285 | $2,550 | $1.98 | 24d | 1 | 1.20mi |
| 781 SW 148th Ave Davie, FL | 3.0 | 3.0 | 1285 | $2,675 | $2.08 | 24d | 2 | 1.21mi |
| 781 SW 148th Ave Davie, FL | 1.0–3.0 | 1.0–3.0 | 1176 | $2,750 | $2.34 | 15d | 3 | 1.21mi |
| 12840 Vista Isles Dr Plantation, FL | 2.0 | 1.0 | 965 | $2,100 | $2.18 | 7d | 2 | 1.21mi |
| 701 SW 148th Ave Davie, FL | 3.0 | 3.0 | 1285 | $2,500 | $1.95 | 24d | 1 | 1.22mi |
| 735 SW 148th Ave Davie, FL | 3.0 | 3.0 | 1285 | $2,575 | $2.00 | 24d | 2 | 1.22mi |
| 705 SW 148th Ave #213 Davie, FL | 3.0 | 3.0 | 1409 | $2,300 | $1.63 | 16d | 1 | 1.23mi |
| 663 Vista Isles Dr #1711 Plantation, FL | 2.0 | 2.0 | 1105 | $2,350 | $2.13 | 7d | 1 | 1.23mi |
| 721 SW 148th Ave Davie, FL | 2.0 | 2.0–3.0 | 1138 | $2,700 | $2.37 | 24d | 2 | 1.23mi |
| 771 SW 148th Ave #1305 Davie, FL | 2.0 | 1.0 | 1068 | $2,250 | $2.11 | 2d | 1 | 1.23mi |
| 761 SW 148th Ave #915 Davie, FL | 2.0 | 2.0 | 1034 | $2,380 | $2.30 | 17d | 1 | 1.24mi |
| 761 SW 148th Ave #915 Davie, FL | 2.0 | 2.0 | 1034 | $2,490 | $2.41 | 18d | 1 | 1.24mi |
| 741 SW 148th Ave Davie, FL | 2.0 | 2.0 | 1064 | $2,348 | $2.21 | 11d | 2 | 1.24mi |
| 741 SW 148th Ave #705 Davie, FL | 2.0 | 2.0 | 1064 | $2,395 | $2.25 | 5d | 1 | 1.24mi |
| 741 SW 148th Ave Davie, FL | 2.0 | 2.0 | 1064 | $2,348 | $2.21 | 5d | 2 | 1.24mi |
| 715 SW 148th Ave #611 Davie, FL | 2.0 | 1.0 | 1068 | $2,250 | $2.11 | 7d | 1 | 1.26mi |
| 715 SW 148th Ave #611 Davie, FL | 2.0 | 1.0 | 1068 | $2,250 | $2.11 | 12d | 1 | 1.26mi |
| 711 SW 148th Ave Davie, FL | 3.0 | 3.0 | 1347 | $2,750 | $2.04 | 14d | 3 | 1.26mi |
| 711 SW 148th Ave Davie, FL | 3.0 | 3.0 | 1347 | $2,720 | $2.02 | 7d | 2 | 1.26mi |
| 745 SW 148th Ave #815 Davie, FL | 2.0 | 2.0 | 1034 | $2,425 | $2.35 | 24d | 1 | 1.28mi |
| 701 Vista Isles Dr Plantation, FL | 2.0 | 1.0 | 965 | $2,200 | $2.28 | 24d | 2 | 1.28mi |
| 751 SW 148th Ave Davie, FL | 2.0–3.0 | 2.0–3.0 | 1123 | $2,775 | $2.47 | 24d | 3 | 1.29mi |
| 12430 Vista Isles Dr #1318 Plantation, FL | 2.0 | 2.0 | 1065 | $2,200 | $2.07 | 24d | 1 | 1.29mi |
| 13755 SW 20th St Davie, FL | 2.0 | 2.0 | 864 | $2,500 | $2.89 | 24d | 1 | 1.38mi |
HOA detail
- Monthly dues
- $1,206 · $14,472/yr
Listing history 14 events
-
2026-06-18days on market $69,900 Active 63 DOM
-
2026-06-17days on market $69,900 Active 62 DOM
-
2026-06-16days on market $69,900 Active 61 DOM
-
2026-06-15days on market $69,900 Active 60 DOM
-
2026-06-13days on market $69,900 Active 58 DOM
-
2026-06-09days on market $69,900 Active 54 DOM
-
2026-06-08days on market $69,900 Active 53 DOM
-
2026-06-07days on market $69,900 Active 52 DOM
-
2026-06-04days on market $69,900 Active 49 DOM
-
2026-06-03days on market $69,900 Active 48 DOM
-
2026-06-02days on market $69,900 Active 47 DOM
-
2026-06-01days on market $69,900 Active 46 DOM
-
2026-05-31days on market $69,900 Active 45 DOM
-
2026-04-16$69,900 Active
ⓘ Source: listings_history table (triggers on properties + properties_extension) + one-shot
backfill from property_details.listing_events for pre-trigger history.
Climate risk First Street
- Flood 1/10 Low FEMA zone X (shaded) · 0% chance over 30 yrs
- Wildfire 1/10 Low
- Heat 10/10 Extreme 7 d/yr ≥106°F today · 27 d/yr by 30 yrs out
- Wind 10/10 Extreme 99% chance of damaging wind over 30 yrs
- Air quality 3/10 Moderate 2 unhealthy d/yr today · 3 by 30 yrs out
Nearby sold comps map
Loading sold comps map…
Walkable amenities ~0.75 mi
Loading nearby amenities…
Taxation est. · year 1
- Rental income
- $35,278
- − Mortgage interest
- −$3,915
- − Property taxes
- −$1,048
- − Insurance
- −$350
- − Repairs & maintenance
- −$2,822
- − Management
- −$2,822
- − HOA
- −$14,472
- − Depreciation
- −$2,033
- Taxable income
- $7,815
- Est. tax owed @ 24.0%
- −$1,876
- After-tax cash flow
- $5,725/yr
For passive investors: Depreciation is non-cash, so a rental often shows a tax loss while cash-flowing — sheltering income. Rental losses are passive: they offset passive income freely, and up to $25,000/yr can offset ordinary (W-2) income if you actively participate and your MAGI is under $100k (phasing out to $0 by $150k); unused losses carry forward. On sale, claimed depreciation is recaptured at up to 25%, and gains may owe capital-gains tax (a 1031 exchange can defer both). Figures are a year-1 estimate at your 24.0% rate — not tax advice; consult a CPA.
Condition & rehab AI · 8 photos
This updated mobile home is in good condition with recent renovations, making it a solid investment opportunity.
Value-add opportunities
- Both Painting exterior and interior — Enhances curb appeal and interior aesthetics
- Both Landscaping improvements — Enhances curb appeal and adds value
- Both New flooring in bathrooms — Improves functionality and appearance
Renovation cost estimate screening
Value-add ROI direction
- Both Painting exterior and interior — Enhances curb appeal and interior aesthetics ↑
- Both Landscaping improvements — Enhances curb appeal and adds value ↑
- Both New flooring in bathrooms — Improves functionality and appearance ↑
ⓘ Cost ranges are severity-bucket heuristics (US national rule-of-thumb). Get contractor quotes + a written scope before underwriting a rehab budget.
Schools (NCES district)
- District
- Broward
- NCES district ID
- 1200180
- Math proficiency
- 42% ▼ -18.00%
- Reading proficiency
- 53% ▼ -5.00%
- Median HH income
- $52,139
- Composite
- 40.88/100
- National rank
- #3621
- State rank
- #46 of 73 in FL
Livability — Davie
- Score
- 82/100
- State rank
- #68
- US rank
- #1159
Category grades
Schools grade is shown separately in the Schools card above.
Census & demographics
- Census place
- Davie, FL
- County
- Broward County · 1,963,430 people
- City population
- 92,317
- Metro
- Miami-Fort Lauderdale-Pompano Beach, FL
- Population (ZIP)
- 32,399
- Household income
- $100,553
- Rent vs Own
- Severe rent burden
- 924.0
Population outlook (Broward County) Hauer SSP2
- Today (2025)
- 2,207,033 people
- By 2030
- 2,360,704 · +7.0%
- By 2040
- 2,661,208 · +20.6%
- By 2050
- 2,946,698 · +33.5%
- By 2075
- 3,602,273 · +63.2%
- By 2100
- 3,970,984 · +79.9%
Race, ethnicity, and origin ACS 2023
- Neighborhood character
- Diverse neighborhood (Simpson 0.62)
- Race & ethnicity
- Hispanic / Latino 51% White 33% Two or more races 31% Black 6% Asian 3%
- Hispanic origin (detail)
- Mexican 3% Puerto Rican 8% Cuban 9% Dominican 1% Salvadoran 1%
- Common ancestry
- Italian 3% Romanian 1% Scotch-Irish 1%
- Foreign-born
- 35% · Canada, Jamaica, Dominican Republic
- Languages at home
- 49% English-only · Spanish 46% Other Indo-European 2% French/Haitian/Cajun 2%
Political lean MEDSL · Broward
- 2024 margin
- D (+17.0) · D 58.0% · R 41.0%
- 2008→2024 swing
- -17.8pp toward R · 2008: 34.7pp · 2024: 17.0pp
- All cycles
- 2024: D+17.0 2020: D+29.8 2016: D+35.0 2012: D+34.9 2008: D+34.7
Not yet ingested
- Civics
- —
Market trends
- HPI YoY
- ▼ -437.64%
- Current HPI
- 385.1467
- Rent YoY
- ▼ -0.88%
- Metro
- Miami-Fort Lauderdale-Pompano Beach, FL
- State GDP YoY
- ▲ 3.28%
- F500 in state
- 36
Industry mix (Fortune 500 HQ in FL)
| Industry | F500 HQs | Revenue |
|---|---|---|
| Industrial Technology | 2 | $29B |
|
||
| Insurance | 2 | $17B |
|
||
| Retail | 1 | $60B |
|
||
| Technology Distribution | 1 | $58B |
|
||
| Homebuilding | 1 | $35B |
|
||
| Technology Manufacturing | 1 | $35B |
|
||
Price history
1 event — show timeline
- 2026-04-16 Listed $69,900 MCRTC
Cash-flow waterfall
monthlySold comps — $/sqft
last 12 mo · ≤1 miLoading sold comps…