13709 Sabine Lake Dr · Texas City, TX
Flood risk No data
- FEMA flood zone
- —
- Chance of flooding over 30 yrs
- —
- Est. flood insurance / yr
- —
Fire risk No data
- Est. fire insurance / yr
- —
Heat risk No data
- Hot days now (above threshold)
- —
- Hot days in 30 yrs
- —
Wind risk No data
- Chance of severe wind over 30 yrs
- —
Air-quality risk No data
- Unhealthy air days now
- —
- Unhealthy air days in 30 yrs
- —
Risk factors via First Street. Map © Google.
Why this score? — see what drove the D grade
The composite is a weighted blend of 9 inputs, each scored 0–100. Each bar is that input's sub-score; the figure is the points it added to the 100-point composite (weight × sub-score).
- Cash flow +13.7/30.0
- ARV discount +10.1/15.0
- DSCR +4.1/10.0
- 1% rule +3.6/10.0
- Rent growth +3.5/5.0
- Schools +3.5/10.0
- Livability +3.1/5.0
- Condition / age +2.5/5.0
- Appreciation +0.0/10.0
$283,900
🖨 Deal sheet (PDF) 📄 Offer letter ✓ Due diligence
Listing remarks MLS
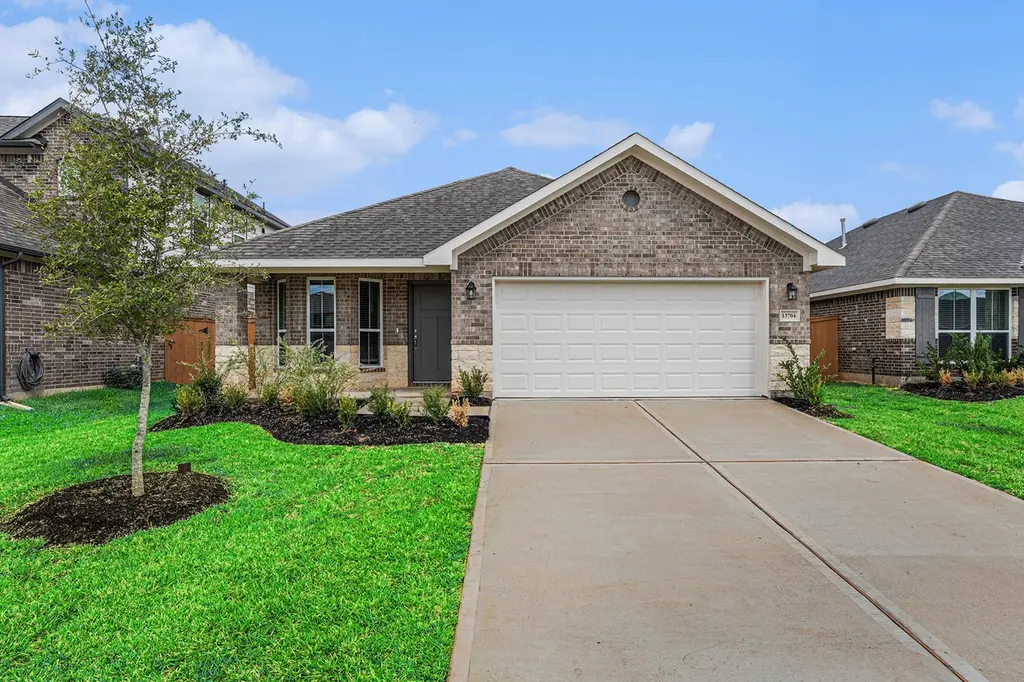
Make your plans to come out to Lago Mar to see this gorgeous home from Adams Homes. This home is 1717sqft. with 3bd/ 2ba & is estimated to be completed in Nov. This home is bricked on all 4 sides with a covered patio. Inside you get laminate flooring throughout the living area, stainless steel appliances, shaker style cabinets, granite countertops & so much more. Don't let this one get away, make your appointment to tour this one ASAP!
Key facts
- Laminate flooring
- Covered patio
- Granite countertops
Tags
Neighborhood map
What this means for you Summary
Snapshot
- This is a 3-bed/2.0-bath land listed at $284k.
Deal economics
- At list price, monthly cash flow is $19 ($225/yr) — positive.
- The deal already cash-flows at list — no discount required.
- To meet the 1% rule (rent ≥ 1% of price), the offer needs to be $245k (13.7% below list).
- Recommended offer: $245k (13.7% below list) — sets the bar for 1% rule.
- Cap rate 6.4% vs local median 4.3% in Texas City — top-decile yield for the area; either an underpriced asset or a hidden risk that comps aren't pricing in. Stress-test before assuming the spread holds.
Location & tenants
- Location reads 62/100 on livability (#907 in TX) — a middle-class / working-renter tenant base. Strengths: cost of living A+, housing A+; Watch: crime D+, amenities F, commute F.
- Dickinson ISD (suburban): math 39% / reading 40% proficiency, ranked #366 of 826 in TX (top 44%) — families likely to look elsewhere, expect single-tenant / working-renter base with shorter leases; 60% free/reduced lunch — lower-income household profile, screen leases tightly.
- Zoned schools: Hughes Road El (math 36% / reading 31%, grade F, #2,174 of 4,322 statewide, top 51%, 707 students, 67% FRL); Dunbar Middle (math 25% / reading 20%, grade F, #1,341 of 1,662 statewide, top 82%, 654 students, 78% FRL); Dickinson H S (math 30% / reading 46%, grade F, #880 of 1,632 statewide, top 54%, 3,619 students, 64% FRL).
- Market conditions: Rents rising (+4.0%/yr); 661 active listings in the ZIP; 3 comparable units currently listed for rent nearby; rentals leasing fast (median 14d on market — plan ~1-2 weeks tenant-placement turnaround); 3,258 units permitted in Galveston County in 2024 (0 in 5+ unit buildings).
- This rent runs 39% of the median local income ($75k/yr) — at the standard rent-burdened threshold; future hikes will face affordability resistance.
Forward outlook
- Local home prices are declining (-3.0%/yr); year-one equity from $2k of loan paydown is wiped out by about $9k of value loss. Plan a longer hold.
- Galveston County population projected at +43% by 2050 — long-run rental-demand tailwind backs the buy-and-hold thesis.
Negotiation context
- It's been on market 225 days — a 12% lower offer ($250k) is reasonable based on typical stale-listing flexibility.
Questions for the listing agent
- It's been on market 225 days. Have you received any prior offers? Is the seller open to a 14% concession, seller financing, or rate buy-down credit?
- What does the HOA fee cover, when was the last increase, and are there any pending special assessments or reserve-fund shortfalls?
- Why hasn't it sold? Are there any deal-killer items the seller is aware of (foundation, flood, title, zoning, code violations)?
- Is there a deadline driving the sale (1031 exchange, divorce, estate, relocation)? That informs how much negotiation room exists.
- Schools are F-rated, which usually means shorter tenancies and higher turnover. Who's the typical renter profile here, and what's been the actual vacancy rate?
- Crime grade is D in this area — have there been break-ins, vandalism, or insurance claims at this property in the last 3 years? What carrier currently insures it and at what premium?
- The area grade is low — what's the realistic commute time and amenity access for the typical tenant pool here? Any planned neighborhood developments (good or bad) we should know about?
- What's the average days-on-market for RENTAL listings here right now (not sales)? A rising rental-DOM trend means longer vacancies and softer asking-rent achievability than the comps imply.
- What's the recent tenant-quality profile in this submarket — average credit score on applications, eviction rate, late-payment / NSF rate, and stable-employment percentage? A property-management company in the area should have these aggregated.
- How much new for-sale + rental construction is in the pipeline within 1–3 miles? Heavy new supply typically softens prices + rents 12–24 months out; constrained supply supports both.
Investment metrics
- 1% rule
- 0.86% ✗
- Cap rate
- 6.37%
- Cash-on-cash
- 0.28%
- DSCR
- 1.01
- GRM
- 9.7
CMA / ARV
- ARV (median comp)
- $301,009
- List price
- $283,900
- Delta
- -5.68%
- Verdict
- FAIR
- Comps
- 20 within 1.0 mi
Projected returns pro-forma
-3.0% appreciation · 3.95% rent growth · sell at horizon
- IRR
- -14.8%
- Equity multiple
- 0.47×
- Total profit
- $-42,434
- Equity at exit
- $42,330
- IRR
- -4.7%
- Equity multiple
- 0.68×
- Total profit
- $-25,477
- Equity at exit
- $24,546
Cash invested: $79,492 (down + closing). Projections, not guarantees.
Landlord ↔ Tenant lean methodology
- Overall (STATE)
- 87 Strongly Landlord-Friendly
- State Texas
- 87 Strongly Landlord-Friendly · R+5
- County
- — inherits STATE
- City
- — inherits STATE
ZIP-level market 77568
- Home prices YoY
- -22.7%
- Rents YoY
- 4.0%
- Active inventory
- 661
- Price-to-rent
- 9.7×
Monthly cashflow live
- Estimated rent
- $2,451 medium interval (Pro) →
- Mortgage (P&I)
- −$1,489
- Tax from tax record
- −$186 /mo · $2,229/yr
- Insurance
- −$118
- HOA
- −$125
- Vacancy / Maint / Mgmt
- −$515
- Net cashflow
- $19
Break-even live
Sensitivity live
| Price | -10% $179 | -5% $99 | +0% $19 | +5% $-62 | +10% $-142 |
|---|---|---|---|---|---|
| Rent | -10% $-175 | -5% $-78 | +0% $19 | +5% $116 | +10% $212 |
| Rate | -1.0pp $162 | -0.5pp $91 | base $19 | +0.5pp $-55 | +1.0pp $-130 |
UW: 25.0% down · 7.5% · 30yr · 1.5% tax · 5.0% vac · 8.0% maint · 8.0% mgmt
Financing live
Cash to close
- Down payment
- $70,975
- Closing costs
- $8,517
- Reserves months
- —
- Total cash needed
- —
Loan-product check · same deal, 3 products live
Conventional
25% down · 7.5% · 30yr
- Down + closing
- —
- Monthly P&I
- —
- Monthly cashflow
- —
- DSCR
- —
- Eligible?
- —
Personal DTI + credit; lowest rate.
DSCR
20% down · 8.5% · 30yr
- Down + closing
- —
- Monthly P&I
- —
- Monthly cashflow
- —
- DSCR
- —
- Eligible?
- —
No personal income docs; deal must DSCR.
Hard money
10% down · 12.0% · 12mo
- Down + closing
- —
- Monthly P&I
- —
- Monthly cashflow
- —
- DSCR
- —
- Eligible?
- —
Short-term bridge; refi at stabilization.
Rent comps 3 comps
| Address | Beds | Baths | Sqft | Rent | $/sqft | DOM | Units | Dist |
|---|---|---|---|---|---|---|---|---|
| 13817 Starboard Reach Dr Santa Fe, TX | 3.0–4.0 | 2.0–3.5 | 2268 | $2,445 | $1.08 | 0d | 1 | 0.71mi |
| 640 Totem Trail Dr La Marque, TX | 4.0 | 2.5 | 2134 | $2,309 | $1.08 | 13d | 1 | 1.02mi |
| 12524 Jetty Cv Santa Fe, TX | 3.0 | 2.0 | 1803 | $2,506 | $1.39 | 23d | 1 | 1.25mi |
HOA detail
- Monthly dues
- $125 · $1,500/yr
Listing history 12 events
-
2026-06-13statusdays on market $283,900 Pending 225 DOM
-
2026-06-09days on market $283,900 Active 224 DOM
-
2026-06-08days on market $283,900 Active 223 DOM
-
2026-06-07days on market $283,900 Active 222 DOM
-
2026-06-04days on market $283,900 Active 219 DOM
-
2026-06-03days on market $283,900 Active 218 DOM
-
2026-06-02days on market $283,900 Active 217 DOM
-
2026-06-02days on market $283,900 Active 216 DOM
-
2026-05-31days on market $283,900 Active 215 DOM
-
2026-05-11price $283,900 447-char remark
Show marketing remark (447 chars)
Make your plans to come out to Lago Mar to see this gorgeous home from Adams Homes. This home is 1717sqft. with 3bd/ 2ba & is estimated to be completed in Nov. This home is bricked on all 4 sides with a covered patio. Inside you get laminate flooring throughout the living area, stainless steel appliances, shaker style cabinets, granite countertops & so much more. Don't let this one get away, make your appointment to tour this one ASAP!
-
2026-03-05price $278,900 447-char remark
Show marketing remark (447 chars)
Make your plans to come out to Lago Mar to see this gorgeous home from Adams Homes. This home is 1717sqft. with 3bd/ 2ba & is estimated to be completed in Nov. This home is bricked on all 4 sides with a covered patio. Inside you get laminate flooring throughout the living area, stainless steel appliances, shaker style cabinets, granite countertops & so much more. Don't let this one get away, make your appointment to tour this one ASAP!
-
2025-10-28$303,900 Active 447-char remark
Show marketing remark (447 chars)
Make your plans to come out to Lago Mar to see this gorgeous home from Adams Homes. This home is 1717sqft. with 3bd/ 2ba & is estimated to be completed in Nov. This home is bricked on all 4 sides with a covered patio. Inside you get laminate flooring throughout the living area, stainless steel appliances, shaker style cabinets, granite countertops & so much more. Don't let this one get away, make your appointment to tour this one ASAP!
ⓘ Source: listings_history table (triggers on properties + properties_extension) + one-shot
backfill from property_details.listing_events for pre-trigger history.
Tax reassessment forecast TX · Resets to sale price
- Current annual tax
- $2,229 · $186/mo
- Projected year-2 tax
- $5,195 · $433/mo
- Expected delta
- +$2,967/yr (+$247/mo · 133.1%)
ⓘ Screening estimate from a state-policy table — verify with the county assessor before closing.
Nearby sold comps map
Loading sold comps map…
Walkable amenities ~0.75 mi
Loading nearby amenities…
Taxation est. · year 1
- Rental income
- $29,416
- − Mortgage interest
- −$15,903
- − Property taxes
- −$2,229
- − Insurance
- −$1,420
- − Repairs & maintenance
- −$2,353
- − Management
- −$2,353
- − HOA
- −$1,500
- − Depreciation
- −$8,259
- Taxable loss
- −$4,600
- Est. tax savings @ 24.0%
- +$1,104
- After-tax cash flow
- $1,329/yr
For passive investors: Depreciation is non-cash, so a rental often shows a tax loss while cash-flowing — sheltering income. Rental losses are passive: they offset passive income freely, and up to $25,000/yr can offset ordinary (W-2) income if you actively participate and your MAGI is under $100k (phasing out to $0 by $150k); unused losses carry forward. On sale, claimed depreciation is recaptured at up to 25%, and gains may owe capital-gains tax (a 1031 exchange can defer both). Figures are a year-1 estimate at your 24.0% rate — not tax advice; consult a CPA.
Schools (NCES district)
- District
- Dickinson ISD
- NCES district ID
- 4817070
- Math proficiency
- 39% ▼ -11.00%
- Reading proficiency
- 40% ▼ -2.00%
- Median HH income
- $61,318
- Composite
- 35.16/100
- National rank
- #5005
- State rank
- #366 of 826 in TX
Livability — Texas City
- Score
- 62/100
- State rank
- #907
- US rank
- #16268
Category grades
Schools grade is shown separately in the Schools card above.
Census & demographics
- Census place
- Texas City, TX
- County
- Galveston County · 357,330 people
- City population
- 49,936
- Metro
- Houston-The Woodlands-Sugar Land, TX
- Population (ZIP)
- 23,083
- Household income
- $74,694
- Rent vs Own
- Severe rent burden
- 700.0
Population outlook (Galveston County) Hauer SSP2
- Today (2025)
- 390,640 people
- By 2030
- 425,226 · +8.9%
- By 2040
- 493,765 · +26.4%
- By 2050
- 559,698 · +43.3%
- By 2075
- 719,260 · +84.1%
- By 2100
- 819,628 · +109.8%
Race, ethnicity, and origin ACS 2023
- Neighborhood character
- Highly diverse neighborhood (Simpson 0.71)
- Race & ethnicity
- White 37% Hispanic / Latino 29% Black 26% Two or more races 17% Asian 3%
- Hispanic origin (detail)
- Mexican 22% Puerto Rican 1%
- Common ancestry
- Lithuanian 1% Italian 1% Serbian 1%
- Foreign-born
- 8% · Canada
- Languages at home
- 77% English-only · Spanish 21% Tagalog/Filipino 1% Other Asian/Pacific 1%
Political lean MEDSL · Galveston
- 2024 margin
- Strong R (+27.4) · D 35.7% · R 63.1% · Other 1.2%
- 2008→2024 swing
- -7.9pp toward R · 2008: -19.5pp · 2024: -27.4pp
- All cycles
- 2024: R+27.4 2020: R+22.6 2016: R+22.6 2012: R+26.9 2008: R+19.5
Not yet ingested
- Civics
- —
Market trends
- HPI YoY
- ▼ -69.39%
- Current HPI
- 236.0239
- Rent YoY
- ▲ 3.95%
- Metro
- Houston-The Woodlands-Sugar Land, TX
- State GDP YoY
- ▲ 3.95%
- F500 in state
- 110
Industry mix (Fortune 500 HQ in TX)
| Industry | F500 HQs | Revenue |
|---|---|---|
| Energy | 16 | $1,198B |
|
||
| Technology | 5 | $198B |
|
||
| Engineering / Construction | 4 | $72B |
|
||
| Energy Services | 3 | $60B |
|
||
| Utilities | 3 | $41B |
|
||
| Healthcare | 2 | $330B |
|
||
Price history
-6.6% since first listed3 events — show timeline
- 2026-05-11 Price Changed $283,900 HARMLS
- 2026-03-05 Price Changed $278,900 HARMLS
- 2025-10-28 Listed $303,900 HARMLS
Property tax history
+8.4%/yrLatest (2025): $2,229 · +19.4% YoY. Source: county tax records.
Cash-flow waterfall
monthlySold comps — $/sqft
last 12 mo · ≤1 miLoading sold comps…