 🏷️ Likely Rental
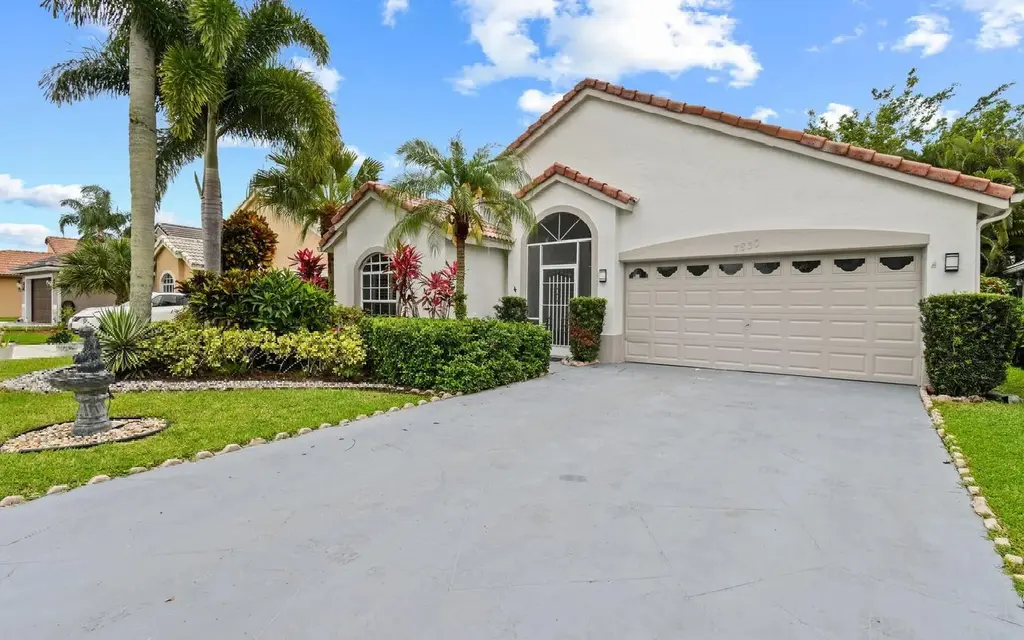
7830 S Stirling Bridge Blvd · Delray Beach, FL
Flood risk 1/10 · Minimal
- FEMA flood zone
- X (unshaded)
- Chance of flooding over 30 yrs
- 0.0%
- Est. flood insurance / yr
- $507 – $1,088
Fire risk 4/10 · Minor
- Est. fire insurance / yr
- $947 – $1,759
Heat risk 9/10 · Severe
- Hot days now (above 107°F)
- 7 days/yr
- Hot days in 30 yrs
- 26 days/yr
Wind risk 10/10 · Severe
- Chance of severe wind over 30 yrs
- 99.0%
Air-quality risk 2/10 · Minimal
- Unhealthy air days now
- 0 days/yr
- Unhealthy air days in 30 yrs
- 2 days/yr
Risk factors via First Street. Map © Google.
Why this score? — see what drove the C- grade
The composite is a weighted blend of 9 inputs, each scored 0–100. Each bar is that input's sub-score; the figure is the points it added to the 100-point composite (weight × sub-score).
- Cash flow +15.0/30.0
- ARV discount +7.5/15.0
- Appreciation +5.3/10.0
- 1% rule +5.0/10.0
- DSCR +5.0/10.0
- Schools +4.3/10.0
- Livability +3.9/5.0
- Rent growth +2.6/5.0
- Condition / age +2.5/5.0
$5,000
🖨 Deal sheet 📄 Offer letter ✓ Due diligence
Listing remarks MLS
Beautifully FULLY RENOVATED single family home in the desirable gated community of Newport Cove! Vaulted ceilings, modern look, bright and spacious! DREAM KITCHEN will impress you with quartz countertops, chef's island with waterfalls and new SS upgraded appliances. Stunning new bathrooms with designer tile and frameless showers, LED mirrors, porcelain rectified tile throughout the whole house, new fixtures! Freshly painted inside and out this home is ready to impress! Enjoy your mornings on an oversized screened in patio with a private garden view or throw an amazing party with plenty of space for parking and entertaining your quests. Beautiful club house with pool, tennis, workout studio. Located close to beaches, dining, shopping and medical facilities.
Key facts
- 2 garage spots
- Built 1994
- Listed 5 days
Property features AI
Exterior
- Parking: 2-car garage
- Home design: Residential property
- Construction: Single-story
- Exterior features: Lot zoned RS
Interior
- Bathrooms: 2 full bathrooms
- Interior features: One-story layout
Neighborhood map
What this means for you Summary
Snapshot
- This is a 3-bed/2.0-bath single-family listed at $5k.
Deal economics
- At list price, monthly cash flow is $3k ($31k/yr) — positive.
- The deal already cash-flows at list — no discount required.
- Meets the 1% rule at list price ($3k rent vs $5k).
- Cap rate 626.0% vs local median 4.3% in Delray Beach — top-decile yield for the area; either an underpriced asset or a hidden risk that comps aren't pricing in. Stress-test before assuming the spread holds.
Location & tenants
- Location reads 77/100 on livability (#202 in FL, #3,160 nationally) — a middle-class / working-renter tenant base. Strengths: housing A+, health & safety A+, commute A-; Watch: cost of living C-, crime D-, amenities F.
- Palm Beach (suburban): math 46% / reading 53% proficiency, ranked #34 of 73 in FL (top 47%) — families likely to look elsewhere, expect single-tenant / working-renter base with shorter leases.
- Market conditions: Rents flat; 577 active listings in the ZIP; 40 comparable units currently listed for rent nearby; rentals at typical pace (median 18d on market — plan ~3-4 weeks tenant-placement turnaround); solid renter incomes; 3,974 units permitted in Palm Beach County in 2024 (1,012 in 5+ unit buildings).
- At $3,312/mo this rent would consume 50% of the median local household income ($80k/yr) (locally 494% of renters already pay >50% of income on rent) — very limited rent-growth headroom before tenants either downsize or default.
Forward outlook
- In year one you build about $69 of equity ($35 loan paydown + $34 appreciation (0.7% local appreciation)).
- Palm Beach County population projected at +30% by 2050 — long-run rental-demand tailwind backs the buy-and-hold thesis.
- At projected returns (0.7% appreciation + 0.5% rent growth), your $1k cash investment doubles in ~1 year — after that, you're playing with house money.
Negotiation context
- Only 5 days on market — expect competitive offers; lowballing is unlikely to land.
- 7 sale attempts since 4y ago with the ask held roughly flat each time — persistent listings suggest the price (not the market) is what's stuck; bring a comps-based counter.
Risks & watch-outs
- Climate carrying-cost: severe wind risk, 99% chance of damaging wind over 30y; extreme-heat days projected 7→26/yr by 2055 (HVAC capex compounding) — expect insurance premiums to compound above CPI over the hold.
Questions for the listing agent
- Is there a deadline driving the sale (1031 exchange, divorce, estate, relocation)? That informs how much negotiation room exists.
- Schools are B-rated — typically a magnet for longer-tenancy family renters. What's the average tenant stay here, and is there a school-zone premium baked into asking?
- Crime grade is D in this area — have there been break-ins, vandalism, or insurance claims at this property in the last 3 years? What carrier currently insures it and at what premium?
- What's the average days-on-market for RENTAL listings here right now (not sales)? A rising rental-DOM trend means longer vacancies and softer asking-rent achievability than the comps imply.
- What's the recent tenant-quality profile in this submarket — average credit score on applications, eviction rate, late-payment / NSF rate, and stable-employment percentage? A property-management company in the area should have these aggregated.
- How much new for-sale + rental construction is in the pipeline within 1–3 miles? Heavy new supply typically softens prices + rents 12–24 months out; constrained supply supports both.
Investment metrics
- 1% rule
- 66.25% ✓
- Cap rate
- 626.01%
- Cash-on-cash
- 2213.29%
- DSCR
- 99.48
- GRM
- 0.1
CMA / ARV
- ARV (on-the-fly)
- $677,328
- Comps found
- 1
Show comp detail 1 sale within ~0.75 mi
| Address | Dist | Beds/Ba | Sqft | Sold | Price | $/sf | Match |
|---|---|---|---|---|---|---|---|
| 14956 Rapolla Dr | 0.38mi | 2/2.5 (-1) | 1,794 (+9%) | 10mo | $740,000 | $412 | 52 |
Match score weights: distance 35% · size 25% · config 20% · recency 20%. Top-matched comps best support the ARV.
Projected returns pro-forma
0.69% appreciation · 0.51% rent growth · sell at horizon
- IRR
- —
- Equity multiple
- 112.74×
- Total profit
- $156,430
- Equity at exit
- $1,626
- IRR
- —
- Equity multiple
- 227.73×
- Total profit
- $317,424
- Equity at exit
- $2,099
Cash invested: $1,400 (down + closing). Projections, not guarantees.
Landlord ↔ Tenant lean methodology
- Overall (STATE)
- 87 Strongly Landlord-Friendly
- State Florida
- 87 Strongly Landlord-Friendly · R+3
- County
- — inherits STATE
- City
- — inherits STATE
ZIP-level market 33446
- Home prices YoY
- 0.3%
- Rents YoY
- 0.5%
- Active inventory
- 577
- Price-to-rent
- 0.1×
Monthly cashflow live
- Estimated rent
- $3,312 high interval (Pro) →
- Mortgage (P&I)
- −$26
- Tax est. 1.5%
- −$6 /mo · $75/yr
- Insurance
- −$2
- HOA
- −$0
- Vacancy / Maint / Mgmt
- −$696
- Net cashflow
- $2,582
Break-even live
UW: 25.0% down · 7.5% · 30yr · 1.5% tax · 5.0% vac · 8.0% maint · 8.0% mgmt
Financing live
Cash to close
- Down payment
- $1,250
- Closing costs
- $150
- Reserves months
- —
- Total cash needed
- —
Loan-product check · same deal, 3 products live
Conventional
25% down · 7.5% · 30yr
- Down + closing
- —
- Monthly P&I
- —
- Monthly cashflow
- —
- DSCR
- —
- Eligible?
- —
Personal DTI + credit; lowest rate.
DSCR
20% down · 8.5% · 30yr
- Down + closing
- —
- Monthly P&I
- —
- Monthly cashflow
- —
- DSCR
- —
- Eligible?
- —
No personal income docs; deal must DSCR.
Hard money
10% down · 12.0% · 12mo
- Down + closing
- —
- Monthly P&I
- —
- Monthly cashflow
- —
- DSCR
- —
- Eligible?
- —
Short-term bridge; refi at stabilization.
Rent comps 40 comps
| Address | Beds | Baths | Sqft | Rent | $/sqft | DOM | Units | Dist |
|---|---|---|---|---|---|---|---|---|
| 14856 Barletta Way Delray Beach, FL | 2.0 | 2.0 | 1406 | $3,200 | $2.28 | 24d | 1 | 0.33mi |
| 14131 Rock Salt Rd Delray Beach, FL | 3.0 | 2.0 | 1490 | $4,800 | $3.22 | 1d | 1 | 0.36mi |
| 8085 Tumblestone Ct Delray Beach, FL | 2.0 | 2.0 | 1097 | $2,679 | $2.44 | 24d | 1 | 0.41mi |
| 8085 Tumblestone Ct Delray Beach, FL | 3.0 | 2.0 | 1242 | $2,998 | $2.41 | 1d | 1 | 0.41mi |
| 8085 Tumblestone Ct Delray Beach, FL | 2.0 | 2.0 | 1076 | $2,668 | $2.48 | 2d | 1 | 0.41mi |
| 7301 Amberly Ln #304 Delray Beach, FL | 2.0 | 2.0 | 1080 | $1,495 | $1.38 | 7d | 1 | 0.43mi |
| 13851 Oneida Dr Unit D2 Delray Beach, FL | 3.0 | 2.0 | 1557 | $2,850 | $1.83 | 3d | 1 | 0.44mi |
| 7350 Kinghurst Dr Delray Beach, FL | 2.0 | 2.0 | 1220 | $4,500 | $3.69 | 15d | 1 | 0.47mi |
| 7350 Kinghurst Dr #305 Delray Beach, FL | 2.0 | 2.0 | 1220 | $4,500 | $3.69 | 21d | 1 | 0.47mi |
| 7904 Mansfield Hollow Rd Delray Beach, FL | 3.0 | 2.0 | 1865 | $3,950 | $2.12 | 24d | 1 | 0.49mi |
| 13811 Oneida Dr Unit H2 Delray Beach, FL | 2.0 | 2.0 | 1078 | $2,100 | $1.95 | 24d | 1 | 0.53mi |
| 8061 Red Jasper Ln Delray Beach, FL | 2.0 | 2.0 | 1097 | $2,877 | $2.62 | 24d | 1 | 0.57mi |
| 8061 Red Jasper Ln Delray Beach, FL | 2.0 | 2.0 | 1097 | $2,892 | $2.64 | 11d | 1 | 0.57mi |
| 8061 Red Jasper Ln Delray Beach, FL | 2.0 | 2.0 | 1153 | $3,002 | $2.60 | 2d | 1 | 0.57mi |
| 7310 Ashford Pl Delray Beach, FL | 2.0 | 2.0 | 1230 | $2,700 | $2.20 | 18d | 2 | 0.57mi |
| 7310 Ashford Pl Delray Beach, FL | 2.0 | 2.0 | 1230 | $3,200 | $2.60 | 15d | 1 | 0.57mi |
| 7310 Ashford Pl Delray Beach, FL | 2.0 | 2.0 | 1230 | $3,200 | $2.60 | 7d | 1 | 0.57mi |
| 7260 Kinghurst Dr #205 Delray Beach, FL | 2.0 | 2.0 | 1230 | $2,800 | $2.28 | 18d | 1 | 0.62mi |
| 7607 Atlantic Ave Delray Beach, FL | 1.0–2.0 | 1.0–2.0 | 1086 | $3,494 | $3.22 | 2d | 6 | 0.66mi |
| 15018 Three Ponds Trl Delray Beach, FL | 3.0 | 2.0 | 1703 | $4,150 | $2.44 | 24d | 1 | 0.67mi |
| 15018 Three Ponds Trl Delray Beach, FL | 3.0 | 2.0 | 1703 | $4,150 | $2.44 | 11d | 1 | 0.67mi |
| 7286 Huntington Ln #105 Delray Beach, FL | 2.0 | 2.0 | 1070 | $3,350 | $3.13 | 24d | 1 | 0.68mi |
| 13542 Weyburne Dr Delray Beach, FL | 3.0 | 2.0 | 1727 | $3,145 | $1.82 | 21d | 1 | 0.77mi |
| 14509 Sloan Ridge Dr Unit 10-104 Luminosa Delray Beach, FL | 3.0 | 2.0 | 1328 | $3,827 | $2.88 | 24d | 1 | 0.78mi |
| 14828 Golden Jax Ln Unit 8-105 Radiance Delray Beach, FL | 2.0 | 2.0 | 1321 | $3,948 | $2.99 | 14d | 1 | 0.78mi |
| 14828 Golden Jax Ln Unit 6-105 Radiance Delray Beach, FL | 2.0 | 2.0 | 1321 | $4,148 | $3.14 | 16d | 1 | 0.78mi |
| 14828 Golden Jax Ln Unit 8103 Delray Beach, FL | 2.0 | 2.0 | 1321 | $3,949 | $2.99 | 4d | 1 | 0.78mi |
| 7192 Huntington Ln #307 Delray Beach, FL | 2.0 | 2.0 | 1070 | $3,500 | $3.27 | 18d | 1 | 0.78mi |
| 14895 Builtmore Way Delray Beach, FL | 2.0 | 2.0 | 1103 | $1,800 | $1.63 | 24d | 1 | 0.81mi |
| 14898 Wedgefield Dr #202 Delray Beach, FL | 2.0 | 2.0 | 1103 | $2,000 | $1.81 | 17d | 1 | 0.81mi |
| 7512 Eagle Point Dr Unit 7512 Delray Beach, FL | 3.0 | 2.0 | 1463 | $4,000 | $2.73 | 18d | 1 | 0.83mi |
| 7512 Eagle Point Dr Delray Beach, FL | 3.0 | 2.0 | 1463 | $4,000 | $2.73 | 3d | 1 | 0.83mi |
| 7657 Lexington Club Blvd Delray Beach, FL | 3.0 | 2.0 | 1645 | $4,500 | $2.74 | 24d | 1 | 0.86mi |
| 14800 Cumberland Dr Delray Beach, FL | 2.0 | 2.0 | 1321 | $4,048 | $3.06 | 5d | 4 | 0.86mi |
| 14534 Highland Center Way Delray Beach, FL | 2.0 | 2.0 | 1319 | $3,400 | $2.58 | 7d | 1 | 0.88mi |
| 7076 Huntington Ln #608 Delray Beach, FL | 2.0 | 2.0 | 1230 | $2,600 | $2.11 | 24d | 1 | 0.89mi |
| 14556 Wiley Range Rd Delray Beach, FL | 2.0 | 2.0 | 1319 | $3,000 | $2.27 | 24d | 1 | 0.93mi |
| 14624 Three Ponds Trl Delray Beach, FL | 3.0 | 2.0 | 1411 | $3,250 | $2.30 | 17d | 1 | 0.96mi |
| 15035 Michelangelo Blvd #103 Delray Beach, FL | 2.0 | 2.0 | 1079 | $2,000 | $1.85 | 24d | 1 | 0.98mi |
| 15055 Michelangelo Blvd Delray Beach, FL | 2.0–3.0 | 2.0 | 1158 | $2,500 | $2.16 | 21d | 2 | 0.99mi |
Listing history 5 events
-
2026-06-09days on market $5,000 Active 5 DOM
-
2026-06-08days on market $5,000 Active 4 DOM
-
2026-06-07days on market $5,000 Active 3 DOM
-
2026-06-04remarks 312-char remark
-
2026-06-04$5,000 Active 1 DOM
ⓘ Source: listings_history table (triggers on properties + properties_extension) + one-shot
backfill from property_details.listing_events for pre-trigger history.
Climate risk First Street
- Flood 1/10 Low FEMA zone X (unshaded) · 0% chance over 30 yrs
- Wildfire 4/10 Moderate
- Heat 9/10 Extreme 7 d/yr ≥107°F today · 26 d/yr by 30 yrs out
- Wind 10/10 Extreme 99% chance of damaging wind over 30 yrs
- Air quality 2/10 Low 0 unhealthy d/yr today · 2 by 30 yrs out
Nearby sold comps map
Loading sold comps map…
Walkable amenities ~0.75 mi
Loading nearby amenities…
Taxation est. · year 1
- Rental income
- $39,748
- − Mortgage interest
- −$280
- − Property taxes
- −$75
- − Insurance
- −$25
- − Repairs & maintenance
- −$3,180
- − Management
- −$3,180
- − Depreciation
- −$145
- Taxable income
- $32,863
- Est. tax owed @ 24.0%
- −$7,887
- After-tax cash flow
- $23,099/yr
For passive investors: Depreciation is non-cash, so a rental often shows a tax loss while cash-flowing — sheltering income. Rental losses are passive: they offset passive income freely, and up to $25,000/yr can offset ordinary (W-2) income if you actively participate and your MAGI is under $100k (phasing out to $0 by $150k); unused losses carry forward. On sale, claimed depreciation is recaptured at up to 25%, and gains may owe capital-gains tax (a 1031 exchange can defer both). Figures are a year-1 estimate at your 24.0% rate — not tax advice; consult a CPA.
Schools (NCES district)
- District
- Palm Beach
- NCES district ID
- 1201500
- Math proficiency
- 46% ▼ -16.00%
- Reading proficiency
- 53% ▼ -4.00%
- Median HH income
- $53,943
- Composite
- 42.72/100
- National rank
- #3160
- State rank
- #34 of 73 in FL
Livability — Delray Beach
- Score
- 77/100
- State rank
- #202
- US rank
- #3160
Category grades
Schools grade is shown separately in the Schools card above.
Census & demographics
- County
- Palm Beach County · 1,438,312 people
- City population
- 123,167
- Metro
- Miami-Fort Lauderdale-Pompano Beach, FL
- Population (ZIP)
- 28,431
- Household income
- $80,187
- Rent vs Own
- Severe rent burden
- 494.0
Population outlook (Palm Beach County) Hauer SSP2
- Today (2025)
- 1,637,487 people
- By 2030
- 1,743,255 · +6.5%
- By 2040
- 1,948,712 · +19.0%
- By 2050
- 2,132,979 · +30.3%
- By 2075
- 2,530,027 · +54.5%
- By 2100
- 2,706,979 · +65.3%
Race, ethnicity, and origin ACS 2023
- Neighborhood character
- Predominantly White (79%)
- Race & ethnicity
- White 79% Hispanic / Latino 13% Two or more races 9% Black 4%
- Hispanic origin (detail)
- Puerto Rican 3% Dominican 1%
- Common ancestry
- Romanian 9% Scotch-Irish 9% Italian 2%
- Foreign-born
- 20% · Canada, Jamaica, Guatemala
- Languages at home
- 80% English-only · Spanish 12% Other Indo-European 2% French/Haitian/Cajun 2%
Political lean MEDSL · Palm Beach
- 2024 margin
- Toss-up / Even · D 50.0% · R 49.2%
- 2008→2024 swing
- -22.1pp toward R · 2008: 22.9pp · 2024: 0.8pp
- All cycles
- 2024: D+0.8 2020: D+12.8 2016: D+15.3 2012: D+17.0 2008: D+22.9
Not yet ingested
- Civics
- —
Market trends
- HPI YoY
- ▲ 0.69%
- Current HPI
- 242.5138
- Rent YoY
- ▲ 0.51%
- Metro
- Miami-Fort Lauderdale-Pompano Beach, FL
- State GDP YoY
- ▲ 3.28%
- F500 in state
- 36
Industry mix (Fortune 500 HQ in FL)
| Industry | F500 HQs | Revenue |
|---|---|---|
| Industrial Technology | 2 | $29B |
|
||
| Insurance | 2 | $17B |
|
||
| Retail | 1 | $60B |
|
||
| Technology Distribution | 1 | $58B |
|
||
| Homebuilding | 1 | $35B |
|
||
| Technology Manufacturing | 1 | $35B |
|
||
Price history
-99.9% since first listed20 events — show timeline
- 2026-06-04 Listed $5,000 NFMLS
- 2025-11-25 Pending — MARMLS
- 2025-11-25 Listing Removed — MARMLS
- 2025-11-19 Relisted — MARMLS
- 2025-09-25 Pending — MARMLS
- 2025-09-25 Listing Removed — MARMLS
- 2025-09-25 Listed $600,000 MARMLS
- 2023-10-20 Rental Removed $4,200 APPFOLIO
- 2023-10-15 Listed for Rent $4,200 APPFOLIO
- 2023-10-14 Rental Removed $4,200 RMLSFL
- 2023-10-11 Listed for Rent $4,200 RMLSFL
- 2023-08-21 Sold (Public Records) $620,000 Public Records
- 2023-08-11 Sold (MLS) $620,000 Beaches MLS
- 2023-05-03 Contingent — Beaches MLS
- 2023-04-21 Listed $649,000 Beaches MLS
- 2022-10-18 Sold (Public Records) $420,000 Public Records
- 2022-08-11 Listing Removed — Beaches MLS
- 2022-08-09 Listed $469,000 Beaches MLS
- 1994-05-18 Sold (Public Records) $32,000 Public Records
- 1993-03-24 Sold (Public Records) $5,400,000 Public Records
Property tax history
+7.7%/yrLatest (2025): $7,901 · -6.4% YoY. Source: county tax records.
Cash-flow waterfall
monthlySold comps — $/sqft
last 12 mo · ≤1 miLoading sold comps…