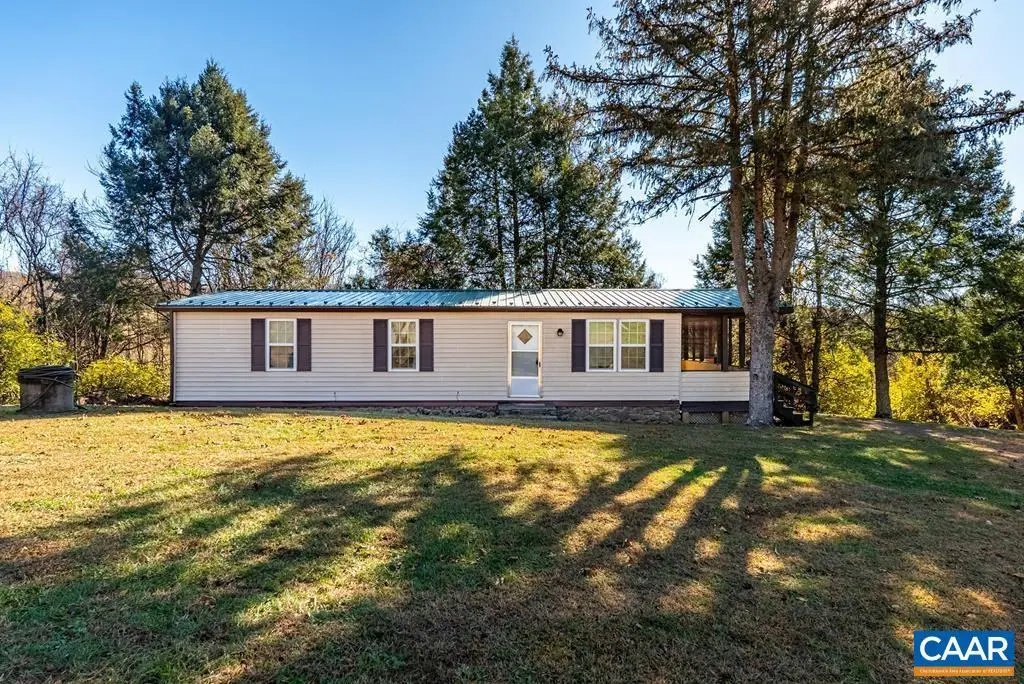
1066 Stevens Cove Rd · Lovingston, VA
Flood risk 1/10 · Minimal
- FEMA flood zone
- X (unshaded)
- Chance of flooding over 30 yrs
- 0.0%
- Est. flood insurance / yr
- $507 – $1,088
Fire risk 5/10 · Moderate
- Est. fire insurance / yr
- $666 – $1,236
Heat risk 6/10 · Moderate
- Hot days now (above 103°F)
- 7 days/yr
- Hot days in 30 yrs
- 18 days/yr
Wind risk 2/10 · Minimal
- Chance of severe wind over 30 yrs
- 3.0%
Air-quality risk 1/10 · Minimal
- Unhealthy air days now
- 0 days/yr
- Unhealthy air days in 30 yrs
- 0 days/yr
Risk factors via First Street. Map © Google.
Why this score? — see what drove the B- grade
The composite is a weighted blend of 9 inputs, each scored 0–100. Each bar is that input's sub-score; the figure is the points it added to the 100-point composite (weight × sub-score).
- Cash flow +26.8/30.0
- DSCR +9.2/10.0
- ARV discount +7.5/15.0
- 1% rule +6.0/10.0
- Appreciation +4.8/10.0
- Schools +4.4/10.0
- Livability +3.0/5.0
- Rent growth +2.5/5.0
- Condition / age +2.5/5.0
$169,900
🖨 Deal sheet 📄 Offer letter ✓ Due diligence
Listing remarks
Breathtaking Mountain Views! Welcome to 1066 Stevens Cove Road, a charming home that offers stunning panoramic views from every angle. This well-maintained property features a durable metal roof and central heating and air for year-round comfort. The beautifully updated kitchen boasts granite countertops, perfect for modern living. Enjoy peaceful country living with all the conveniences in place. Don’t miss your chance to take in the scenery—schedule your showing today! Please note that the seller is selling the property strictly "as is. "
Key facts
- Central heating
- Metal roof
- Panoramic views
Tags
Property features AI
Finance
- Financial info: Tax information available (annual tax noted)
Exterior
- Utilities: Private well water; Septic tank sewer
- Home design: Detached single-level home (one story)
- Construction: Manufactured construction; Stone foundation
- Exterior features: 1.34-acre lot; Satellite internet available
Interior
- Bedrooms: One main-level primary bedroom
- Bathrooms: One full bathroom on the main level
- Heating & cooling: Heat pump for heating and cooling
- Interior features: Primary bedroom on the main level
Neighborhood map
What this means for you Summary
Snapshot
- This is a 3-bed/1.0-bath manufactured listed at $170k.
Deal economics
- At list price, monthly cash flow is $464 ($6k/yr) — positive.
- The deal already cash-flows at list — no discount required.
- Meets the 1% rule at list price ($2k rent vs $170k).
- Recommended offer: $167k (1.5% below list) — sets the bar for market timing.
Location & tenants
- Location reads 59/100 on livability (#468 in VA) — a working-class tenant base; expect higher turnover. Strengths: crime A, cost of living A, housing B; Watch: amenities F, commute F, employment F.
- Nelson County Public School District (rural): math 42% / reading 62% proficiency, ranked #92 of 131 in VA (top 70%) — acceptable for families but not a draw, mixed tenant base, ~2y average lease.
- Zoned schools: Nelson Middle (math 44% / reading 66%, grade B-, #189 of 342 statewide, top 56%, 340 students, 78% FRL); Nelson County High (math 57% / reading 82%, grade B, #159 of 319 statewide, top 53%, 517 students, 70% FRL) — zoned schools average 74% FRL vs 44% district-wide (30 pts higher); higher-poverty schools than district average — tighter screening recommended.
- Market conditions: 13 active listings in the ZIP; 66 units permitted in Nelson County in 2024 (0 in 5+ unit buildings).
Forward outlook
- In year one you build about $523 of equity ($1k loan paydown + $-652 appreciation (-0.4% local appreciation)).
- Nelson County population projected at -19% by 2050 — secular population decline; favor cash flow + early exit over multi-decade hold.
- At projected returns (-0.4% appreciation + 3.0% rent growth), your $48k cash investment doubles in ~7 years — after that, you're playing with house money.
Negotiation context
- It's been on market 15 days — a 2% lower offer ($167k) is reasonable based on typical stale-listing flexibility.
- 8 sale attempts since 5y ago with the ask held roughly flat each time — persistent listings suggest the price (not the market) is what's stuck; bring a comps-based counter.
- Current owner paid $100k; list at $170k implies a 70% gain — meaningful room to come down on a strong offer.
Risks & watch-outs
- Climate carrying-cost: moderate wildfire risk; extreme-heat days projected 7→18/yr by 2055 (HVAC capex compounding) — expect insurance premiums to compound above CPI over the hold.
Questions for the listing agent
- Built in 1977 — when were the roof, HVAC, electrical panel, plumbing, and water heater last replaced?
- Is there a deadline driving the sale (1031 exchange, divorce, estate, relocation)? That informs how much negotiation room exists.
- Schools are B-rated — typically a magnet for longer-tenancy family renters. What's the average tenant stay here, and is there a school-zone premium baked into asking?
- What's the average days-on-market for RENTAL listings here right now (not sales)? A rising rental-DOM trend means longer vacancies and softer asking-rent achievability than the comps imply.
- What's the recent tenant-quality profile in this submarket — average credit score on applications, eviction rate, late-payment / NSF rate, and stable-employment percentage? A property-management company in the area should have these aggregated.
- How much new for-sale + rental construction is in the pipeline within 1–3 miles? Heavy new supply typically softens prices + rents 12–24 months out; constrained supply supports both.
Investment metrics
- 1% rule
- 1.10% ✓
- Cap rate
- 9.57%
- Cash-on-cash
- 11.70%
- DSCR
- 1.52
- GRM
- 7.6
CMA / ARV
No comps found within radius.
Projected returns pro-forma
-0.38% appreciation · 3.0% rent growth · sell at horizon
- IRR
- 9.7%
- Equity multiple
- 1.45×
- Total profit
- $21,461
- Equity at exit
- $46,100
- IRR
- 15.0%
- Equity multiple
- 2.58×
- Total profit
- $75,347
- Equity at exit
- $52,895
Cash invested: $47,572 (down + closing). Projections, not guarantees.
Landlord ↔ Tenant lean methodology
- Overall (STATE)
- 55 Moderately Landlord-Leaning
- State Virginia
- 55 Moderately Landlord-Leaning · D+2
- County
- — inherits STATE
- City
- — inherits STATE
ZIP-level market 22949
- Home prices YoY
- -0.1%
- Active inventory
- 13
- Price-to-rent
- 7.6×
Monthly cashflow live
- Estimated rent
- $1,864 medium interval (Pro) →
- Mortgage (P&I)
- −$891
- Tax from tax record
- −$47 /mo · $562/yr
- Insurance
- −$71
- HOA
- −$0
- Vacancy / Maint / Mgmt
- −$391
- Net cashflow
- $464
Break-even live
UW: 25.0% down · 7.5% · 30yr · 1.5% tax · 5.0% vac · 8.0% maint · 8.0% mgmt
Financing live
Cash to close
- Down payment
- $42,475
- Closing costs
- $5,097
- Reserves months
- —
- Total cash needed
- —
Loan-product check · same deal, 3 products live
Conventional
25% down · 7.5% · 30yr
- Down + closing
- —
- Monthly P&I
- —
- Monthly cashflow
- —
- DSCR
- —
- Eligible?
- —
Personal DTI + credit; lowest rate.
DSCR
20% down · 8.5% · 30yr
- Down + closing
- —
- Monthly P&I
- —
- Monthly cashflow
- —
- DSCR
- —
- Eligible?
- —
No personal income docs; deal must DSCR.
Hard money
10% down · 12.0% · 12mo
- Down + closing
- —
- Monthly P&I
- —
- Monthly cashflow
- —
- DSCR
- —
- Eligible?
- —
Short-term bridge; refi at stabilization.
Listing history 27 events
-
2026-06-12statusdays on market $169,900 Pending 15 DOM
-
2026-06-09days on market $169,900 Active 14 DOM
-
2026-06-08days on market $169,900 Active 13 DOM
-
2026-06-08days on market $169,900 Active 12 DOM
-
2026-06-07days on market $169,900 Active 11 DOM
-
2026-06-03days on market $169,900 Active 8 DOM
-
2026-06-02days on market $169,900 Active 7 DOM
-
2026-06-01days on market $169,900 Active 6 DOM
-
2026-05-31days on market $169,900 Active 5 DOM
-
2026-05-26price $169,900
-
2026-05-26$169,000 Active
-
2025-12-05status Pending
-
2025-12-05status Pending
-
2025-12-05status Pending
-
2025-12-04historical
-
2025-12-04historical
-
2025-12-01status Active
-
2025-12-01status Active
-
2025-12-01status Active
-
2025-11-12status Pending
-
2025-11-12status Pending
-
2025-11-12status Pending
-
2025-11-11$169,900 Active
-
2025-11-11$169,900 Active
-
2025-11-11$169,900 Active
-
2022-01-25soldstatus $100,000
-
2021-10-01$109,900
ⓘ Source: listings_history table (triggers on properties + properties_extension) + one-shot
backfill from property_details.listing_events for pre-trigger history.
Tax reassessment forecast VA · Resets to sale price
- Current annual tax
- $562 · $47/mo
- Projected year-2 tax
- $1,393 · $116/mo
- Expected delta
- +$831/yr (+$69/mo · 147.8%)
ⓘ Screening estimate from a state-policy table — verify with the county assessor before closing.
Climate risk First Street
- Flood 1/10 Low FEMA zone X (unshaded) · 0% chance over 30 yrs
- Wildfire 5/10 Major
- Heat 6/10 Major 7 d/yr ≥103°F today · 18 d/yr by 30 yrs out
- Wind 2/10 Low 3% chance of damaging wind over 30 yrs
- Air quality 1/10 Low 0 unhealthy d/yr today · 0 by 30 yrs out
Nearby sold comps map
Loading sold comps map…
Walkable amenities ~0.75 mi
Loading nearby amenities…
Taxation est. · year 1
- Rental income
- $22,367
- − Mortgage interest
- −$9,517
- − Property taxes
- −$562
- − Insurance
- −$850
- − Repairs & maintenance
- −$1,789
- − Management
- −$1,789
- − Depreciation
- −$4,943
- Taxable income
- $2,917
- Est. tax owed @ 24.0%
- −$700
- After-tax cash flow
- $4,866/yr
For passive investors: Depreciation is non-cash, so a rental often shows a tax loss while cash-flowing — sheltering income. Rental losses are passive: they offset passive income freely, and up to $25,000/yr can offset ordinary (W-2) income if you actively participate and your MAGI is under $100k (phasing out to $0 by $150k); unused losses carry forward. On sale, claimed depreciation is recaptured at up to 25%, and gains may owe capital-gains tax (a 1031 exchange can defer both). Figures are a year-1 estimate at your 24.0% rate — not tax advice; consult a CPA.
Schools (NCES district)
- District
- Nelson County Public School District
- NCES district ID
- 5102580
- Math proficiency
- 42% ▼ -45.00%
- Reading proficiency
- 62% ▼ -14.00%
- Median HH income
- $50,092
- Composite
- 44.37/100
- National rank
- #2818
- State rank
- #92 of 131 in VA
Livability — Lovingston
- Score
- 59/100
- State rank
- #468
- US rank
- #19994
Category grades
Schools grade is shown separately in the Schools card above.
Census & demographics
- Population (ZIP)
- 1,260
Population outlook (Nelson County) Hauer SSP2
- Today (2025)
- 14,115 people
- By 2030
- 13,563 · -3.9%
- By 2040
- 12,384 · -12.3%
- By 2050
- 11,481 · -18.7%
- By 2075
- 10,103 · -28.4%
- By 2100
- 8,788 · -37.7%
Race, ethnicity, and origin ACS 2023
- Neighborhood character
- Predominantly White (73%)
- Race & ethnicity
- White 73% Black 16% Two or more races 10% Hispanic / Latino 6%
- Hispanic origin (detail)
- Puerto Rican 2%
- Common ancestry
- Serbian 4% Italian 3% Lithuanian 3%
- Foreign-born
- 1%
- Languages at home
- 99% English-only · Tagalog/Filipino 1%
Political lean MEDSL · Nelson
- 2024 margin
- Lean R (+7.5) · D 45.8% · R 53.3%
- 2008→2024 swing
- -16.7pp toward R · 2008: 9.2pp · 2024: -7.5pp
- All cycles
- 2024: R+7.5 2020: R+5.2 2016: R+5.7 2012: D+2.8 2008: D+9.2
Not yet ingested
- Civics
- —
Market trends
- HPI YoY
- ▼ -0.38%
- Current HPI
- 328.8433
- Rent YoY
- —
- Metro
- —
- State GDP YoY
- ▲ 2.40%
- F500 in state
- 50
Industry mix (Fortune 500 HQ in VA)
| Industry | F500 HQs | Revenue |
|---|---|---|
| Aerospace / Defense | 4 | $236B |
|
||
| Technology / Defense | 3 | $32B |
|
||
| Financial Services | 2 | $176B |
|
||
| Utilities | 2 | $27B |
|
||
| Insurance | 2 | $25B |
|
||
| Technology | 2 | $15B |
|
||
Price history
+54.6% since first listed18 events — show timeline
- 2026-05-26 Price Changed $169,900 CAAR
- 2026-05-26 Listed $169,000 CAAR
- 2025-12-05 Pending — CAAR
- 2025-12-05 Pending — CVRMLS
- 2025-12-05 Pending — SCAR
- 2025-12-04 Listing Removed — CVRMLS
- 2025-12-04 Listing Removed — CAAR
- 2025-12-01 Relisted — SCAR
- 2025-12-01 Relisted — CAAR
- 2025-12-01 Relisted — CVRMLS
- 2025-11-12 Pending — CVRMLS
- 2025-11-12 Pending — SCAR
- 2025-11-12 Pending — CAAR
- 2025-11-11 Listed $169,900 SCAR
- 2025-11-11 Listed $169,900 CVRMLS
- 2025-11-11 Listed $169,900 CAAR
- 2022-01-25 Sold (MLS) $100,000 LMLS
- 2021-10-01 Listed $109,900 LMLS
Property tax history
+0.9%/yrLatest (2019): $562 · +4.6% YoY. Source: county tax records.
Cash-flow waterfall
monthlySold comps — $/sqft
last 12 mo · ≤1 miLoading sold comps…