2233 E Behrend Dr #45 · Phoenix, AZ
Flood risk 1/10 · Minimal
- FEMA flood zone
- X (shaded)
- Chance of flooding over 30 yrs
- 0.0%
- Est. flood insurance / yr
- $507 – $1,088
Fire risk 4/10 · Minor
- Est. fire insurance / yr
- $610 – $1,132
Heat risk 8/10 · Major
- Hot days now (above 110°F)
- 5 days/yr
- Hot days in 30 yrs
- 13 days/yr
Wind risk 1/10 · Minimal
- Chance of severe wind over 30 yrs
- —
Air-quality risk 3/10 · Minor
- Unhealthy air days now
- 3 days/yr
- Unhealthy air days in 30 yrs
- 5 days/yr
Risk factors via First Street. Map © Google.
Why this score? — see what drove the C+ grade
The composite is a weighted blend of 9 inputs, each scored 0–100. Each bar is that input's sub-score; the figure is the points it added to the 100-point composite (weight × sub-score).
- Cash flow +30.0/30.0
- 1% rule +10.0/10.0
- DSCR +10.0/10.0
- Condition / age +4.0/5.0
- Schools +3.8/10.0
- Livability +3.8/5.0
- Rent growth +2.9/5.0
- ARV discount +0.0/15.0
- Appreciation +0.0/10.0
$94,900
🖨 Deal sheet 📄 Offer letter ✓ Due diligence
Listing remarks MLS
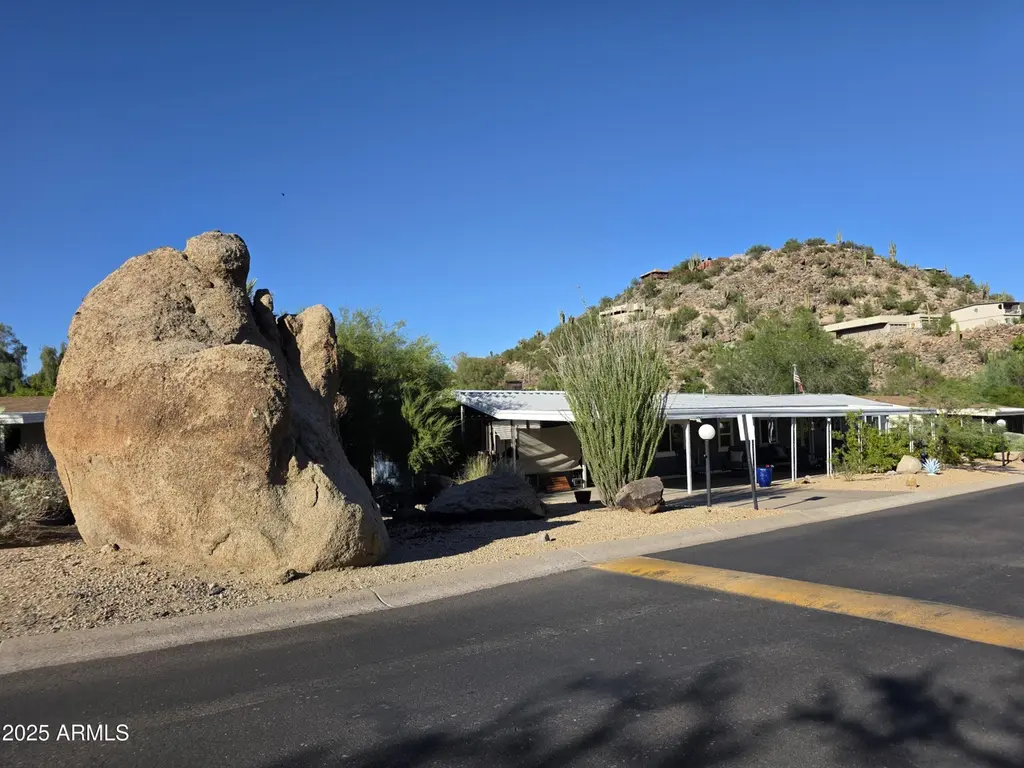
Oversized 70'x16' (1,120 sf) single-wide with great views of the boulders! Desirable split 2 bed, 2 bath floor plan with new roof (2024), exterior paint (Sept 2025). Features vaulted ceilings, double-pane windows, ceiling fans, and a spacious kitchen with granite counters, breakfast bar, island, hallway pantry, and heavy-duty metal pull-out drawers. Stainless steel appliances, two refrigerators, washer, and dryer included. Great room layout ideal for entertaining. Oversized covered patio with double-door entry & extra-long carport for up to four cars. Community offers 2 pools, pickleball, tennis, clubhouse, and more. No rentals allowed. Park requires minimum credit score of 750, 3x the lot rent in verifiable monthly income, & pass a background check. 55+ Community. Lot Rent $1030 monthly
Key facts
- 4 parking spots
- Community pool
- Built 1985
Neighborhood map
What this means for you Summary
Snapshot
- This is a 2-bed/2.0-bath manufactured listed at $95k. Condition is rated good.
Deal economics
- At list price, monthly cash flow is $1k ($12k/yr) — positive.
- The deal already cash-flows at list — no discount required.
- Meets the 1% rule at list price ($2k rent vs $95k).
- Recommended offer: $84k (12.0% below list) — sets the bar for market timing.
- Cap rate 19.1% vs local median 3.3% in Phoenix — top-decile yield for the area; either an underpriced asset or a hidden risk that comps aren't pricing in. Stress-test before assuming the spread holds.
Location & tenants
- Location reads 75/100 on livability (#16 in AZ, #3,924 nationally) — a middle-class / working-renter tenant base. Strengths: amenities A+, commute A+, housing A+; Watch: health & safety C-, crime F.
- Paradise Valley Unified District (4241) (urban): math 39% / reading 46% proficiency, ranked #56 of 249 in AZ (top 22%) — families likely to look elsewhere, expect single-tenant / working-renter base with shorter leases.
- Market conditions: Rents rising (+1.4%/yr); 201 active listings in the ZIP; 40 comparable units currently listed for rent nearby; rentals leasing fast (median 13d on market — plan ~1-2 weeks tenant-placement turnaround); solid renter incomes; 36,011 units permitted in Maricopa County in 2024 (12,801 in 5+ unit buildings).
Forward outlook
- Local home prices are declining (-3.0%/yr); year-one equity from $656 of loan paydown is wiped out by about $3k of value loss. Plan a longer hold.
- Maricopa County population projected at +38% by 2050 — long-run rental-demand tailwind backs the buy-and-hold thesis.
- At projected returns (-3.0% appreciation + 1.4% rent growth), your $27k cash investment doubles in ~3 years — after that, you're playing with house money.
Negotiation context
- It's been on market 237 days — a 12% lower offer ($84k) is reasonable based on typical stale-listing flexibility.
Risks & watch-outs
- Climate carrying-cost: extreme-heat days projected 5→13/yr by 2055 (HVAC capex compounding) — expect insurance premiums to compound above CPI over the hold.
Questions for the listing agent
- It's been on market 237 days. Have you received any prior offers? Is the seller open to a 12% concession, seller financing, or rate buy-down credit?
- Why hasn't it sold? Are there any deal-killer items the seller is aware of (foundation, flood, title, zoning, code violations)?
- Is there a deadline driving the sale (1031 exchange, divorce, estate, relocation)? That informs how much negotiation room exists.
- Crime grade is F in this area — have there been break-ins, vandalism, or insurance claims at this property in the last 3 years? What carrier currently insures it and at what premium?
- What's the average days-on-market for RENTAL listings here right now (not sales)? A rising rental-DOM trend means longer vacancies and softer asking-rent achievability than the comps imply.
- What's the recent tenant-quality profile in this submarket — average credit score on applications, eviction rate, late-payment / NSF rate, and stable-employment percentage? A property-management company in the area should have these aggregated.
- How much new for-sale + rental construction is in the pipeline within 1–3 miles? Heavy new supply typically softens prices + rents 12–24 months out; constrained supply supports both.
Investment metrics
- 1% rule
- 2.23% ✓
- Cap rate
- 19.12%
- Cash-on-cash
- 45.80%
- DSCR
- 3.04
- GRM
- 3.7
CMA / ARV
- ARV (median comp)
- $79,950
- List price
- $94,900
- Delta
- 18.70%
- Verdict
- OVERPRICED
- Comps
- 20 within 1.0 mi
Show comp detail 12 sales within ~0.75 mi
| Address | Dist | Beds/Ba | Sqft | Sold | Price | $/sf | Match |
|---|---|---|---|---|---|---|---|
| 2233 E Behrend Dr #219 | 0.09mi | 2/2.0 | 1,152 (+3%) | 0mo | $90,000 | $78 | 91 |
| 2233 E Behrend Dr #81 | 0.00mi | 2/2.0 | 1,040 (-7%) | 2mo | $52,000 | $50 | 87 |
| 2233 E Behrend Dr #92 | 0.00mi | 2/2.0 | 1,056 (-6%) | 5mo | $20,000 | $19 | 86 |
| 2233 E Behrend Dr #210 | 0.14mi | 2/2.0 | 1,144 (+2%) | 7mo | $150,000 | $131 | 84 |
| 2233 E Behrend Dr #93 | 0.08mi | 2/2.0 | 1,056 (-6%) | 6mo | $47,000 | $45 | 81 |
| 2233 E Behrend Dr #152 | 0.00mi | 2/2.0 | 980 (-12%) | 3mo | $42,500 | $43 | 77 |
| 2233 E Behrend Dr #78 | 0.00mi | 3/2.0 (+1) | 1,248 (+11%) | 0mo | $69,900 | $56 | 76 |
| 2233 E Behrend Dr #29 | 0.14mi | 2/2.0 | 1,248 (+11%) | 2mo | $131,000 | $105 | 72 |
| 2233 E Behrend Dr #121 | 0.14mi | 2/2.0 | 1,240 (+11%) | 7mo | $54,900 | $44 | 70 |
| 19809 N 26th St | 0.60mi | 3/2.0 (+1) | 1,152 (+3%) | 7mo | $125,000 | $109 | 57 |
| 19225 N Cave Creek Rd #45 | 0.47mi | 2/2.0 | 1,248 (+11%) | 11mo | $47,900 | $38 | 50 |
| 2701 E Utopia Rd #66 | 0.70mi | 2/2.0 | 1,024 (-9%) | 10mo | $50,000 | $49 | 45 |
Match score weights: distance 35% · size 25% · config 20% · recency 20%. Top-matched comps best support the ARV.
Projected returns pro-forma
-3.0% appreciation · 1.44% rent growth · sell at horizon
- IRR
- 41.2%
- Equity multiple
- 2.73×
- Total profit
- $45,973
- Equity at exit
- $14,150
- IRR
- 46.7%
- Equity multiple
- 5.15×
- Total profit
- $110,334
- Equity at exit
- $8,205
Cash invested: $26,572 (down + closing). Projections, not guarantees.
Landlord ↔ Tenant lean methodology
- Overall (STATE)
- 87 Strongly Landlord-Friendly
- State Arizona
- 87 Strongly Landlord-Friendly · R+3
- County
- — inherits STATE
- City
- — inherits STATE
ZIP-level market 85024
- Home prices YoY
- -21.0%
- Rents YoY
- 1.4%
- Active inventory
- 201
- Price-to-rent
- 3.7×
Monthly cashflow live
- Estimated rent
- $2,114 high interval (Pro) →
- Mortgage (P&I)
- −$498
- Tax est. 1.5%
- −$119 /mo · $1,424/yr
- Insurance
- −$40
- HOA
- −$0
- Vacancy / Maint / Mgmt
- −$444
- Net cashflow
- $1,014
Break-even live
UW: 25.0% down · 7.5% · 30yr · 1.5% tax · 5.0% vac · 8.0% maint · 8.0% mgmt
Financing live
Cash to close
- Down payment
- $23,725
- Closing costs
- $2,847
- Reserves months
- —
- Total cash needed
- —
Loan-product check · same deal, 3 products live
Conventional
25% down · 7.5% · 30yr
- Down + closing
- —
- Monthly P&I
- —
- Monthly cashflow
- —
- DSCR
- —
- Eligible?
- —
Personal DTI + credit; lowest rate.
DSCR
20% down · 8.5% · 30yr
- Down + closing
- —
- Monthly P&I
- —
- Monthly cashflow
- —
- DSCR
- —
- Eligible?
- —
No personal income docs; deal must DSCR.
Hard money
10% down · 12.0% · 12mo
- Down + closing
- —
- Monthly P&I
- —
- Monthly cashflow
- —
- DSCR
- —
- Eligible?
- —
Short-term bridge; refi at stabilization.
Rent comps 40 comps
| Address | Beds | Baths | Sqft | Rent | $/sqft | DOM | Units | Dist |
|---|---|---|---|---|---|---|---|---|
| 2030 E Wahalla Ln Phoenix, AZ | 3.0 | 2.0 | 1400 | $2,115 | $1.51 | 2d | 1 | 0.25mi |
| 2336 E Utopia Rd Phoenix, AZ | 2.0–3.0 | 2.5 | 1327 | $2,395 | $1.80 | 5d | 1 | 0.27mi |
| 2335 E Utopia Rd Unit 16 Phoenix, AZ | 3.0 | 2.5 | 1426 | $2,550 | $1.79 | 18d | 1 | 0.28mi |
| 20007 N 20th Way Phoenix, AZ | 3.0 | 2.0 | 1251 | $3,900 | $3.12 | 43d | 1 | 0.28mi |
| 20050 N Cave Creek Rd Phoenix, AZ | 1.0–2.0 | 1.0–2.0 | 909 | $1,770 | $1.95 | 1d | 10 | 0.37mi |
| 19635 N Cave Creek Rd Phoenix, AZ | 3.0 | 1.0–2.0 | 999 | $1,643 | $1.64 | 1d | 22 | 0.43mi |
| 2220 E Beardsley Rd Phoenix, AZ | 4.0 | 1.0–2.0 | 855 | $1,694 | $1.98 | 2d | 62 | 0.46mi |
| 2500 E Marco Polo Rd Phoenix, AZ | 2.0 | 1.0–2.0 | 918 | $2,390 | $2.60 | 2d | 16 | 0.48mi |
| 18660 N Cave Creek Rd Phoenix, AZ | 1.0–3.0 | 1.0–2.0 | 961 | $1,622 | $1.69 | 1d | 11 | 0.58mi |
| 18416 N Cave Creek Rd Unit 6 Phoenix, AZ | 1.0 | 1.0 | 748 | $1,250 | $1.67 | 7d | 1 | 0.70mi |
| 2221 E Union Hills Dr #158 Phoenix, AZ | 3.0 | 2.0 | 1332 | $2,100 | $1.58 | 18d | 1 | 0.71mi |
| 18416 N Cave Creek Rd Phoenix, AZ | 2.0 | 1.0–2.0 | 786 | $3,000 | $3.81 | 3d | 9 | 0.77mi |
| 1717 E Union Hills Dr Phoenix, AZ | 2.0–3.0 | 2.0 | 1245 | $1,775 | $1.43 | 21d | 4 | 0.80mi |
| 1717 E Union Hills Dr Phoenix, AZ | 2.0–3.0 | 2.0 | 1169 | $1,675 | $1.43 | 2d | 3 | 0.80mi |
| 1510 E Taro Ln Phoenix, AZ | 3.0 | 2.0 | 1136 | $2,149 | $1.89 | 24d | 1 | 0.82mi |
| 1717 E Union Hills Dr #1052 Phoenix, AZ | 2.0 | 2.0 | 1160 | $4,000 | $3.45 | 43d | 1 | 0.85mi |
| 1506 E Wescott Dr Phoenix, AZ | 3.0 | 2.0 | 1136 | $2,045 | $1.80 | 5d | 1 | 0.85mi |
| 18202 N Cave Creek Rd Phoenix, AZ | 1.0–3.0 | 1.0–2.0 | 722 | $1,148 | $1.59 | 3d | 7 | 0.90mi |
| 1420 E Topeka Dr Phoenix, AZ | 3.0 | 2.5 | 1464 | $2,215 | $1.51 | 7d | 1 | 0.94mi |
| 18633 N 15th St Phoenix, AZ | 3.0 | 2.0 | 1240 | $2,249 | $1.81 | 7d | 1 | 0.95mi |
| 2077 E Charleston Ave Phoenix, AZ | 2.0 | 1.0 | 720 | $1,295 | $1.80 | 24d | 1 | 1.03mi |
| 2067 E Charleston Ave Phoenix, AZ | 2.0 | 2.0 | 840 | $1,395 | $1.66 | 24d | 1 | 1.03mi |
| 2934 E Blackhawk Dr Phoenix, AZ | 3.0 | 2.0 | 1467 | $2,280 | $1.55 | 1d | 1 | 1.07mi |
| 2554 E Villa Rita Dr Phoenix, AZ | 2.0 | 1.0 | 1118 | $2,750 | $2.46 | 24d | 1 | 1.09mi |
| 1702 E Michelle Dr Phoenix, AZ | 2.0 | 2.0 | 1300 | $2,200 | $1.69 | 4d | 1 | 1.10mi |
| 20223 N 30th St Phoenix, AZ | 3.0 | 2.0 | 1467 | $2,300 | $1.57 | 1d | 1 | 1.13mi |
| 2755 E Michigan Ave Phoenix, AZ | 3.0 | 2.0 | 1316 | $2,700 | $2.05 | 17d | 1 | 1.15mi |
| 2602 E Charleston Ave Phoenix, AZ | 3.0 | 2.0 | 1426 | $2,100 | $1.47 | 24d | 1 | 1.16mi |
| 3056 E Siesta Ln Phoenix, AZ | 3.0 | 2.0 | 1476 | $2,375 | $1.61 | 12d | 1 | 1.22mi |
| 17602 N Cave Creek Rd Phoenix, AZ | 2.0 | 1.0–2.0 | 650 | $1,625 | $2.50 | 2d | 13 | 1.23mi |
| 3122 E Topeka Dr Phoenix, AZ | 3.0 | 2.0 | 1272 | $2,100 | $1.65 | 21d | 1 | 1.24mi |
| 3220 E Kerry Ln Phoenix, AZ | 3.0 | 2.0 | 1370 | $2,299 | $1.68 | 24d | 1 | 1.35mi |
| 3220 E Kerry Ln Phoenix, AZ | 3.0 | 2.0 | 1370 | $2,299 | $1.68 | 14d | 1 | 1.35mi |
| 17606 N 17th Pl Phoenix, AZ | 2.0–3.0 | 2.0–2.5 | 1463 | $1,999 | $1.37 | 2d | 3 | 1.35mi |
| 17606 N 17th Pl Phoenix, AZ | 2.0–3.0 | 2.5 | 1472 | $1,999 | $1.36 | 12d | 3 | 1.35mi |
| 3214 E Siesta Ln Phoenix, AZ | 2.0 | 2.0 | 1228 | $2,200 | $1.79 | 24d | 1 | 1.40mi |
| 1814 E Bell Rd Phoenix, AZ | 1.0–2.0 | 1.0–2.0 | 1003 | $1,637 | $1.63 | 1d | 12 | 1.45mi |
| 17150 N 23rd St #135 Phoenix, AZ | 2.0 | 2.5 | 1186 | $1,900 | $1.60 | 14d | 1 | 1.46mi |
| 17365 N Cave Creek Rd #124 Phoenix, AZ | 3.0 | 2.5 | 1468 | $2,299 | $1.57 | 14d | 1 | 1.46mi |
| 3301 E Wescott Dr Phoenix, AZ | 3.0 | 2.0 | 1101 | $1,995 | $1.81 | 24d | 1 | 1.47mi |
Listing history 8 events
-
2026-06-03days on market $94,900 Active 237 DOM
-
2026-06-02days on market $94,900 Active 236 DOM
-
2026-06-01days on market $94,900 Active 235 DOM
-
2026-05-31days on market $94,900 Active 234 DOM
-
2026-04-28price $94,900 807-char remark
Show marketing remark (807 chars)
Oversized 70'x16' (1,120 sf) single-wide with great views of the boulders! Desirable split 2 bed, 2 bath floor plan with new roof (2024), exterior paint (Sept 2025). Features vaulted ceilings, double-pane windows, ceiling fans, and a spacious kitchen with granite counters, breakfast bar, island, hallway pantry, and heavy-duty metal pull-out drawers. Stainless steel appliances, two refrigerators, washer, and dryer included. Great room layout ideal for entertaining. Oversized covered patio with double-door entry & extra-long carport for up to four cars. Community offers 2 pools, pickleball, tennis, clubhouse, and more. No rentals allowed. Park requires minimum credit score of 750, 3x the lot rent in verifiable monthly income, & pass a background check. 55+ Community. Lot Rent $1030 monthly
-
2026-02-23price $100,000 807-char remark
Show marketing remark (807 chars)
Oversized 70'x16' (1,120 sf) single-wide with great views of the boulders! Desirable split 2 bed, 2 bath floor plan with new roof (2024), exterior paint (Sept 2025). Features vaulted ceilings, double-pane windows, ceiling fans, and a spacious kitchen with granite counters, breakfast bar, island, hallway pantry, and heavy-duty metal pull-out drawers. Stainless steel appliances, two refrigerators, washer, and dryer included. Great room layout ideal for entertaining. Oversized covered patio with double-door entry & extra-long carport for up to four cars. Community offers 2 pools, pickleball, tennis, clubhouse, and more. No rentals allowed. Park requires minimum credit score of 750, 3x the lot rent in verifiable monthly income, & pass a background check. 55+ Community. Lot Rent $1030 monthly
-
2026-01-21price $115,000 807-char remark
Show marketing remark (807 chars)
Oversized 70'x16' (1,120 sf) single-wide with great views of the boulders! Desirable split 2 bed, 2 bath floor plan with new roof (2024), exterior paint (Sept 2025). Features vaulted ceilings, double-pane windows, ceiling fans, and a spacious kitchen with granite counters, breakfast bar, island, hallway pantry, and heavy-duty metal pull-out drawers. Stainless steel appliances, two refrigerators, washer, and dryer included. Great room layout ideal for entertaining. Oversized covered patio with double-door entry & extra-long carport for up to four cars. Community offers 2 pools, pickleball, tennis, clubhouse, and more. No rentals allowed. Park requires minimum credit score of 750, 3x the lot rent in verifiable monthly income, & pass a background check. 55+ Community. Lot Rent $1030 monthly
-
2025-10-09$120,000 Active 807-char remark
Show marketing remark (807 chars)
Oversized 70'x16' (1,120 sf) single-wide with great views of the boulders! Desirable split 2 bed, 2 bath floor plan with new roof (2024), exterior paint (Sept 2025). Features vaulted ceilings, double-pane windows, ceiling fans, and a spacious kitchen with granite counters, breakfast bar, island, hallway pantry, and heavy-duty metal pull-out drawers. Stainless steel appliances, two refrigerators, washer, and dryer included. Great room layout ideal for entertaining. Oversized covered patio with double-door entry & extra-long carport for up to four cars. Community offers 2 pools, pickleball, tennis, clubhouse, and more. No rentals allowed. Park requires minimum credit score of 750, 3x the lot rent in verifiable monthly income, & pass a background check. 55+ Community. Lot Rent $1030 monthly
ⓘ Source: listings_history table (triggers on properties + properties_extension) + one-shot
backfill from property_details.listing_events for pre-trigger history.
Climate risk First Street
- Flood 1/10 Low FEMA zone X (shaded) · 0% chance over 30 yrs
- Wildfire 4/10 Moderate
- Heat 8/10 Severe 5 d/yr ≥110°F today · 13 d/yr by 30 yrs out
- Wind 1/10 Low
- Air quality 3/10 Moderate 3 unhealthy d/yr today · 5 by 30 yrs out
Nearby sold comps map
Loading sold comps map…
Walkable amenities ~0.75 mi
Loading nearby amenities…
Taxation est. · year 1
- Rental income
- $25,365
- − Mortgage interest
- −$5,316
- − Property taxes
- −$1,424
- − Insurance
- −$474
- − Repairs & maintenance
- −$2,029
- − Management
- −$2,029
- − Depreciation
- −$2,761
- Taxable income
- $11,332
- Est. tax owed @ 24.0%
- −$2,720
- After-tax cash flow
- $9,449/yr
For passive investors: Depreciation is non-cash, so a rental often shows a tax loss while cash-flowing — sheltering income. Rental losses are passive: they offset passive income freely, and up to $25,000/yr can offset ordinary (W-2) income if you actively participate and your MAGI is under $100k (phasing out to $0 by $150k); unused losses carry forward. On sale, claimed depreciation is recaptured at up to 25%, and gains may owe capital-gains tax (a 1031 exchange can defer both). Figures are a year-1 estimate at your 24.0% rate — not tax advice; consult a CPA.
Condition & rehab AI · 12 photos
This manufactured home is in good condition with recent updates and a desirable split floor plan. It's move-in ready with a good curb appeal and potential for further value through landscaping and exterior painting.
Value-add opportunities
- Both Landscaping — Enhances curb appeal and adds value
- Both Paint exterior — Fresh paint can improve curb appeal and value
- Both Replace ceiling fans — Ceiling fans can improve air circulation and comfort
Renovation cost estimate screening
Value-add ROI direction
- Both Landscaping — Enhances curb appeal and adds value ↑
- Both Paint exterior — Fresh paint can improve curb appeal and value ↑
- Both Replace ceiling fans — Ceiling fans can improve air circulation and comfort ↑
ⓘ Cost ranges are severity-bucket heuristics (US national rule-of-thumb). Get contractor quotes + a written scope before underwriting a rehab budget.
Schools (NCES district)
- District
- Paradise Valley Unified District (4241)
- NCES district ID
- 0405930
- Math proficiency
- 39% ▼ -11.00%
- Reading proficiency
- 46% ▼ -7.00%
- Median HH income
- $64,106
- Composite
- 37.89/100
- National rank
- #4316
- State rank
- #56 of 249 in AZ
Livability — Phoenix
- Score
- 75/100
- State rank
- #16
- US rank
- #3924
Category grades
Schools grade is shown separately in the Schools card above.
Census & demographics
- Census place
- Phoenix, AZ
- County
- Maricopa County · 4,537,380 people
- City population
- 1,500,198
- Metro
- Phoenix-Mesa-Chandler, AZ
- Population (ZIP)
- 26,199
- Household income
- $106,724
- Rent vs Own
- Severe rent burden
- 547.0
Population outlook (Maricopa County) Hauer SSP2
- Today (2025)
- 4,979,203 people
- By 2030
- 5,378,229 · +8.0%
- By 2040
- 6,156,598 · +23.6%
- By 2050
- 6,872,376 · +38.0%
- By 2075
- 8,401,270 · +68.7%
- By 2100
- 9,247,439 · +85.7%
Race, ethnicity, and origin ACS 2023
- Neighborhood character
- Predominantly White (71%)
- Race & ethnicity
- White 71% Hispanic / Latino 16% Two or more races 12% Asian 6% Black 2%
- Hispanic origin (detail)
- Mexican 13% Puerto Rican 1%
- Common ancestry
- Romanian 3% Italian 3% Portuguese 3%
- Foreign-born
- 12% · Canada, China, South Korea
- Languages at home
- 78% English-only · Spanish 10% Other Indo-European 4% Russian/Polish/Slavic 1%
Political lean MEDSL · Maricopa
- 2024 margin
- Toss-up / Even · D 47.7% · R 51.2% · Other 1.1%
- 2008→2024 swing
- +7.1pp toward D · 2008: -10.6pp · 2024: -3.5pp
- All cycles
- 2024: R+3.5 2020: D+2.2 2016: R+3.5 2012: R+12.0 2008: R+10.6
Not yet ingested
- Civics
- —
Market trends
- HPI YoY
- ▼ -82.95%
- Current HPI
- 312.7238
- Rent YoY
- ▲ 1.44%
- Metro
- Phoenix-Mesa-Chandler, AZ
- State GDP YoY
- ▲ 4.54%
- F500 in state
- 20
Industry mix (Fortune 500 HQ in AZ)
| Industry | F500 HQs | Revenue |
|---|---|---|
| Technology | 2 | $13B |
|
||
| Mining / Metals | 1 | $23B |
|
||
| Environmental Services | 1 | $16B |
|
||
| Metals / Steel | 1 | $14B |
|
||
| Technology Distribution | 1 | $9B |
|
||
| Homebuilding | 1 | $8B |
|
||
Price history
-20.9% since first listed4 events — show timeline
- 2026-04-28 Price Changed $94,900 ARMLS
- 2026-02-23 Price Changed $100,000 ARMLS
- 2026-01-21 Price Changed $115,000 ARMLS
- 2025-10-09 Listed $120,000 ARMLS
Cash-flow waterfall
monthlySold comps — $/sqft
last 12 mo · ≤1 miLoading sold comps…