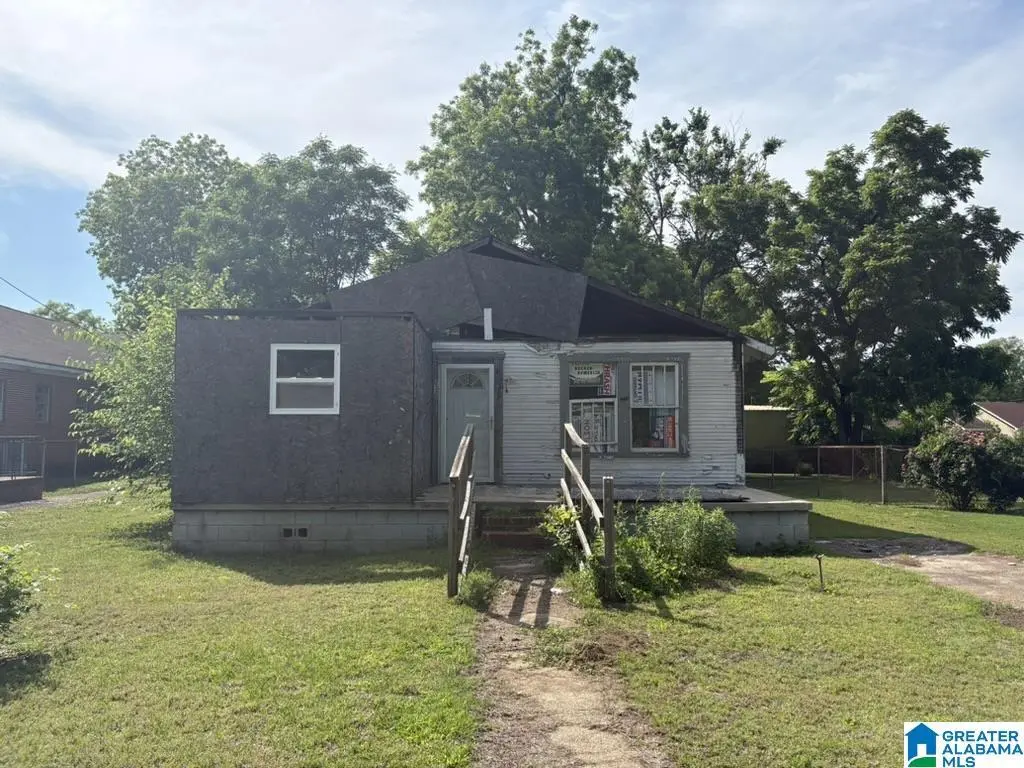
2320 12th Ct N · Bessemer, AL
Flood risk 4/10 · Minor
- FEMA flood zone
- X (unshaded)
- Chance of flooding over 30 yrs
- 0.22%
- Est. flood insurance / yr
- $507 – $1,088
Fire risk 3/10 · Minor
- Est. fire insurance / yr
- $916 – $1,700
Heat risk 7/10 · Major
- Hot days now (above 108°F)
- 7 days/yr
- Hot days in 30 yrs
- 20 days/yr
Wind risk 6/10 · Moderate
- Chance of severe wind over 30 yrs
- 35.0%
Air-quality risk 3/10 · Minor
- Unhealthy air days now
- 2 days/yr
- Unhealthy air days in 30 yrs
- 5 days/yr
Risk factors via First Street. Map © Google.
Why this score? — see what drove the D grade
The composite is a weighted blend of 9 inputs, each scored 0–100. Each bar is that input's sub-score; the figure is the points it added to the 100-point composite (weight × sub-score).
- Cash flow +15.0/30.0
- ARV discount +7.5/15.0
- 1% rule +5.0/10.0
- DSCR +5.0/10.0
- Livability +3.0/5.0
- Condition / age +2.5/5.0
- Rent growth +1.7/5.0
- Schools +0.8/10.0
- Appreciation +0.0/10.0
$15,000
🖨 Deal sheet (PDF) 📄 Offer letter ✓ Due diligence
Listing remarks
FIXER UPPER!
Key facts
- 7,405 sq ft lot
- Built 1940
- Listed 21 days
Property features AI
Finance
- HOA & community: No association fees
Exterior
- Parking: Driveway parking
- Utilities: Public water; Connected sewer; Electric water heater; Internet service availability unknown
- Home design: Existing single-family style (per listing); Single-story living areas (rooms listed at level 1)
- Construction: Siding (other) exterior; Slab foundation
- Exterior features: No pool, patio, deck, or garden/patio; Not waterfront; Lot approximately 0.17 acres; Located in the Carver Place subdivision
Interior
- Kitchen: Solid surface countertops
- Bedrooms: Three bedrooms on main level
- Flooring: Hardwood floors; Subflooring
- Bathrooms: One full bathroom with tub/shower combo
- Heating & cooling: No heating system; No air conditioning
- Interior features: 9-foot+ ceilings; Solid surface kitchen countertops; No additional interior amenities listed
- Laundry & utility: No heat and no air (no built-in HVAC); Electric water heater
Neighborhood map
What this means for you Summary
Snapshot
- This is a 3-bed/1.0-bath single-family listed at $15k.
Deal economics
- At list price, monthly cash flow is $837 ($10k/yr) — positive.
- The deal already cash-flows at list — no discount required.
- Meets the 1% rule at list price ($1k rent vs $15k).
- Recommended offer: $15k (1.5% below list) — sets the bar for market timing.
- Cap rate 73.2% vs local median 5.9% in Bessemer — top-decile yield for the area; either an underpriced asset or a hidden risk that comps aren't pricing in. Stress-test before assuming the spread holds.
Location & tenants
- Location reads 59/100 on livability (#331 in AL) — a working-class tenant base; expect higher turnover. Strengths: commute A+, cost of living A+, housing A; Watch: crime F, amenities F, employment F.
- Bessemer City (suburban): math 3% / reading 19% proficiency, ranked #120 of 129 in AL (top 93%) — low school quality limits family demand, transient renter base, plan for 1-2y turnover; 87% free/reduced lunch — lower-income household profile, screen leases tightly.
- Zoned schools: Abrams Elementary School (math 2% / reading 17%, grade F, #568 of 627 statewide, top 94%, 254 students, 78% FRL); Bessemer City High School (math 2% / reading 8%, grade F, #276 of 305 statewide, top 95%, 850 students, 61% FRL) — zoned schools average 69% FRL vs 87% district-wide (18 pts lower); this property's tenant base skews higher-income than the district average.
- Market conditions: Rents falling (-3.1%/yr); 115 active listings in the ZIP; 16 comparable units currently listed for rent nearby; rentals at typical pace (median 25d on market — plan ~3-4 weeks tenant-placement turnaround); 44% of comp listings sitting > 30 days — soft ceiling on asking rent; lower-income renter base — watch delinquency; 2,114 units permitted in Jefferson County in 2024 (556 in 5+ unit buildings).
- This rent runs 41% of the median local income ($35k/yr) — at the standard rent-burdened threshold; future hikes will face affordability resistance.
Forward outlook
- Local home prices are declining (-3.0%/yr); year-one equity from $104 of loan paydown is wiped out by about $450 of value loss. Plan a longer hold.
- Jefferson County population projected to shrink 4% by 2050 — rents likely to lag national; underwrite the cash flow, not the appreciation.
- At projected returns (-3.0% appreciation + 0.0% rent growth), your $4k cash investment doubles in ~1 year — after that, you're playing with house money.
Negotiation context
- It's been on market 21 days — a 2% lower offer ($15k) is reasonable based on typical stale-listing flexibility.
Risks & watch-outs
- Watch-outs: built in 1940 — expect roof / HVAC / electrical / plumbing capex.
- Climate carrying-cost: major wind risk, 35% chance of damaging wind over 30y; extreme-heat days projected 7→20/yr by 2055 (HVAC capex compounding) — expect insurance premiums to compound above CPI over the hold.
Questions for the listing agent
- Built in 1940 — when were the roof, HVAC, electrical panel, plumbing, and water heater last replaced?
- Is there a deadline driving the sale (1031 exchange, divorce, estate, relocation)? That informs how much negotiation room exists.
- Schools are D-rated, which usually means shorter tenancies and higher turnover. Who's the typical renter profile here, and what's been the actual vacancy rate?
- Crime grade is F in this area — have there been break-ins, vandalism, or insurance claims at this property in the last 3 years? What carrier currently insures it and at what premium?
- The area grade is low — what's the realistic commute time and amenity access for the typical tenant pool here? Any planned neighborhood developments (good or bad) we should know about?
- What's the average days-on-market for RENTAL listings here right now (not sales)? A rising rental-DOM trend means longer vacancies and softer asking-rent achievability than the comps imply.
- What's the recent tenant-quality profile in this submarket — average credit score on applications, eviction rate, late-payment / NSF rate, and stable-employment percentage? A property-management company in the area should have these aggregated.
- How much new for-sale + rental construction is in the pipeline within 1–3 miles? Heavy new supply typically softens prices + rents 12–24 months out; constrained supply supports both.
Investment metrics
- 1% rule
- 8.04% ✓
- Cap rate
- 73.21%
- Cash-on-cash
- 239.00%
- DSCR
- 11.63
- GRM
- 1.0
CMA / ARV
- ARV (on-the-fly)
- $35,526
- Comps found
- 11
Show comp detail 11 sales within ~0.75 mi
| Address | Dist | Beds/Ba | Sqft | Sold | Price | $/sf | Match |
|---|---|---|---|---|---|---|---|
| 2409 7th Ave N | 0.56mi | 3/1.0 | 1,216 (+6%) | 8mo | $45,000 | $37 | 57 |
| 2608 11th Ave N | 0.29mi | 4/2.0 (+1) | 1,280 (+12%) | 5mo | $156,900 | $123 | 54 |
| 2820 11th Ave N | 0.48mi | 4/1.0 (+1) | 1,191 (+4%) | 16mo | $95,000 | $80 | 53 |
| 1407 27th St N | 0.36mi | 3/1.0 | 1,306 (+14%) | 9mo | $25,000 | $19 | 53 |
| 1822 Short 18th St N | 0.72mi | 3/2.0 | 1,100 (-4%) | 4mo | $146,000 | $133 | 53 |
| 610 N 24th St | 0.60mi | 3/1.0 | 1,122 (-2%) | 20mo | $17,000 | $15 | 52 |
| 1523 15th Ave N | 0.75mi | 3/2.0 | 1,154 (+1%) | 12mo | $142,500 | $123 | 50 |
| 1700 8th Ave N | 0.73mi | 3/1.0 | 1,176 (+3%) | 15mo | $32,500 | $28 | 49 |
| 1301 29th St N | 0.47mi | 3/1.0 | 1,011 (-12%) | 14mo | $31,000 | $31 | 46 |
| 1223 28th St | 0.40mi | 2/1.0 (-1) | 1,252 (+9%) | 19mo | $15,500 | $12 | 45 |
| 1700 N 14th Ave | 0.59mi | 3/1.0 | 1,232 (+8%) | 21mo | $25,000 | $20 | 43 |
Match score weights: distance 35% · size 25% · config 20% · recency 20%. Top-matched comps best support the ARV.
Projected returns pro-forma
-3.0% appreciation · 0.0% rent growth · sell at horizon
- IRR
- —
- Equity multiple
- 12.27×
- Total profit
- $47,340
- Equity at exit
- $2,237
- IRR
- —
- Equity multiple
- 23.92×
- Total profit
- $96,277
- Equity at exit
- $1,297
Cash invested: $4,200 (down + closing). Projections, not guarantees.
Landlord ↔ Tenant lean methodology
- Overall (STATE)
- 90 Strongly Landlord-Friendly
- State Alabama
- 90 Strongly Landlord-Friendly · R+15
- County
- — inherits STATE
- City
- — inherits STATE
ZIP-level market 35020
- Home prices YoY
- -24.2%
- Rents YoY
- -3.1%
- Active inventory
- 115
- Price-to-rent
- 1.0×
Monthly cashflow live
- Estimated rent
- $1,206 high interval (Pro) →
- Mortgage (P&I)
- −$79
- Tax from tax record
- −$31 /mo · $372/yr
- Insurance
- −$6
- HOA
- −$0
- Vacancy / Maint / Mgmt
- −$253
- Net cashflow
- $837
Break-even live
Sensitivity live
| Price | -10% $845 | -5% $841 | +0% $837 | +5% $832 | +10% $828 |
|---|---|---|---|---|---|
| Rent | -10% $741 | -5% $789 | +0% $837 | +5% $884 | +10% $932 |
| Rate | -1.0pp $844 | -0.5pp $840 | base $837 | +0.5pp $833 | +1.0pp $829 |
UW: 25.0% down · 7.5% · 30yr · 1.5% tax · 5.0% vac · 8.0% maint · 8.0% mgmt
Financing live
Cash to close
- Down payment
- $3,750
- Closing costs
- $450
- Reserves months
- —
- Total cash needed
- —
Loan-product check · same deal, 3 products live
Conventional
25% down · 7.5% · 30yr
- Down + closing
- —
- Monthly P&I
- —
- Monthly cashflow
- —
- DSCR
- —
- Eligible?
- —
Personal DTI + credit; lowest rate.
DSCR
20% down · 8.5% · 30yr
- Down + closing
- —
- Monthly P&I
- —
- Monthly cashflow
- —
- DSCR
- —
- Eligible?
- —
No personal income docs; deal must DSCR.
Hard money
10% down · 12.0% · 12mo
- Down + closing
- —
- Monthly P&I
- —
- Monthly cashflow
- —
- DSCR
- —
- Eligible?
- —
Short-term bridge; refi at stabilization.
Rent comps 16 comps
| Address | Beds | Baths | Sqft | Rent | $/sqft | DOM | Units | Dist |
|---|---|---|---|---|---|---|---|---|
| 1315 27th St N Bessemer, AL | 4.0 | 2.0 | 1439 | $1,250 | $0.87 | 44d | 1 | 0.32mi |
| 3019 7th Ave N Bessemer, AL | 3.0 | 1.0 | 1080 | $1,050 | $0.97 | 44d | 1 | 0.84mi |
| 719 16th St N Bessemer, AL | 3.0 | 1.5 | 1085 | $1,075 | $0.99 | 24d | 1 | 0.86mi |
| 817 15th St N Bessemer, AL | 3.0 | 2.0 | 1116 | $1,125 | $1.01 | 3d | 1 | 0.89mi |
| 1929 15th St N Bessemer, AL | 3.0 | 2.0 | 1140 | $1,250 | $1.10 | 20d | 1 | 0.99mi |
| 2234 19th St N Bessemer, AL | 2.0 | 1.0 | 1106 | $975 | $0.88 | 44d | 1 | 1.00mi |
| 2423 Circle Dr Bessemer, AL | 2.0 | 1.0 | 732 | $1,050 | $1.43 | 44d | 1 | 1.11mi |
| 3225 4th Ave N Bessemer, AL | 3.0 | 2.0 | 1486 | $1,300 | $0.87 | 24d | 1 | 1.17mi |
| 1015 11th St N Bessemer, AL | 2.0 | 1.0 | 876 | $975 | $1.11 | 12d | 1 | 1.19mi |
| 2028 13th St N Bessemer, AL | 3.0 | 2.0 | 1372 | $1,073 | $0.78 | 24d | 1 | 1.28mi |
| 1307 3rd Ave N Bessemer, AL | 4.0 | 1.0 | 960 | $1,200 | $1.25 | 44d | 1 | 1.32mi |
| 2129 13th St N Bessemer, AL | 4.0 | 1.0 | 1378 | $1,445 | $1.05 | 15d | 1 | 1.35mi |
| 1314 22nd Ave N Bessemer, AL | 3.0 | 1.0 | 1038 | $1,000 | $0.96 | 44d | 1 | 1.37mi |
| 1623 26th Ave N Bessemer, AL | 2.0 | 1.0 | 1004 | $1,095 | $1.09 | 12d | 1 | 1.43mi |
| 3230 Arlington Ave Bessemer, AL | 2.0 | 2.0 | 1236 | $795 | $0.64 | 44d | 1 | 1.43mi |
| 2832 Clyburne St Bessemer, AL | 3.0 | 2.0 | 1295 | $1,650 | $1.27 | 2d | 1 | 1.47mi |
Listing history 15 events
-
2026-06-18days on market $15,000 Active 21 DOM
-
2026-06-17days on market $15,000 Active 20 DOM
-
2026-06-16days on market $15,000 Active 19 DOM
-
2026-06-15days on market $15,000 Active 18 DOM
-
2026-06-13pricedays on market $15,000 Active 16 DOM
-
2026-06-10days on market $19,000 Active 13 DOM
-
2026-06-09days on market $19,000 Active 12 DOM
-
2026-06-08days on market $19,000 Active 11 DOM
-
2026-06-07days on market $19,000 Active 10 DOM
-
2026-06-05days on market $19,000 Active 7 DOM
-
2026-06-03days on market $19,000 Active 6 DOM
-
2026-06-02days on market $19,000 Active 5 DOM
-
2026-06-01days on market $19,000 Active 4 DOM
-
2026-05-31days on market $19,000 Active 3 DOM
-
2026-05-28$19,000 Active
ⓘ Source: listings_history table (triggers on properties + properties_extension) + one-shot
backfill from property_details.listing_events for pre-trigger history.
Tax reassessment forecast AL · Resets to sale price
- Current annual tax
- $372 · $31/mo
- Projected year-2 tax
- $372 · $31/mo
- Expected delta
- $0/yr ($0/mo · 0.0%)
ⓘ Screening estimate from a state-policy table — verify with the county assessor before closing.
Climate risk First Street
- Flood 4/10 Moderate FEMA zone X (unshaded) · 22% chance over 30 yrs
- Wildfire 3/10 Moderate
- Heat 7/10 Severe 7 d/yr ≥108°F today · 20 d/yr by 30 yrs out
- Wind 6/10 Major 35% chance of damaging wind over 30 yrs
- Air quality 3/10 Moderate 2 unhealthy d/yr today · 5 by 30 yrs out
Nearby sold comps map
Loading sold comps map…
Walkable amenities ~0.75 mi
Loading nearby amenities…
Taxation est. · year 1
- Rental income
- $14,468
- − Mortgage interest
- −$840
- − Property taxes
- −$372
- − Insurance
- −$75
- − Repairs & maintenance
- −$1,157
- − Management
- −$1,157
- − Depreciation
- −$436
- Taxable income
- $10,429
- Est. tax owed @ 24.0%
- −$2,503
- After-tax cash flow
- $7,535/yr
For passive investors: Depreciation is non-cash, so a rental often shows a tax loss while cash-flowing — sheltering income. Rental losses are passive: they offset passive income freely, and up to $25,000/yr can offset ordinary (W-2) income if you actively participate and your MAGI is under $100k (phasing out to $0 by $150k); unused losses carry forward. On sale, claimed depreciation is recaptured at up to 25%, and gains may owe capital-gains tax (a 1031 exchange can defer both). Figures are a year-1 estimate at your 24.0% rate — not tax advice; consult a CPA.
Schools (NCES district)
- District
- Bessemer City
- NCES district ID
- 0100330
- Math proficiency
- 3% ▼ -18.00%
- Reading proficiency
- 19% ▼ -3.00%
- Median HH income
- $29,721
- Composite
- 8.45/100
- National rank
- #9905
- State rank
- #120 of 129 in AL
Livability — Bessemer
- Score
- 59/100
- State rank
- #331
- US rank
- #20078
Category grades
Schools grade is shown separately in the Schools card above.
Census & demographics
- Census place
- Bessemer, AL
- County
- Jefferson County · 527,445 people
- City population
- 48,018
- Metro
- Birmingham-Hoover, AL
- Population (ZIP)
- 24,892
- Household income
- $35,362
- Rent vs Own
- Severe rent burden
- 1001.0
Population outlook (Jefferson County) Hauer SSP2
- Today (2025)
- 669,185 people
- By 2030
- 669,694 · +0.1%
- By 2040
- 661,388 · -1.2%
- By 2050
- 643,086 · -3.9%
- By 2075
- 577,267 · -13.7%
- By 2100
- 474,758 · -29.1%
Race, ethnicity, and origin ACS 2023
- Neighborhood character
- Predominantly Black (74%)
- Race & ethnicity
- Black 74% Hispanic / Latino 13% White 11% Two or more races 6%
- Hispanic origin (detail)
- Mexican 10%
- Foreign-born
- 5% · Canada
- Languages at home
- 89% English-only · Spanish 11%
Political lean MEDSL · Jefferson
- 2024 margin
- D (+10.4) · D 54.6% · R 44.2% · Other 1.2%
- 2008→2024 swing
- +5.4pp toward D · 2008: 5.1pp · 2024: 10.4pp
- All cycles
- 2024: D+10.4 2020: D+13.2 2016: D+7.2 2012: D+6.0 2008: D+5.1
Not yet ingested
- Civics
- —
Market trends
- HPI YoY
- ▼ -57.54%
- Current HPI
- 179.7702
- Rent YoY
- ▼ -3.12%
- Metro
- Birmingham-Hoover, AL
- State GDP YoY
- ▲ 2.94%
- F500 in state
- 4
Industry mix (Fortune 500 HQ in AL)
| Industry | F500 HQs | Revenue |
|---|---|---|
| Financial Services | 1 | $8B |
|
||
| Healthcare | 1 | $5B |
|
||
Price history
1 event — show timeline
- 2026-05-28 Listed $19,000 Greater Alabama MLS
Property tax history
+1.3%/yrLatest (2025): $372 · +0.0% YoY. Source: county tax records.
Cash-flow waterfall
monthlySold comps — $/sqft
last 12 mo · ≤1 miLoading sold comps…