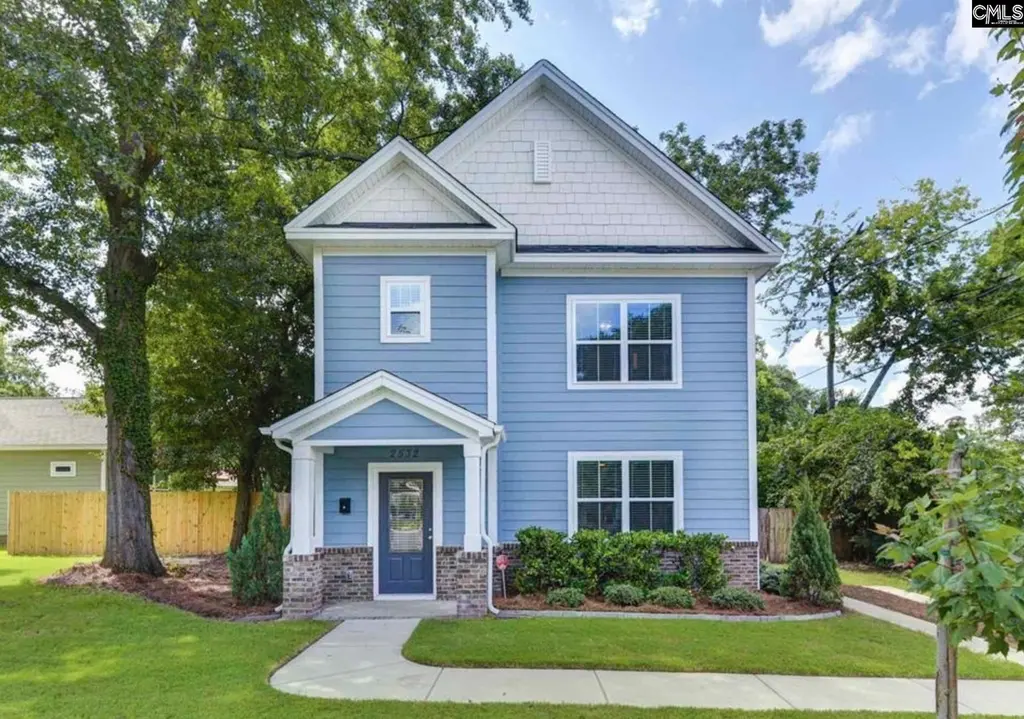
2532 Washington St · Columbia, SC
Flood risk No data
- FEMA flood zone
- —
- Chance of flooding over 30 yrs
- —
- Est. flood insurance / yr
- —
Fire risk No data
- Est. fire insurance / yr
- —
Heat risk No data
- Hot days now (above threshold)
- —
- Hot days in 30 yrs
- —
Wind risk No data
- Chance of severe wind over 30 yrs
- —
Air-quality risk No data
- Unhealthy air days now
- —
- Unhealthy air days in 30 yrs
- —
Risk factors via First Street. Map © Google.
Why this score? — see what drove the D- grade
The composite is a weighted blend of 9 inputs, each scored 0–100. Each bar is that input's sub-score; the figure is the points it added to the 100-point composite (weight × sub-score).
- Cash flow +12.1/30.0
- ARV discount +7.5/15.0
- Livability +3.9/5.0
- Rent growth +3.7/5.0
- DSCR +3.6/10.0
- 1% rule +2.6/10.0
- Schools +2.6/10.0
- Condition / age +2.5/5.0
- Appreciation +0.0/10.0
$290,000
🖨 Deal sheet 📄 Offer letter ✓ Due diligence
Listing remarks
Perfectly positioned in the heart of Columbia, this beautifully updated home places you just minutes from University of South Carolina, Fort Jackson, and Downtown. Whether you're looking to grow your investment portfolio, or step into homeownership in a prime downtown location, this property offers exceptional value and convenience. Inside, oversized marble tile flooring flows throughout the main level, creating a clean, modern feel from the entry through the living and dining areas. The kitchen has been thoughtfully refreshed with quartz marble countertops, refinished cabinetry, updated hardware, a deep sink, and a window overlooking the backyard. Abundant cabinet storage and a comfortable
Key facts
- Custom organization
- Fenced backyard
- 5,227 sq ft lot
Tags
Property features AI
Finance
- Other:
- Financial info:
- HOA & community:
Exterior
- Parking:
- Security:
- Utilities: Public water; Public sewer; Cable TV available
- Home design: Two-story home; Fiber cement (Hardy Plank) exterior finish; Paved road access
- Construction: Slab foundation
- Exterior features: Partial gutters; Covered front porch; Covered back porch; Rear wood privacy fence
Interior
- Kitchen: Eat-in kitchen with pantry; Painted cabinets; Quartz countertops; Tile flooring; Recessed lighting; Microwave above stove; Free-standing smooth-surface range; Dishwasher
- Bedrooms: Master suite on second floor with private bath, walk-in closet, tub/shower and tile floors; Second bedroom on second floor with closet and tile floors; Third bedroom on second floor with closet and tile floors
- Flooring: Tile floors in main living areas and bedrooms
- Bathrooms: Two full bathrooms; One half bathroom; Second full bathroom (additional full bath on second level)
- Heating & cooling: Central cooling; Heat pump serving the first level
- Interior features: Ceiling fans throughout; Smoke detector; Attic access; Fireplace in great room; Great room with tile floors and recessed lighting
- Laundry & utility: Main-level laundry in heated mud room; Tankless gas water heater
Neighborhood map
What this means for you Summary
Snapshot
- This is a 3-bed/3.0-bath single-family listed at $290k.
Deal economics
- At list price, monthly cash flow is $-66 ($-794/yr) — negative.
- To cash-flow at today's rent, offer at most $278k (4.0% below list).
- To meet the 1% rule (rent ≥ 1% of price), the offer needs to be $219k (24.4% below list).
- Recommended offer: $219k (24.4% below list) — sets the bar for 1% rule.
Location & tenants
- Location reads 78/100 on livability (#18 in SC, #2,436 nationally) — a middle-class / working-renter tenant base. Strengths: amenities A+, commute A+, cost of living A+; Watch: employment D, crime F.
- Richland 01 (urban): math 26% / reading 36% proficiency, ranked #54 of 80 in SC (top 68%) — families likely to look elsewhere, expect single-tenant / working-renter base with shorter leases; 64% free/reduced lunch — lower-income household profile, screen leases tightly.
- Zoned schools: Carver-Lyon Elementary (math 27% / reading 27%, grade F, #421 of 597 statewide, top 73%, 387 students, 100% FRL); A. C. Flora High (math 42% / reading 92%, grade B, #73 of 196 statewide, top 41%, 1,352 students, 100% FRL) — zoned schools average 100% FRL vs 64% district-wide (36 pts higher); higher-poverty schools than district average — tighter screening recommended.
- Zoned-school proficiency averages 47% at this address vs 31% district-wide (+16 pts) — the actual schools serving this property are materially stronger than the Richland 01 average implies; a family-tenant draw the district grade alone would hide.
- Market conditions: Rents rising fast (+4.7%/yr); 116 active listings in the ZIP; 18 comparable units currently listed for rent nearby; rentals at typical pace (median 24d on market — plan ~3-4 weeks tenant-placement turnaround); 3,472 units permitted in Richland County in 2024 (1,096 in 5+ unit buildings).
- At $2,192/mo this rent would consume 52% of the median local household income ($50k/yr) (locally 1045% of renters already pay >50% of income on rent) — very limited rent-growth headroom before tenants either downsize or default.
Forward outlook
- Local home prices are declining (-3.0%/yr); year-one equity from $2k of loan paydown is wiped out by about $9k of value loss. Plan a longer hold.
- Richland County population projected at +30% by 2050 — long-run rental-demand tailwind backs the buy-and-hold thesis.
Negotiation context
- It's been on market 21 days — a 2% lower offer ($286k) is reasonable based on typical stale-listing flexibility.
- 5 sale attempts since 5y ago with the ask held roughly flat each time — persistent listings suggest the price (not the market) is what's stuck; bring a comps-based counter.
Questions for the listing agent
- What do current leases actually rent for vs. the listed asking? Can we see a recent rent roll and the last 12 months of T-12 income?
- Is there a deadline driving the sale (1031 exchange, divorce, estate, relocation)? That informs how much negotiation room exists.
- Schools are D-rated, which usually means shorter tenancies and higher turnover. Who's the typical renter profile here, and what's been the actual vacancy rate?
- Crime grade is F in this area — have there been break-ins, vandalism, or insurance claims at this property in the last 3 years? What carrier currently insures it and at what premium?
- The area grade is low — what's the realistic commute time and amenity access for the typical tenant pool here? Any planned neighborhood developments (good or bad) we should know about?
- What's the average days-on-market for RENTAL listings here right now (not sales)? A rising rental-DOM trend means longer vacancies and softer asking-rent achievability than the comps imply.
- What's the recent tenant-quality profile in this submarket — average credit score on applications, eviction rate, late-payment / NSF rate, and stable-employment percentage? A property-management company in the area should have these aggregated.
- How much new for-sale + rental construction is in the pipeline within 1–3 miles? Heavy new supply typically softens prices + rents 12–24 months out; constrained supply supports both.
Investment metrics
- 1% rule
- 0.76% ✗
- Cap rate
- 6.02%
- Cash-on-cash
- -0.98%
- DSCR
- 0.96
- GRM
- 11.0
CMA / ARV
- ARV (on-the-fly)
- $188,790
- Comps found
- 1
Show comp detail 1 sale within ~0.75 mi
| Address | Dist | Beds/Ba | Sqft | Sold | Price | $/sf | Match |
|---|---|---|---|---|---|---|---|
| 2412 Richland St | 0.55mi | 3/2.0 | 1,210 (-7%) | 14mo | $175,000 | $145 | 47 |
Match score weights: distance 35% · size 25% · config 20% · recency 20%. Top-matched comps best support the ARV.
Projected returns pro-forma
-3.0% appreciation · 4.73% rent growth · sell at horizon
- IRR
- -16.2%
- Equity multiple
- 0.42×
- Total profit
- $-47,418
- Equity at exit
- $43,240
- IRR
- -5.4%
- Equity multiple
- 0.62×
- Total profit
- $-30,597
- Equity at exit
- $25,074
Cash invested: $81,200 (down + closing). Projections, not guarantees.
Landlord ↔ Tenant lean methodology
- Overall (STATE)
- 90 Strongly Landlord-Friendly
- State South Carolina
- 90 Strongly Landlord-Friendly · R+6
- County
- — inherits STATE
- City
- — inherits STATE
ZIP-level market 29204
- Home prices YoY
- -34.9%
- Rents YoY
- 4.7%
- Active inventory
- 116
- Price-to-rent
- 11.0×
Monthly cashflow live
- Estimated rent
- $2,192 high interval (Pro) →
- Mortgage (P&I)
- −$1,521
- Tax from tax record
- −$156 /mo · $1,874/yr
- Insurance
- −$121
- HOA
- −$0
- Vacancy / Maint / Mgmt
- −$460
- Net cashflow
- $-66
Break-even live
UW: 25.0% down · 7.5% · 30yr · 1.5% tax · 5.0% vac · 8.0% maint · 8.0% mgmt
Financing live
Cash to close
- Down payment
- $72,500
- Closing costs
- $8,700
- Reserves months
- —
- Total cash needed
- —
Loan-product check · same deal, 3 products live
Conventional
25% down · 7.5% · 30yr
- Down + closing
- —
- Monthly P&I
- —
- Monthly cashflow
- —
- DSCR
- —
- Eligible?
- —
Personal DTI + credit; lowest rate.
DSCR
20% down · 8.5% · 30yr
- Down + closing
- —
- Monthly P&I
- —
- Monthly cashflow
- —
- DSCR
- —
- Eligible?
- —
No personal income docs; deal must DSCR.
Hard money
10% down · 12.0% · 12mo
- Down + closing
- —
- Monthly P&I
- —
- Monthly cashflow
- —
- DSCR
- —
- Eligible?
- —
Short-term bridge; refi at stabilization.
Rent comps 18 comps
| Address | Beds | Baths | Sqft | Rent | $/sqft | DOM | Units | Dist |
|---|---|---|---|---|---|---|---|---|
| 1318 House St Columbia, SC | 4.0 | 4.0 | 1500 | $2,900 | $1.93 | 23d | 2 | 0.12mi |
| 1121 Zeigler St Unit B Columbia, SC | 3.0 | 2.5 | 1550 | $3,300 | $2.13 | 21d | 1 | 0.24mi |
| 2347 Stark St Columbia, SC | 2.0 | 1.0 | 876 | $1,100 | $1.26 | 23d | 1 | 0.57mi |
| 2511 Chestnut St Columbia, SC | 2.0 | 1.0 | 928 | $1,300 | $1.40 | 14d | 1 | 0.69mi |
| 2229 Greene St Columbia, SC | 3.0 | 2.0 | 1050 | $1,695 | $1.61 | 19d | 1 | 0.73mi |
| 3040 Girardeau Ave Columbia, SC | 3.0 | 1.5 | 1400 | $2,150 | $1.54 | 14d | 1 | 0.80mi |
| 3040 Girardeau Ave Columbia, SC | 3.0 | 1.5 | 1400 | $2,150 | $1.54 | 23d | 1 | 0.80mi |
| 2710 Preston St Columbia, SC | 2.0 | 1.0 | 1000 | $1,495 | $1.50 | 23d | 1 | 0.82mi |
| 2834 Keats St Columbia, SC | 3.0 | 2.0 | 921 | $2,250 | $2.44 | 14d | 1 | 0.82mi |
| 1018 Laurens St Columbia, SC | 3.0 | 1.0 | 1500 | $2,700 | $1.80 | 23d | 1 | 0.87mi |
| 1840 Hampton St Unit 1 Columbia, SC | 4.0 | 2.0 | 1056 | $1,795 | $1.70 | 23d | 1 | 0.91mi |
| 1840 Hampton St Unit 3 Columbia, SC | 4.0 | 2.0 | 1514 | $1,895 | $1.25 | 23d | 1 | 0.91mi |
| 3111 Kline St Columbia, SC | 2.0 | 2.0 | 950 | $1,850 | $1.95 | 23d | 1 | 0.94mi |
| 2002 Greene St Columbia, SC | 2.0 | 1.0–2.0 | 795 | $1,325 | $1.67 | 14d | 1 | 0.98mi |
| 614 Capitol Pl Columbia, SC | 2.0 | 1.0 | 1200 | $1,895 | $1.58 | 14d | 1 | 1.25mi |
| 1520 Senate St Columbia, SC | 2.0 | 1.5 | 1045 | $2,300 | $2.20 | 23d | 1 | 1.28mi |
| 2050 N Beltline Blvd Columbia, SC | 1.0–2.0 | 1.0–1.5 | 831 | $1,042 | $1.25 | 14d | 6 | 1.38mi |
| 3419 Piedmont Ave Columbia, SC | 3.0 | 1.0 | 1100 | $1,195 | $1.09 | 23d | 1 | 1.47mi |
Listing history 14 events
-
2026-05-02status Pending
-
2026-04-17historical Active - Contingent
-
2026-04-11$290,000 Active
-
2026-04-11historical
-
2026-03-11price $290,000
-
2026-02-19$300,000 Active
-
2026-01-22historical $2,450
-
2025-11-25$2,450
-
2024-01-02soldstatus $262,000
-
2023-11-16status Pending
-
2023-10-29$265,000 Active
-
2021-09-27soldstatus $209,900
-
2021-08-10historical
-
2021-08-05$199,900 Active
ⓘ Source: listings_history table (triggers on properties + properties_extension) + one-shot
backfill from property_details.listing_events for pre-trigger history.
Tax reassessment forecast SC · Resets to sale price
- Current annual tax
- $1,874 · $156/mo
- Projected year-2 tax
- $1,874 · $156/mo
- Expected delta
- $0/yr ($0/mo · 0.0%)
ⓘ Screening estimate from a state-policy table — verify with the county assessor before closing.
Nearby sold comps map
Loading sold comps map…
Walkable amenities ~0.75 mi
Loading nearby amenities…
Taxation est. · year 1
- Rental income
- $26,304
- − Mortgage interest
- −$16,245
- − Property taxes
- −$1,874
- − Insurance
- −$1,450
- − Repairs & maintenance
- −$2,104
- − Management
- −$2,104
- − Depreciation
- −$8,436
- Taxable loss
- −$5,910
- Est. tax savings @ 24.0%
- +$1,418
- After-tax cash flow
- $625/yr
For passive investors: Depreciation is non-cash, so a rental often shows a tax loss while cash-flowing — sheltering income. Rental losses are passive: they offset passive income freely, and up to $25,000/yr can offset ordinary (W-2) income if you actively participate and your MAGI is under $100k (phasing out to $0 by $150k); unused losses carry forward. On sale, claimed depreciation is recaptured at up to 25%, and gains may owe capital-gains tax (a 1031 exchange can defer both). Figures are a year-1 estimate at your 24.0% rate — not tax advice; consult a CPA.
Schools (NCES district)
- District
- Richland 01
- NCES district ID
- 4503360
- Math proficiency
- 26% ▼ -7.00%
- Reading proficiency
- 36% ▼ -5.00%
- Median HH income
- $38,931
- Composite
- 25.94/100
- National rank
- #7335
- State rank
- #54 of 80 in SC
Livability — Columbia
- Score
- 78/100
- State rank
- #18
- US rank
- #2436
Category grades
Schools grade is shown separately in the Schools card above.
Census & demographics
- Census place
- Columbia, SC
- County
- Richland County · 389,530 people
- City population
- 335,994
- Metro
- Columbia, SC
- Population (ZIP)
- 18,159
- Household income
- $50,189
- Rent vs Own
- Severe rent burden
- 1045.0
Population outlook (Richland County) Hauer SSP2
- Today (2025)
- 459,667 people
- By 2030
- 487,524 · +6.1%
- By 2040
- 542,035 · +17.9%
- By 2050
- 595,371 · +29.5%
- By 2075
- 732,998 · +59.5%
- By 2100
- 820,415 · +78.5%
Race, ethnicity, and origin ACS 2023
- Neighborhood character
- Diverse neighborhood (Simpson 0.57)
- Race & ethnicity
- Black 48% White 44% Two or more races 3% Asian 3% Hispanic / Latino 2%
- Common ancestry
- Serbian 2% Slovak 2% Italian 1%
- Foreign-born
- 3% · Canada
- Languages at home
- 93% English-only · Spanish 2% Tagalog/Filipino 1% Arabic 1%
Political lean MEDSL · Richland
- 2024 margin
- Solid D (+34.6) · D 66.4% · R 31.8% · Other 1.8%
- 2008→2024 swing
- +5.7pp toward D · 2008: 28.9pp · 2024: 34.6pp
- All cycles
- 2024: D+34.6 2020: D+38.3 2016: D+32.9 2012: D+33.3 2008: D+28.9
Not yet ingested
- Civics
- —
Market trends
- HPI YoY
- ▼ -104.76%
- Current HPI
- 195.2246
- Rent YoY
- ▲ 4.73%
- Metro
- Columbia, SC
- State GDP YoY
- ▲ 4.51%
- F500 in state
- 2
Industry mix (Fortune 500 HQ in SC)
| Industry | F500 HQs | Revenue |
|---|---|---|
| Packaging | 1 | $7B |
|
||
Price history
+45.1% since first listed14 events — show timeline
- 2026-05-02 Pending — Consolidated MLS
- 2026-04-17 Contingent — Consolidated MLS
- 2026-04-11 Listed $290,000 Consolidated MLS
- 2026-04-11 Delisted — Consolidated MLS
- 2026-03-11 Price Changed $290,000 Consolidated MLS
- 2026-02-19 Listed $300,000 Consolidated MLS
- 2026-01-22 Rental Removed $2,450 BUILDIUM
- 2025-11-25 Listed for Rent $2,450 BUILDIUM
- 2024-01-02 Sold (Public Records) $262,000 Public Records
- 2023-11-16 Pending — Consolidated MLS
- 2023-10-29 Listed $265,000 Consolidated MLS
- 2021-09-27 Sold (Public Records) $209,900 Public Records
- 2021-08-10 Delisted — Consolidated MLS
- 2021-08-05 Listed $199,900 Consolidated MLS
Property tax history
+12.7%/yrLatest (2025): $1,874 · -73.9% YoY. Source: county tax records.
Cash-flow waterfall
monthlySold comps — $/sqft
last 12 mo · ≤1 miLoading sold comps…